Year XXI, No. 1, 2015, pp. 69-83
Comparative Analysis of Risk, Return and Diversification
of Mutual Fund
R. Ahmad, A. Nomani
Rais Ahmad, Abuzar Nomani
Dept of Agricultural Economics and Business Management A.M.U Aligarh, India
Abstract
Mutual Funds have become a widely popular and effective way for investors to participate in financial markets in an easy, low-cost fashion, while muting risk characteristics by spreading the investment across different types of securities, also known as diversification. It can play a central role in an individual's investment strategy. With the plethora of schemes available in the Indian markets, an investors needs to evaluate and consider various factors before making an investment decision. The present investigation is aimed to examine the performance of safest investment instrument in the security market in the eyes of investors. Five mutual fund large cap scheme have been selected for this purpose.
selecting the best investment alternative out of the galaxy of investment alternatives.
Keywords: Risk, Return, Diversification, Sharpe Ratio, Standard Deviation, Alpha
Introduction
Mutual Funds over the years have gained immensely in their popularity. Apart from the many advantages that investing in mutual funds provide like diversification, professional management, the ease of investment process has proved to be a major enabling factor. However, with the introduction of innovative products, the world of mutual funds nowadays has a lot to offer to its investors. The industry broadly caters to all types of investors depending on their risk return preferences. A mutual fund is the ideal investment vehicle for today's complex and modern financial scenario. Mutual funds offer several advantages over investing in individual stocks, including diversification and professional management. A mutual fund may hold investments in dozens of stocks, thus reducing the risk associated with owning any particular stock. A Mutual Fund is a pure intermediary that performs a basic function of buying and selling securities on behalf of its unit holders. Mutual Fund is a body corporate which pools up the money from different types of investors and invests those funds on behalf of the investors in diversified securities. In other words, a mutual fund allows an investor to take a position indirectly in a basket of assets. A majority of investors are quite content in simply analysing the appreciation in the net asset value (NAV) of their investment. They are not much more concerned about the risk associated with the investment alternative. Risk measure mostly deal with the character of a fund’s returns and the manner in which these returns have been achieved.
Equity funds
different types of shares. Also, it is usually easier and less expensive to invest in equity funds, than to buy each and every stock in a fund‘s portfolio. Equity funds are also cheaper; they're a way to avoid the often higher transaction costs and lower liquidity associated with trading individual stocks. The present research will explore the measures of risk and return for the selected mutual fund schemes.
Literature review
Harry Markowitz (1952) provides a theory about how investors should select securities for their investment portfolio given beliefs about future performance. He claims that rational investors consider higher expected return as good and high variability of those returns as bad. From this simple construct, he says that the decision rule should be to diversify among all securities, securities which give the maximum expected returns. His rule recommends that the portfolio with the highest return is not the one with the lowest variance of returns and that there is a rate at which an investor can increase return by increasing variance. This is the cornerstone of portfolio theory as we know it.
William Sharpe (1964) and John Lintner (1965) separately extend the work of Markowitz. They show that the theory implies that the rates of return from efficient combinations of risky assets move together perfectly (will be perfectly correlated). This could result from their common dependence on general economic activity. If this is so, diversification among risky assets enables investors to escape from all risks, except the risk resulting from changes in economic activity. Therefore, only the responsiveness of an asset return to changes in economic activity is relevant in assessing its risk. Investors only need to be concerned with systematic risk [beta], not the total risk proposed by Markowitz
Veit and Cheney (1982) investigated the ability of mutual funds managers to adjust the risk level of funds to leverage the ability to time the market. They test the null hypothesis that alphas and betas are the same in bull and bear market using annual data for 74 funds over the 1944-78 periods. The sample was sub-divided into balanced funds, income and growth to examine differential effects by investment objective.
India, which shows that the bond funds have emerged as winners, while equity funds plunged deeper into red.
The Intelligent Investor (2000), a leading business magazine conducted a Comprehensive survey of mutual fund performance 1999 to help the investors to choose the funds that best suits their needs. The survey is based on data source from credence, the Mumbai - based monitor of mutual fund performance, with a cut off date for the survey of December 31, 1999. The methodology and the performance parameters they used are; the three months return and one-year return calculated by taking the percentage change in net asset values, adjusted for rights, bonuses and dividends, if any in the interim; the three-year and five-year returns are likewise adjusted and annualized.
Blake David and Timmermann Allan (2003) in their assessment “Performance Persistence in Mutual Funds: An Independent Assessment of the Studies prepared by Charles River Associates for the Investment Management Association” believed that there is a reasonable case for arguing that risk-adjusted past performance data should be included in the FSA’s Comparative Tables. They argued that this is not because of the traditional argument over whether superior performance might or might not persist, which we regard as inconclusive, but rather because of the evidence that inferior performance seems to persist. They considered that it is important for investors to have easy access to reliable information on underperforming funds so they can modify their investment strategies accordingly.
Shanmugham (2000) conducted a survey of 201 individual investors to study the information sourcing by investors, their perceptions of various investment strategy dimensions and the factors motivating share investment decisions, and reports that among the various factors - psychological and sociological - dominated the economic factors in share investment decisions.
Objectives of the study
The present study aims to achieve the following objectives by considering the main objective as to select the best Mutual fund among selected eight schemes during the period of study:
I. To compare and analyse the best Mutual Fund schemes of the selected mutual fund players.
III. To find out the best Mutual Fund scheme in terms of return over the selected period of study.
IV. To suggest the means to improve return by investment in mutual funds.
V. To compare the risk associated with the mutual fund schemes.
Research methodology
The present investigation is aimed to examine the performance of the safest investment instrument in the security market in the eyes of investors i.e., mutual funds by specially focusing on equity schemes. Five mutual fund schemes have been selected for this purpose. The examination is achieved by assessing various financial tests. To carry out the research, the following methodology is adopted:
Data collection
The present research is a study of examining and analysing selected mutual fund schemes by using different financial and statistical tools. The Large cap schemes taken for this purpose are:
HDFC Top 200 Fund (G)
DSP-BR Top 100 Equity - RP (G)
ICICI Pru Top 100 Fund -Inst –I
Franklin India Bluechip (G)
Birla SL Frontline Equity -A (G)
This study compares five funds launched by public/private sector, and foreign mutual fund players in India. The schemes have been selected using deliberate sampling method subject to the criteria mentioned:
A. All the funds are taken as per the ranking done by CRICL
B. Considering corpus size of AMC 25 crore to 1000 crore
C. The funds that have been consider as the minimum investment 500 and maximum 100000 Rs
D. The performances of funds are calculated on the bases of their risk and return
E. Closing Net Asset Values (NAV) of the selected funds are taken on monthly basis.
Tools and techniques
The collected data have been analysed on basis of returns of last one month, six months, one year, three years and five years. Various statistical and financial techniques namely, Standard Deviation and Sharpe ratio has been used to measure volatility of returns and returns per unit of risk. Furthermore, Coefficient of determination (R2), Expenses ratio and Corpus size of funds have also been evaluated. In addition to these tools, various tables and graphs has also been used to make the data presentable and easy to understand.
(I) Sharpe's Ratio
Sharpe ratio reflects the additional return over the Risk-Free return per unit of its variability. It is basically return per unit of risk. The rule states that the higher the Sharpe ratio, the better the fund's performance is in relation to the amount of fluctuation. It can be explained through the formula:
where: S = Sharpe's Index;
rp = average monthly return of fund;
rf = risk free return Risk free return (rf) is taken as 3.40% per annum
(II) Standard Deviation
It is possibly one of the most common risk measure used in assessment of portfolios - be it of mutual funds or any other investment product. It is used to measure the variation in the individual return from the average expected return, over a certain period. Standard deviation is used in the concept of risk of a portfolio of investment. Higher Standard Deviation means a greater fluctuation in expected return.
where: Y = fund return
(III) Beta (β)
risk-free investment is zero. The higher the Beta value, the higher the degree of Correlation with the market index and the fund will be.
where: X = Index return Y = fund return
(IV) Jensen's Alpha (Differential Return)
Jensen's Alpha reflects the return that is expected for the scheme given the risk exposure of the scheme and compares that with the return actually realized over the period under study. If the actual return of the fund is more than the return as predicted by its Beta, then it has a positive alpha, and if it returns less than the amount predicted by Beta, the fund has a negative alpha. A fund's return and its risk both contribute to its Alpha value. The higher a funds’ risk level, the greater the returns. It must generate in order to produce a high Alpha which becomes more volatile. Systematic risk can be reduced through proper diversification of the portfolio of the fund.
where: X =Index return; Y = fund return
(V) R-Squared
Analysis and interpretation
The data collected of selected mutual fund schemes have been analysed into two parts:
A) Analysis on the basis of returns over the period of time Returns are calculated periodically on the basis of various time periods after that rankings have also been provided to the selected equity schemes. Returns of Last:
I. One Month
II. Six Months
III. One Year
IV. Three Years
V. Five Years
B) Performance evaluation of Selected Funds
Performance Evaluation has been done on the basis of risk and return evaluation.
I. Corpus Size
II. Beta
III. Alpha
IV. Standard Deviation
V. R-Squared
VI. Expenses Ratio
C) Analysis on the on the bases of diversification
One of the main advantages of investing in mutual funds is risk diversification. Thus, fund managers have different risk levels to achieve financial schemes objectives. A diversified fund contrasts with specialized or focused funds, such as sector funds, which focus on stocks in specific sectors such as biotechnology, pharmaceuticals or utilities, or in particular regions such as Asia or Europe.
Analysis of large cap scheme
usually widely researched and information is widely available. The selected large cap funds are:
HDFC Top 200 Fund (G)
DSP-BR Top 100 Equity - RP (G) ICICI Pru Top 100 Fund -Inst –I Franklin India Bluechip (G) Birla SL Frontline Equity -A (G)
A) Analysis on the basis of returns over the period of time Returns are calculated periodically on the basis of various time periods like monthly, six months, one year, three years and five years. After that rankings have also been Provided to these selected equity-diversified mutual fund schemes. These are stated below:
HDFC Top 200 Fund (G)
DSP-BR Top 100 Equity - RP (G) ICICI Pru Top 100 Fund -Inst –I Franklin India Bluechip (G) Birla SL Frontline Equity -A (G)
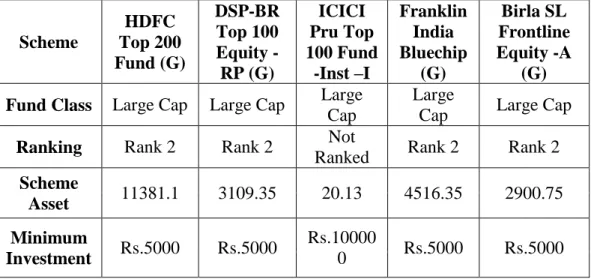
Table no. 1. Returns of Equity Mutual Fund schemes as on July 2012
Scheme
HDFC Top 200 Fund (G)
DSP-BR Top 100 Equity - RP (G)
ICICI Pru Top 100 Fund
-Inst –I
Franklin India Bluechip
(G)
Birla SL Frontline Equity -A
(G)
Fund Class Large Cap Large Cap Large Cap
Large
Cap Large Cap
Ranking Rank 2 Rank 2 Not
Ranked Rank 2 Rank 2
Scheme
Asset 11381.1 3109.35 20.13 4516.35 2900.75
Minimum
Investment Rs.5000 Rs.5000
Rs.10000
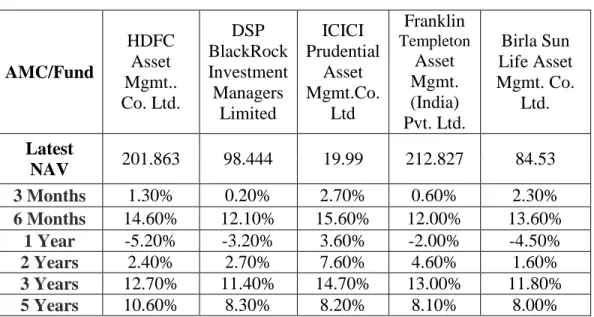
AMC/Fund
HDFC Asset Mgmt.. Co. Ltd.
DSP BlackRock Investment Managers
Limited
ICICI Prudential
Asset Mgmt.Co.
Ltd
Franklin
Templeton
Asset Mgmt. (India) Pvt. Ltd.
Birla Sun Life Asset Mgmt. Co.
Ltd.
Latest
NAV 201.863 98.444 19.99 212.827 84.53
3 Months 1.30% 0.20% 2.70% 0.60% 2.30%
6 Months 14.60% 12.10% 15.60% 12.00% 13.60%
1 Year -5.20% -3.20% 3.60% -2.00% -4.50%
2 Years 2.40% 2.70% 7.60% 4.60% 1.60%
3 Years 12.70% 11.40% 14.70% 13.00% 11.80%
5 Years 10.60% 8.30% 8.20% 8.10% 8.00%
Source: Calculated data
Table no. 1 explores the returns of selected funds over a period of time for different periods. In terms of last one year returns i.e. from August 11 to July 12; ICICI Pru Top 100 stood at number one with the maximum returns of 3.60% during the selected period. It is followed by Franklin India and DSP-BR Top 100 fund with the returns of -2.00% and 3.20% respectively. Birla SL Frontline Selected has given returns -4.50% over that period. HDFC Top 200 Fund has given the least return -5.20%. But in long run i.e. for the period of five years HDFC Top 200 Fund (G) has performed well among the selected scheme. During the period of study Franklin India Bluechip (G) has the highest NAV value 212.827.
B) Performance evaluation of Selected Funds
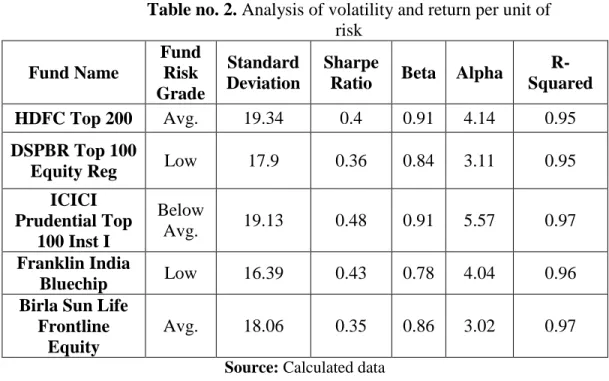
Table no. 2. Analysis of volatility and return per unit of risk
Fund Name
Fund Risk Grade
Standard Deviation
Sharpe
Ratio Beta Alpha
R-Squared
HDFC Top 200 Avg. 19.34 0.4 0.91 4.14 0.95
DSPBR Top 100
Equity Reg Low 17.9 0.36 0.84 3.11 0.95
ICICI Prudential Top
100 Inst I
Below
Avg. 19.13 0.48 0.91 5.57 0.97
Franklin India
Bluechip Low 16.39 0.43 0.78 4.04 0.96
Birla Sun Life Frontline
Equity
Avg. 18.06 0.35 0.86 3.02 0.97
Source: Calculated data
Fig. no. 1 Graph showing the status of Std.Deviation
Higher standard Deviation means a greater fluctuation in expected return. The most volatile fund is HDFC Top 200 as it is having the standard deviation of 19.34, which is followed by ICICI Prudential Top 100 Inst19.13 and Birla Sun Life Frontline Equity18.06. It indicates
14.515 15.516 16.517 17.518 18.519 19.520
HDFC Top 200
DSPBR Top 100 Equity
Reg
ICICI Prudential
Top 100 Inst I
Franklin India Bluechip
Birla Sun Life Frontline
that out of the selected schemes the most risky fund is of HDFC Top 200. As the standard deviation is an unsystematic risk which is not going to minimize through diversification. It is beyond the control of investors.
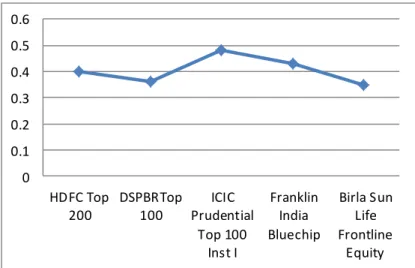
Fig. no. 2. Graph showing the status of Sharpe Ratio
Sharpe ratio reflects the additional return over the Risk-Free return per unit of its variability. In terms of returns, the scheme i.e. ICICI Prudential Top 100 Inst I is having maximum returns per unit of risk (0.48). Followed by Franklin India Blue-chip (0.43) and HDFC Top 200 (0.40). Least return provider is the fund which is having the maximum risk in terms of std. deviation and beta, i.e. Birla Sun Life Frontline Equity (0.35).
0 0.1 0.2 0.3 0.4 0.5 0.6
HDFC Top 200
DSPBRTop 100
ICIC Prudential
Top 100 Inst I
Franklin India Bluechip
Birla Sun Life Frontline
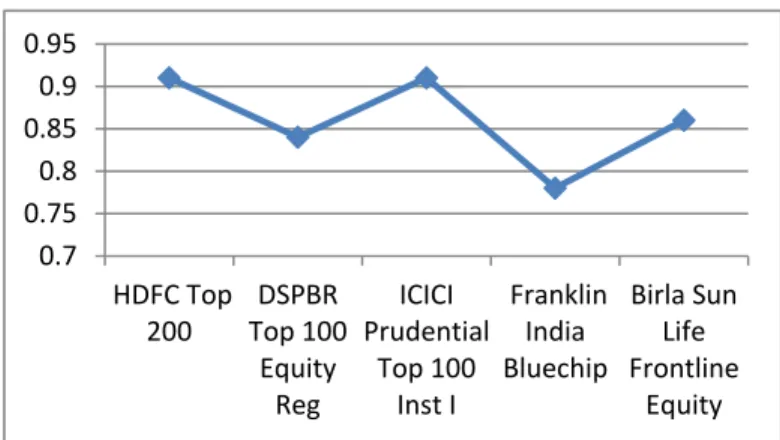
Fig. no. 3. Graph showing the status of Beta
0.7 0.75 0.8 0.85 0.9 0.95
HDFC Top 200
DSPBR Top 100
Equity Reg
ICICI Prudential
Top 100 Inst I
Franklin India Bluechip
Birla Sun Life Frontline
Equity
Beta of the Index is always being 1 (with itself). Beta of a risk-free investment is zero. More the Beta value, the higher the degree of correlation with the market index. The statement regarding risk is supported by the calculation of beta. Again HDFC, ICICI prudential, and Equity proved the most risky schemes as they are having maximum of beta (0.91, 0.91, and 0.86 respectively). Least risky scheme Franklin India Blue-chip in terms of Standard Deviation and Beta. Beta is a systematic risk that can be minimized through diversification.
C) Analysis on the on the bases of diversification
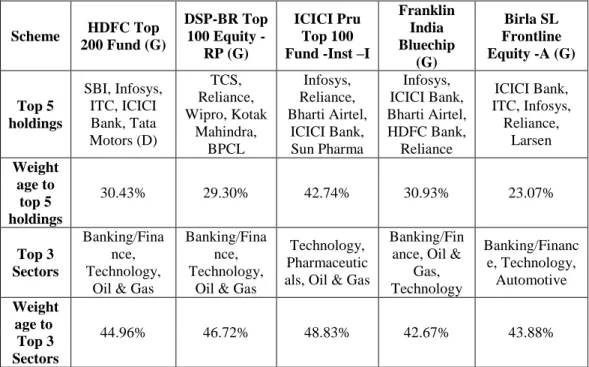
Table no. 3. Allocation of funds in different sectors
Scheme HDFC Top
200 Fund (G)
DSP-BR Top 100 Equity -
RP (G)
ICICI Pru Top 100 Fund -Inst –I
Franklin India Bluechip (G) Birla SL Frontline Equity -A (G)
Top 5 holdings SBI, Infosys, ITC, ICICI Bank, Tata Motors (D) TCS, Reliance, Wipro, Kotak Mahindra, BPCL Infosys, Reliance, Bharti Airtel, ICICI Bank, Sun Pharma Infosys, ICICI Bank, Bharti Airtel, HDFC Bank, Reliance ICICI Bank, ITC, Infosys, Reliance, Larsen Weight age to top 5 holdings
30.43% 29.30% 42.74% 30.93% 23.07%
Top 3 Sectors
Banking/Fina nce, Technology,
Oil & Gas
Banking/Fina nce, Technology,
Oil & Gas
Technology, Pharmaceutic als, Oil & Gas
Banking/Fin ance, Oil &
Gas, Technology Banking/Financ e, Technology, Automotive Weight age to Top 3 Sectors
44.96% 46.72% 48.83% 42.67% 43.88%
Large cape mutual funds are expected to offer the advantages of Diversification, Market timing and Selectivity. In the sample, ICICI Pru Top 100 Fund -Inst –I is found to be highly diversified fund and because of high diversification it has reduced total risk of the portfolio. Whereas, Birla SL Frontline Equity -A (G) is low diversified and because of low diversification its total risk is found to be very high.
Conclusions
returns per unit of risk, i.e., Sharpe ratio (0.48). Further research could aim to extend the data set to include more equity diversified mutual funds, and also to enlarge the time scope to investigate whether the market has changed (improved) over time.
Suggestions
The main objective of the investment is to get return from investment from the mutual funds. An investor should take following points into consideration to earn good returns:
An investor should assess his risk profile before investing in any fund.
To select a fund with good past records of returns. Usually, an investor should select a fund, which is less volatile.
An investor should select a portfolio of three to five funds which are less volatile in nature, and a good track record of consistent returns.
For selection of a good fund, investor can compare the return of the fund with the industry average and benchmark indices. The fund which outperforms the both can be selected for investment. Investors should review their portfolio of mutual funds from time
to time. Investors should try to keep their investment for a longer period of time so as to ensure that they can beat market volatility. Last but not the least; investor can withdraw funds according to his needs and purpose.
Bibliography
Barua, S. K., Raghunathan, V., Verma, J. R. (1991). Master Share: A Bonanza for large investors, Vikalpa, January –March.
Genesan, S. J. Raja. (2000). Mutual Funds, Indian Management, Vol. 39, No. 10, p. 42
Gupta, A. (2001). Mutual Funds in India, A study of Investment
Management, Finance India, Vol. 15, No. 2, p. 631.
Gupta, K. Shashi. (2006). Financial Institutions and markets, Kalyani Publishers, New Delhi, p. 18.1-18.33
Jensen, M.C. (1968). The Performance of Mutual Funds 1945-64.
Mc Donald, J. G. (1974). Objectives and Performance of Mutual Funds 1960-1967. Journal of Financial and Qualitative Analysis, p. 311-333.
Mehru, K. D. (2004). Problems of Mutual Funds in India, Finance
India, Vol. 18, No. 1, p. 220.
Mutual Fund 2005, the ICFAI University Press, Vol. XI, Issue 7, July 2, p. 10 - 12.
Panday, A. (2000). Assured Return Schemes by Mutual Funds: An Appraisal of regulatory Issues, Vision, Vol. 4, No. 1, p. 29. Romacho, J. C., Cortez, M. C. (2006). Timing and selectivity in
Portuguese mutual fund performance. Research in International
Business and Finance, p. 348–368.
Shah, S. M. A., Hijazi, S. T. (2005). Performance Evaluation of Mutual Funds in Pakistan. Pakistan Development Review 44(4): p.863. http://crisil.com/capital-markets/mutual-fund-rankings.html
http://crisil.com/ratings/crisil-pioneers.html