IC, 2016 – 12(5): 1401-1450 – Online ISSN: 1697-9818 – Print ISSN: 2014-3214 http://dx.doi.org/10.3926/ic.798
Massive open online courses in higher education:
A data analysis of the MOOC supply
Julieth E. Ospina-Delgado1 , Ana Zorio-Grima2 , María A. García-Benau2 1Pontificia Universidad Javeriana Cali (Colombia)
2Universidad de Valencia (Spain)
[email protected], [email protected], [email protected]
Received May, 2016 Accepted August, 2016
Versión en español
Abstract
Purpose: The aim of this study is to analyze the factors influencing the MOOC supply level. Specifically, this paper analyzes certain internal and strategic factors associated with universities, such as prestige, public or private status, age, size (measured by the number of faculty members or students) and region.
Design/methodology: We apply a descriptive methodology and then use multivariate analysis to test five hypotheses related to the institutional profile of 151 universities in 29 countries. Empirical evidence is provided from universities offering MOOCs through the four of the most commonly used private global platforms that emerged as part of the booming MOOC movement (Udacity, Coursera, edX and MiríadaX).
Research limitations/implications: MOOCs are a phenomenon with a growing trend, and for which the supply data change frequently. Therefore, the results of our empirical research are limited to a specific period.
Practical implications: This paper provides new empirical evidence for use in future studies to analyze and compare the behavior of the MOOC supply by different universities.
Social implications: This study contributes to the comprehension of the factors that influence the extent to which universities participate in the MOOC supply. It also suggests relevant aspects for innovation policies in university education, since universities must make strategic decisions in a competitive environment that affects their institutional philosophy.
Originality/value: This paper makes an empirical contribution to the existing international literature on MOOC supply. It analyzes the relevance of the factor of prestige, as measured by two university rankings, Webometrics, the emphasis of which is focused on visibility on the Internet, and Shanghai, in which emphasis is placed on the impact on scientific research.
Keywords: Massive Open Online Courses, Higher education, MOOC platforms, Universities, Prestige, MOOC supply
Jel Codes: A22, I23
1. Introduction
The University, as a social institution called upon to respond to the challenges of modernization and globalization, has incorporated many forms of information and communications technologies (ICT). As a result, new virtual educational settings have been generated, which have meant important transformations, ranging from the way knowledge is accessed to the very structure of the educational institutions (European Commission, 2013; UNESCO/COL, 2011).
(MOOC). In fact, it is believed that the technological advances in higher education were not overly visible until the emergence of these courses (EUA, 2015), the rise of which since 2012 has been the subject of great debate in today's educational and pedagogical field (Ng'ambi & Bozalek, 2015; Sangrà, González & Anderson, 2015). Their importance lies in the proposal of a barrier-free education for anyone who has an Internet connection, thanks to their free and open characteristics, which are aspects that promote another of their main features: their massive access.
While they are a phenomenon originating in North American universities (Rodriguez, 2012; Waldrop, 2013), MOOCs do not form part of the formal university course offering and are taught via virtual education platforms that have, for the most part, been created as consortia for this purpose (e.g., Coursera, Udacity, edX, MiríadaX), which are offered by different non- and for-profit entities (Ong & Grigoryan, 2015; Pang, Tong & Na, 2014; Yuan & Powell, 2013). Some studies (Daniel, Vásquez & Gisbert, 2015; Yuan & Powell, 2013) consider the participation of the universities in the MOOC phenomenon to be the result of the technology-media convergence process and the consequence of the massification of higher education in the context of the cultural homogenization that is associated with globalization. Others consider MOOCs to be an opportunity for public universities with smaller budgets, and not the threat that was originally imagined, pointing out their benefits in terms of reaching social groups such as retirees or employees who wish to improve their technical performance, for whom these courses would be an intellectual challenge (Ong & Grigoryan, 2015). They are also seen as an opportunity to advance in lifelong learning (De Freitas, Morgan & Gibson, 2015), a view that is shared by official European bodies, which consider them to be a change agent in higher education (European Parliament, 2015; European Commission, 2013).
Two characteristics have set the MOOCs apart from the already well-established e-learning industry: their massiveness and openness (Atenas, 2015), mostly in the sense of their free cost rather than in the original sense of “open educational resources” (OER). However, these basic principles of openness, reuse and recombination (OECD, 2015) have been obscured by the fact that MOOCs might be initially free-of-charge, but the suppliers could sometimes add charges for additional services, such as accreditation and certification (Daniel et al., 2015; Atenas, 2015). This has resulted in the criticism that associates the boom of the MOOCs with economic and commercial gain.
et al., 2015; Daniel et al., 2015). These reasons have been identified in North American studies, and works have also recently been published based on questionnaires in Europe, which have added to the references on the offering and the development perspectives of MOOCs. According to the data from the European University Association, MOOCs represent one of the activities with the greatest growth potential in European universities (EUA, 2015). The Conference of Presidents of Spanish Universities (CRUE, 2015), in turn, indicates that the reasons why universities offer these courses are, first of all, innovation in learning, and secondly, visibility and the presence of university teaching on the Internet.
The novelty and timeliness of our study is highlighted by the recent research presented above, as we aim to analyze the MOOC supply through the four most popular platforms. Our findings identify the characteristics of the universities that are actively taking part in this educational trend. To begin with, five hypotheses are tested that are associated with the prestige, type (public or private), age, size and region of the university, and then a multivariate analysis is carried out to identify whether any of these characteristics of the universities has an influence on the MOOC offering. This work thus contributes new evidence of the empirical relationships that exist among variables associated with the profile of the universities and their level of MOOC offering, and in particular, shows the relevance of prestige as a strategic factor.
Following this introduction, the next section presents a review of the international literature on MOOCs and the formulation of the study hypotheses. The third section describes the data obtained, as well as the variables and the methodology used. Next, in the fourth section, an analysis of the results is presented, followed by a final section with the main conclusions derived from the work.
2. Theoretical framework and hypotheses development
From the perspective of the theory of disruptive innovations by Bower and Christensen (1995), MOOCs are described as an innovative practice involving an educational disruption (Yuan & Powell, 2013; Anderson & McGreal, 2012), and more precisely, a disruptive innovation of the market, by becoming an interesting product that combines a technological development with a new business market that promotes a more flexible type of low-cost training (Vásquez, López & Sarasola, 2013).
In spite of the novelty of the topic, the body of literature is continuously expanding (Sangrà et al., 2015; Gašević et al., 2014; Liyanagunawardena, Adams & Williams, 2013a), especially in terms of research on the MOOC demand-side. Christensen, Steinmetz, Alcorn, Bennett, Woods and Emanuel (2013) report that most of the participants in these courses are young people with higher education and employees from developed countries, who are both looking to satisfy their curiosity and improve their career profile. Yousef, Chatti, Wosnitza and Schroeder (2015) have grouped the reasons why students participate in MOOCs into eight clusters: mixed learning, flexibility, high-quality content, instructional design and learning methodologies, life-long learning, on-line learning, openness and student-focused learning.
Taking the perspective of the supply side, Hollands and Tirthali (2014) look into why institutions offer MOOCs, with a qualitative study of 83 interviews with leaders of 29 US institutions. They identify six main objectives: expanding the institutional scope and attracting a larger number of students (size), building and maintaining their brand (prestige), improving their finances by reducing costs or increasing income, improving their educational results, innovating in teaching-learning and conducting research on teaching and learning processes. Meanwhile, the study by Jansen, Schuwer, Teixeira and Aydin (2015), based on online surveys of 67 institutions of higher education in 22 European countries that offer MOOCs or that plan to do so indicates that, unlike in the United States, the most important objective is to create new opportunities for flexible learning. It also finds that the number of European universities offering MOOCs or that plan to do so increased from 58% in 2013 to 71.7% in 2014, while in the USA, according to the data from Allen and Seaman (2015), it decreased from 14.3% to 13.6%. Thus, Jansen et al. (2015) have concluded that the European universities seem to be more committed to the MOOC phenomenon than their US counterparts, to the point of becoming a major trend in Europe.
In this framework, this paper focuses on studying whether certain characteristic factors of an institution (prestige, type of university [public or private], age, size and region of origin) explain the level of university offering of MOOCs.
2.1. Prestige
Within the current dynamics of the internationalization of higher education, one of the most important common objectives among universities is to increase their reputation and prestige; as part of this, their position in the rankings plays a key role (European Parliament, 2015). As a matter of fact, in a competitive environment, reputation and institutional prestige are one of the factors that determine, among other things, the selection of a university and degree program by students (Sierra, 2012; Aguillo, Bar-Ilan, Levene & Ortega, 2010; Docampo, 2008). It has even been confirmed that prestige does not necessarily derive exclusively from strictly research activities (Horstschräer, 2012; Maringe, 2006).
For this reason, prestige has been analyzed as a strategic factor of universities (Hollands & Tirthali, 2014; Jordan, 2014; Ospina & Zorio, 2016), and is a term frequently used by MOOC platforms, which declare that their offering comes from the world's most prestigious universities (Ong & Grigoryan, 2015; Schuwer et al., 2015; Pang et al., 2014; Yuan & Powell, 2013). Reinforcing their own prestige is also one of the objectives sought by MOOC participants, according to Yousef et al. (2015). Therefore, it could be considered that the universities with the greatest prestige lead the offering with a larger number of MOOCs, as a clear sign of their commitment to educational innovation. Therefore, the first hypothesis proposed is:
H1: There is a significant positive relationship between the prestige of a university and its MOOC offering.
2.2. Public or private status
and Guiney (2014) emphasize in their study a greater trend towards these courses in private universities. This is not the case in Spain, where there is a greater offering by public universities, which have benefited from the impulse of one of the most commonly used platforms, “MiríadaX”, which is the product of private alliances (Oliver et al., 2014). To validate this trend, the following hypothesis is proposed:
H2: Private universities have a greater offer of MOOCs than public universities.
2.3. Age
The age of the university has been analyzed in different studies on higher education strategies (Luque-Martínez, 2013; Guzmán, del Moral, González & Gil, 2013; Gallego-Álvarez, Rodríguez & García-Sánchez, 2011), which have found, for example, a significant negative relationship between the age of the university and the use of ICT (Iniesta, Sánchez & Schlesinger, 2013). The oldest universities, which have built their know-how over many years, tend to safeguard their corporate image more than younger institutions (Gallego-Álvarez et al., 2011) and as a result, they may be less enthusiastic about models whose effectiveness is still in the early stages, such as MOOCs. Based on this, the following hypothesis has been developed:
H3: There is a negative relationship between the age of a university and its MOOC offering.
2.4. Size
have a greater level of resources to deal with this type of innovation, and thus the following hypothesis is proposed:
H4: There is a positive relationship between the size of a university and its MOOC offering.
2.5. Region
A study by Aguillo, Ortega and Fernández (2008) has led us to consider the importance of this factor, by suggesting a trend on the part of US universities to make better, more in-depth use of the Internet. Furthermore, even though it has been acknowledged that the first MOOC was launched in Canada in 2008, and the literature indicates the preponderance of the phenomenon in the USA (Schuwer et al., 2015; Yousef et al., 2015; Shrivastava & Guiney, 2014; Liyanagunawardena et al., 2013a; SCOPEO, 2013), new participants in other regions are joining the offering, indicating even a greater, growing trend related to this phenomenon in Europe (Jansen et al., 2015). As a result, it would be interesting to validate this aspect through the following hypothesis:
H5: US universities have a greater offer of MOOCs than the universities from the rest of the world.
3. Study design: Methodology, sample and variable definitions
The methodology consists, firstly, of a descriptive statistical analysis for an initial approximation to the study variables, followed by a bivariate analysis that makes it possible to explore the importance of each of the variables available in relation to the MOOC offering. Secondly, a multiple regression analysis enables us to corroborate which of the variables included in the model have some degree of effect on the level of MOOC offering.
3.1. Sample
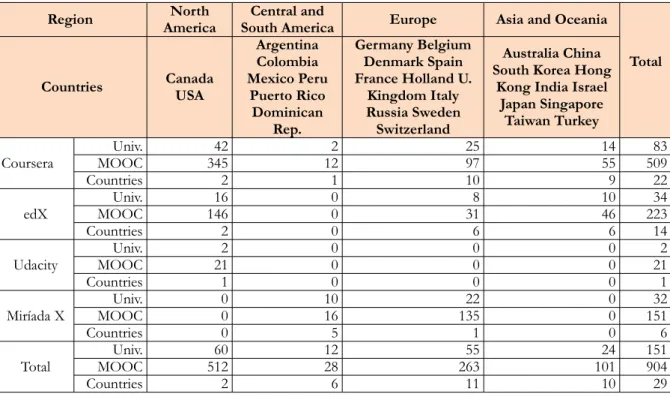
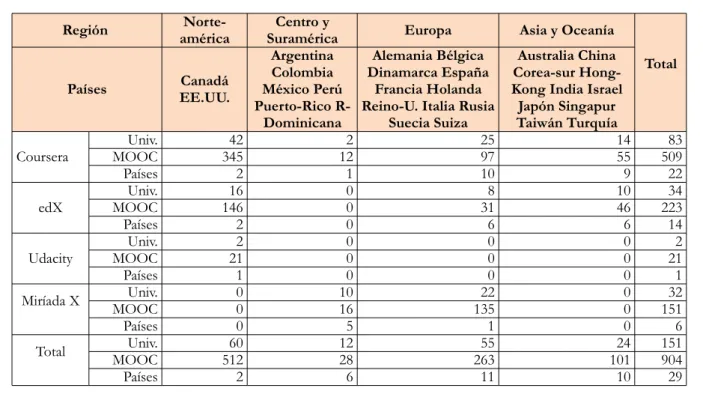
countries, organized into four large regions, and with a total offering of 904 courses (see Table 1). The universities correspond to those that on June 30, 2014 offered at least one MOOC on one of the first global platforms created by private initiative, and which have had the greatest visibility and distribution during the boom of the MOOC movement: Udacity, Coursera, edX and MiríadaX (Sangrà et al., 2015; Jordan, 2014; Clow, 2013; Anderson & McGreal, 2012; Daniel, 2012). MOOCs offered by providers other than universities were excluded (Raposo, Martínez & Sarmiento, 2015).
Region AmericaNorth South AmericaCentral and Europe Asia and Oceania
Total Countries CanadaUSA
Argentina Colombia Mexico Peru Puerto Rico Dominican Rep. Germany Belgium Denmark Spain France Holland U.
Kingdom Italy Russia Sweden Switzerland
Australia China South Korea Hong
Kong India Israel Japan Singapore
Taiwan Turkey
Coursera MOOCUniv. 34542 122 2597 1455 50983
Countries 2 1 10 9 22
edX MOOCUniv. 14616 00 318 1046 22334
Countries 2 0 6 6 14
Udacity MOOCUniv. 212 00 00 00 212
Countries 1 0 0 0 1
Miríada X MOOCUniv. 00 1016 13522 00 15132
Countries 0 5 1 0 6
Total MOOCUniv. 51260 1228 26355 10124 151904
Countries 2 6 11 10 29
Table 1. Description of the sample
3.2. Variables
non-intensive MOOC profile by universities. The Shanghai ranking is also included in the present study to check whether, like Webometrics, it is related to the MOOC offering.
The SHANGHAI variable has thus been assigned the value of 0 when the university is not present in the ranking, and the value of 1 if it is included. The WEBOMETRICS variable has been assigned its value according to four intervals, depending on each university's classification in the ranking, with 1 meaning that the university holds one of the last positions (above one thousand) and 4 when it holds one of the top positions (in the first one hundred positions). For H2, the variable TYPE has been given a value of 0 when the university is public and a value of 1 when it is private. The hypothesis concerning the age of the university (H3) is measured by the variable LNAGE, which constitutes the Napierian logarithm of the age of the institution in years since it was founded. To measure the size of the university (H4), in line with previous studies (Allen & Seaman, 2014; Guzmán et al., 2013; Gallego-Álvarez et al., 2011), two variables have been used, LNFACULTY and LNSTUD, which represent the natural logarithm of the number of faculty members associated with the institution and the number of students registered at the university, respectively; the bivariate analysis makes it possible to select the variable between the two that offers closest relationship and the highest level of significance with the dependent variable. The variable REGION (H5) groups the country of origin of each university (Guzmán et al., 2013) into four large regions: North America, Central and South America, Europe and Asia, and Oceania.
Furthermore, following existing literature (Ospina & Zorio, 2016; Daniel et al., 2015; Bartolomé & Steffens, 2015; Hollands & Tirthali, 2014; Liyanagunawardena, Adams & Williams, 2013b; SCOPEO, 2013) we use two control variables which are the Gross Domestic Product (GDP) per capita and the level of penetration of the Internet. Data for these variables was gathered from the World Bank (201 4). The GDP variable is assigned the value of 0 when the GDP per capita of the university's country is less than the mean of the 29 countries in the sample, which in this case is USD $50.000, and the value of 1 when if greater. The variable INTERNET takes the value of 0 when the Internet penetration (% of the population with access) in the country of the university is less than the mean of the countries in the sample, which in this case is 70%, and the value of 1 if larger.
To analyze the relationship of the MOOC offering according to the described variables, two models of multiple regression are proposed:
• incorporating the WEBOMETRICS variable, which is focused mainly on the overall impact of the university on the Web.
In both cases, only one of the variables associated with size is considered:
MOOCi = β0 + β1 (SHANGHAI) + β2 (TYPE) + β3 (LNAGE) + β4 (LNFACULTY) + β5
(REGION) + β6 (GDP) + β7 (INTERNET) + ε i (1)
MOOCi = β0 + β1 (WEBOMETRICS) + β2 (TYPE) + β3 (LNAGE) + β4 (LNFACULTY) +
β5 (REGION) + β6 (GDP) + β7 (INTERNET) + ε i (2)
where MOOC is the dependent variable that represents the number of MOOCs offered by the University; “i” represents each university included in the sample; β0 is the constant term parameter; and each of the coefficients of the variables is represented by β1,… β7. The error term, ε, accounts for the factors not observed in the model. The program Stata v.12 was used for the statistical processing of the data.
4. Analysis of the results
Below is an analysis of the descriptive statistics, followed by the bivariate analysis, and finally the multiple regression analysis.
4.1. Descriptive analysis
50th percentile, with 4, are 90 universities (58%), which demonstrates an important distance between the universities with the least and greatest offering.
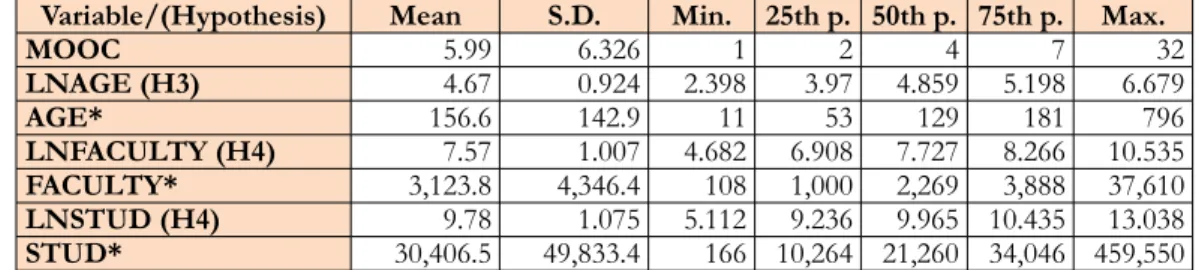
Variable/(Hypothesis) Mean S.D. Min. 25th p. 50th p. 75th p. Max.
MOOC 5.99 6.326 1 2 4 7 32
LNAGE (H3) 4.67 0.924 2.398 3.97 4.859 5.198 6.679
AGE* 156.6 142.9 11 53 129 181 796
LNFACULTY (H4) 7.57 1.007 4.682 6.908 7.727 8.266 10.535
FACULTY* 3,123.8 4,346.4 108 1,000 2,269 3,888 37,610
LNSTUD (H4) 9.78 1.075 5.112 9.236 9.965 10.435 13.038
STUD* 30,406.5 49,833.4 166 10,264 21,260 34,046 459,550
* Original values of the variable before logarithmic transformation
Table 2. Descriptive statistics of continuous variables
The mean age of the universities is 156 years; 81% of the total are less than 200 years old and only 10% have an age of between 300 and 600 years, with two European (specifically, Spanish) universities having the minimum and maximum values. Of the North American institutions (60), 57% are below the mean, with the youngest being 49 and the oldest 378 years old.
Variable/(Hypothesis) Values Frequency - Universities % Frequency - MOOC %
SHANGHAI (H1)
0: Not in ranking 51 33.8 204 22.6
1: In ranking 100 66.2 700 77.4
Total 151 100.0 904 100.0
WEBOMETRICS (H1)
1 (>1001) 28 18.6 76 8.4
2 (501-1000) 15 9.9 78 8.6
3 (101-500) 45 29.8 203 22.5
4 (1-100) 63 41.7 547 60.5
Total 151 100.0 904 100.0
TYPE (H2)
0: Public 105 69.5 566 62.6
1: Private 46 30.5 338 37.4
Total 151 100.0 904 100.0
REGION (H5)
1 North America 60 39.8 512 56.6
2 Central & South Am. 12 7.9 28 3.1
3 Europe 55 36.4 263 29.1
4 Asia & Oceania 24 15.9 101 11.2
Total 151 100.0 904 100.0
Control variables
GDP 0: <USD $50,0001: >USD $50,000 6487 42.457.6 291613 32.267.8
Total 151 100.0 904 100.0
INTERNET 0: <70%1: >70% 12724 15.984.1 81391 10.189.9
Total 151 100.0 904 100.0
Table 3. Frequencies of the categorical variables
In terms of prestige, 66.2% of the universities in our sample are in the Shanghai ranking, and they provide most of the MOOC offering (77.4%); likewise, 71.5% of the universities fall within the first 500 positions on the Webometrics ranking (categories 3 and 4 of the variable), accounting for 83% of the courses.
Most of the universities (69.5%) are public and provide 62.6% of the offering, however, of them, 71% have an offering that is below the mean, i.e., they offer fewer than six courses.
With regard to geographic region, 39.8% of the universities are in North America and account for 56.6% of the offering; 36.4% are located in Europe and offer 29% of the courses; 15.9% belong to the regions of Asia and Oceania, with 11% of the MOOCs; and the Central and South American region provides 7.9% of the universities and 3% of the offer.
4.2. Bivariate analysis
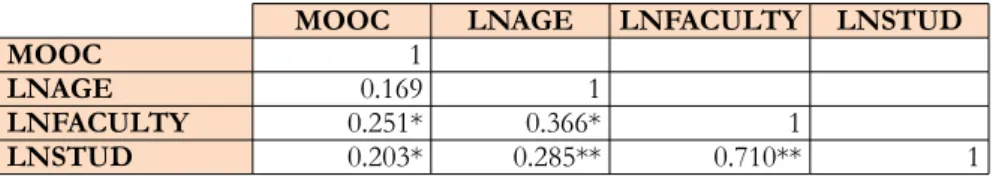
Table 4 shows the correlations between the continuous independent variables and the MOOC offering variable. Even though the correlation coefficients of the two size variables (LNFACULTY and LNSTUD) with the dependent variable are not high, they show a 5% level of significance. This first analysis suggests that the age of the university is not related to its MOOC offering, however, considering the approach of our hypothesis, H3, it must not be ruled out for the following analysis.
MOOC LNAGE LNFACULTY LNSTUD
MOOC 1
LNAGE 0.169 1
LNFACULTY 0.251* 0.366* 1
LNSTUD 0.203* 0.285** 0.710** 1
(**) p<0.01 (*) p<0.05 (Spearman's correlation coefficient)
Table 4. Correlations between continuous variables
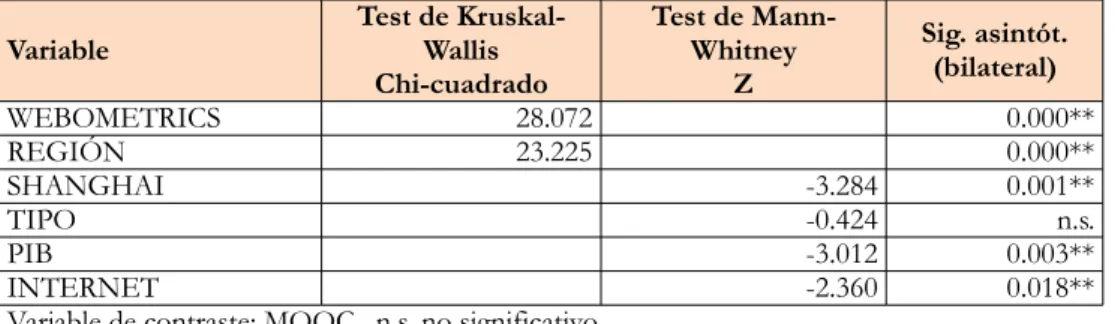
The contrast tests for the categorical variables, shown in Table 5, reveal a high level of statistical significance (1% and 5%) for all variables, except TYPE. This includes the control variables, which suggests the importance of these variables in the analysis of the level of university MOOC offering.
Variable Kruskal-Wallis testChi-square Mann-Whitney testZ Asympt. sign.(bilateral)
WEBOMETRICS 28.072 0.000**
REGION 23.225 0.000**
SHANGHAI -3.284 0.001**
TYPE -0.424 n.s.
GDP -3.012 0.003**
INTERNET -2.360 0.018**
Contrast variable: MOOC. n.s. = not significant (**) p<0.01 (*) p<0.05
4.3. Multivariate analysis
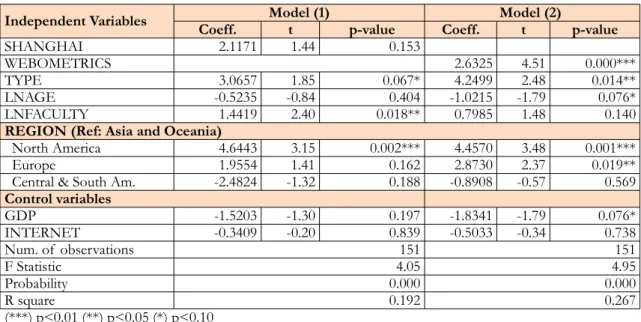
In order to avoid autocorrelation among the variables referring to size, the variable LNSTUD, which presented the lowest correlation with the dependent variable, was excluded from the regression analysis. The absence of multicolinearity problems is confirmed by the variance inflation factor, which was lower than 10 (VIF=2.44 and 2.41) in the two models. For the variable REGION, the results are shown according to the top level in the category, i.e., Asia and Oceania. Both models (Table 6) reached overall significance (heteroscedasticity-robust F statistic=0.000) and a moderate level of predictive power, which was lower in the model (1) estimated with the SHANGHAI variable (R2=0.192) than in that estimated with WEBOMETRICS (R2=0.267). Although it is not evident in the table, the inclusion of the control variables resulted in better results in terms of significance in both models.
Independent Variables Coeff. Model (1)t p-value Coeff. Model (2) t p-value
SHANGHAI 2.1171 1.44 0.153
WEBOMETRICS 2.6325 4.51 0.000***
TYPE 3.0657 1.85 0.067* 4.2499 2.48 0.014**
LNAGE -0.5235 -0.84 0.404 -1.0215 -1.79 0.076*
LNFACULTY 1.4419 2.40 0.018** 0.7985 1.48 0.140
REGION (Ref: Asia and Oceania)
North America 4.6443 3.15 0.002*** 4.4570 3.48 0.001***
Europe 1.9554 1.41 0.162 2.8730 2.37 0.019**
Central & South Am. -2.4824 -1.32 0.188 -0.8908 -0.57 0.569
Control variables
GDP -1.5203 -1.30 0.197 -1.8341 -1.79 0.076*
INTERNET -0.3409 -0.20 0.839 -0.5033 -0.34 0.738
Num. of observations 151 151
F Statistic 4.05 4.95
Probability 0.000 0.000
R square 0.192 0.267
(***) p<0.01 (**) p<0.05 (*) p<0.10
Table 6. Multiple regression for factors that influence the MOOC offering
The results of the regression for the model (1), with the SHANGHAI variable, indicate that the variables which influence the MOOC offering are TYPE (p<0.10), for which the coefficient indicates a three course advantage for private universities over public universities; LNFACULTY (p<0.05), which indicates that as this variable increases, so does the unit representing the level of offering; and REGION, specifically, North American with a p-value<0.01.
ranking moves up one level according to our categories, its offering increases by 2 courses; the variable TYPE (p<0.05), which reflects a higher level of significance and a larger coefficient than in model (1), but also indicates the influence of private university status as compared to public status in terms of MOOC offering; LNAGE, which shows a significant negative relationship (p<0.10) between the age of the universities and their MOOC offering; and the variable REGION, in which, in addition to North America (p<0.01) as in model (1), Europe also presents a significant p-value<0.05, which demonstrates that North American universities have a 4 course advantage over the Asia and Oceania region, while in the case of European universities, the positive difference is 2 courses as compared to the reference region.
In both models, the common variables that reveal a significant positive influence on MOOC offering are TYPE and REGION (North America), which would suggest that H2 and H5 should be accepted. The variable LNFACULTY reveals an influence only in model (1), and thus H4 could be partially accepted. Likewise, judging from the results of model (2), the hypotheses related to prestige (H1) and age (H3) could also be partially accepted. In general terms, model (2) produces better results to explain the MOOC offering by universities.
5. Conclusions
The literature analyzed provides a broad perspective that reflects, among the most important aspects, the concern by researchers for the way in which universities must face the challenges posed by the new educational models. MOOCs constitute a new scenario in virtual education that has a key place in the academic debate on the present and future of universities. While far from being a solution to the weaknesses and barriers of the educational system, they present important challenges for educational communities in terms of rethinking, in all disciplines of knowledge, the teaching-learning processes within a context of a society that is undergoing permanent change and is shaped by the tension of the dynamics of globalization and the mass media.
capita and the Internet penetration in the university's country of origin. Given the importance the strategic factor "prestige" had in this study, it was estimated by two models, one using presence in the SHANGHAI ranking and the other using 4 categories according to the WEBOMETRICS ranking.
The results obtained in the regression analysis for both models suggest interesting data for the interpretation of the level of MOOC offer in relation to the ranking variables that measure the prestige of a university. When prestige is measured by the Shanghai ranking, this variable does not prove significant in order to explain the level of MOOC offering. However, prestige is a significantly influential variable when measured by the Webometrics ranking, in line with Ospina and Zorio (2016). In the light of the results obtained, it must be kept in mind that the Webometrics ranking is based mainly on the web impact of the universities, in other words, their visibility, and not as much on the impact of their scientific activity, as in the Shanghai ranking (Aguillo et al., 2010; Aguillo et al., 2008; Docampo, 2008). It is therefore interesting to consider that those universities which have not necessarily earned their prestige only through mostly research work, but rather by building their visibility on the Web, are those that lead the MOOC offering, even though, as Daniel (2012) claims, they are not necessarily leaders in online instruction. This could be indicative of a trend in universities that are not precisely engaged intensively in research to excel by means of their MOOC offering, presenting themselves as the most innovative, an aspect also highlighted by the approach of prior research (see for instance Ospina & Zorio, 2016; Hollands & Tirthali, 2014).
Our study also reveals that private universities are the ones that have the most significant weight in the MOOC offering, in line with the studies by Hollands and Tirthali (2014) and Allen and Seaman (2014) based on North America. Our sample consists mainly of public universities (70%). However, it is the private universities that participate the most in the MOOC offer, as described by Shrivastava and Guiney (2014), who see greater resistance to this learning phenomenon in public institutions, not only due to the financial costs, but also the political costs that tend to be greater in public as opposed to private institutions (Gallego-Álvarez et al., 2011) and that arise particularly in relation to the teaching staff when the institution decides upon the financial model to support this type of innovation (Hollands & Tirthali, 2014).
in the USA, in relation to both universities and other suppliers (Belleflamme & Jacqmin, 2014; Hollands & Tirthali, 2014), can explain this result, as could the results of Aguillo et al. (2008), whose analysis of the Web ranking revealed a digital academic gap between North American universities and their European counterparts. However, the results obtained when measuring prestige with the WEBOMETRICS variable also reflect the importance of Europe in this trend, which leads to the speculation that this region is increasingly accessing mechanisms available on the Web to improve their indicators of international visibility.
Moreover, the result from model (2), which measures prestige with the WEBOMETRICS variable, support the hypothesis that the newest universities participate more intensively in the MOOC offering, which suggests that there is a more cautious attitude on the part of the oldest universities towards this type of innovation, participating with one or only a few courses, which is more in line with the "wait and see" approach described by Hollands and Tirthali (2014).
Likewise, the results of measuring prestige with the SHANGHAI variable support the hypothesis related to size, as measured by the number of faculty members at the university. However, in the presence of the WEBOMETRICS variable, the number of faculty members cannot be identified as a significant factor of the number of MOOC offered. The explanation for this could lie in the fact that both in North America (e.g., University of Maryland, 2013; University of Illinois, 2014; West Virginia University, 2015) and in Europe (Jansen et al., 2015; EUA, 2015), many of the efforts related to this phenomenon are promoted by one-off institutional projects and not as an activity forming part of the teaching mission, which implies an increase in staff.
2015). This possibility aside, it would be interesting to know whether the assessment of these courses by MOOC students’ prospective employers depends on the prestige of the platform or of the university offering them (Rodriguez, 2012). In any case, the opportunity should be taken to develop a distinctive MOOC mission for the university or use it to improve its different missions, which as Daniel (2012) states, "would mean a true revolution in MOOCs" (pp. 14).
Finally, one limitation of our study should be acknowledged. As MOOC offering is a growing trend that receives increasingly more financial backing from different organizations and agents, such as in the recent case of Europe (Jansen et al., 2015), the data are constantly changing. Nonetheless, future research may incorporate new variables , analyzing maybe the changes in the MOOC offering over time and understanding how universities around the world become involved in this global trend. It will be very interesting to find out how universities respond to the innovation needs of online instruction and whether they adopt different specialization strategies.
Acknowledgments
The authors would like to thank the University of Valencia for its financial support (UV-SFPIE_GER16-415408). They would also like to express their appreciation for the comments and contributions received at the II Workshop on Business, Economics and e-Learning (BEeL 2014) in Barcelona, where a preliminary version of this work was presented.
References
Academic Ranking of World Universities – ARWU (2014). Available online in:
http://www.shanghairanking.com/es/ARWU2014.html
Aguillo, I., Bar-Ilan, J., Levene, M., & Ortega, J. (2010). Comparing university rankings. Scientometrics, 85, 243-256. http://dx.doi.org/10.1007/s11192-010-0190-z
Aguillo, I., Ortega, J., & Fernández, M. (2008). Webometric Ranking of World Universities: Introduction, Methodology, and Future Developments. Higher Education in Europe, 33, 233-244.
http://dx.doi.org/10.1080/03797720802254031
Allen, E., & Seaman, J. (2014). Grade Change-Tracking Online Education in the United States. Babson Survey Research Group; Pearson; Sloan-C. Available online in:
http://onlinelearningconsortium.org/publications/survey/grade-change-2013
Allen, E., & Seaman, J. (2015). Grade Level: Tracking Online Education in the United States. Babson Survey Research Group; Pearson; Sloan-C. Available online in:
http://www.onlinelearningsurvey.com/reports/gradelevel.pdf
Anderson, T., & McGreal, R. (2012). Disruptive Pedagogies and Technologies in Universities. Educational Technology & Society, 15(4), 380-389.
Atenas, J. (2015). Modelo de democratización de los contenidos albergados en los MOOC. Universities and Knowledge Society Journal, 12(1), 3-14. http://dx.doi.org/10.7238/rusc.v12i1.2031
Bartolomé, A., & Steffens, K. (2015). ¿Son los MOOC una alternativa de aprendizaje?. Comunicar, 44, 91-99. http://dx.doi.org/10.3916/C44-2015-10
Belleflamme, P., & Jacqmin, J. (2014). An Economic Appraisal of MOOC Platforms: Business Models and Impacts on Higher Education. SSRN-id2537270. http://dx.doi.org/10.2139/ssrn.2537270
Bower, J.L., & Christensen, C.M. (1995). Disruptive technologies: Catching the wave. Harvard Business Review, January-February, 43-53. Available online in:
http://www.immagic.com/eLibrary/ARCHIVES/GENERAL/JOURNALS/H950130C.pdf
Chen, K.H., Tang, M.C., Wang, C.M., & Hsiang, J. (2015). Exploring alternative metrics of scholarly performance in the social sciences and humanities in Taiwan. Scientometrics, 102(1), 97-112.
http://dx.doi.org/10.1007/s11192-014-1420-6
Christensen, G., Steinmetz, A., Alcorn, B., Bennett, A., Woods, D., & Emanuel, E.J. (2013). The MOOC phenomenon: Who takes massive open online courses and why? (University of Pennsylvania, November 6). SSRN-id2350964. http://dx.doi.org/10.2139/ssrn.2350964
Clow, D. (2013). MOOC and the funnel of participation. In: Third Conference on Learning Analytics and Knowledge (LAK 2013), Leuven, Belgium, April 8-12. Disponible online en:
http://oro.open.ac.uk/36657/1/DougClow-LAK13-revised-submitted.pdf
http://dx.doi.org/10.1145/2460296.2460332
Conferencia de Rectores de las Universidades Españolas (CRUE). (2015). Informe MOOC y Criterios de Calidad. Versión 1.0. Toledo: Jornadas CRUE-TIC. Disponible online en:
Cybermetrics Lab (2014). Webometrics ranking of world universities. Available online in:
http://www.webometrics.info
Daniel, J. (2012). Making sense of MOOCs: Musings in a maze of myth, paradox and possibility. Journal of Interactive Media in Education, 3. Available online in: http://jime.open.ac.uk/article/view/259
http://dx.doi.org/10.5334/2012-18
Daniel, J., Vázquez, E., & Gisbert, M. (2015). El futuro de los MOOC: ¿Aprendizaje adaptativo o modelo de negocio?. Revista de Universidad y Sociedad del Conocimiento, 12, 64-74.
http://dx.doi.org/10.7238/rusc.v12i1.2475
De Freitas, S.I., Morgan, J., & Gibson, D. (2015). Will MOOCs transform learning and teaching in higher education? Engagement and course retention in online learning provision. British Journal of Educational Technology, 46(3), 455-471. http://dx.doi.org/10.1111/bjet.12268
Docampo, D. (2008). Rankings internacionales y calidad de los sistemas universitarios. Revista de Educación, número extraordinario, 149-176.
European Commission (2013). Opening up Education: Innovative teaching and learning for all through new Technologies and Open Educational Resources. Available online in: http://eur-lex.europa.eu/legal-content/EN/TXT/PDF/?uri=CELEX:52013DC0654&from=EN
European University Association (EUA). (2015). Trends 2015: Learning and Teaching in European Universities, by Sursock, A. (Brussels, EUA). Available online in: http://www.eua.be/Libraries/publications-homepage-list/EUA_Trends_2015_web
European Parliament (2015). Internationalisation of Higher Education. Available online in:
http://www.europarl.europa.eu/RegData/etudes/STUD/2015/540370/IPOL_STU(2015)540370_EN.pdf
Gallego-Álvarez, I., Rodríguez, L., & García-Sánchez, I. (2011). Information disclosed online by Spanish universities: Content and explanatory factors. Online Information Review, 35(3), 360-385.
http://dx.doi.org/10.1108/14684521111151423
Garde-Sánchez, R., Rodríguez, M., & López, A. (2013). Divulgación online de información de responsabilidad social en las universidades españolas. Revista de Educación, número extraordinario, 177-209.
Guzmán, A., del Moral, M., González, F., & Gil, H. (2013). Impacto de Twitter en la comunicación y promoción institucional de las universidades. Píxel-Bit. Revista de Medios y Educación, 43, 139-153.
http://dx.doi.org/10.12795/pixelbit.2013.i43.10
Hollands, F.M., & Tirthali, D. (2014). Why Do Institutions Offer MOOCs?. Online Learning: Official Journal of the Online Learning Consortium, 18(3), 1-20.
Horstschräer, J. (2012). University rankings in action? The importance of rankings and an excellence competition for university choice of high-ability students. Economics of Education Review, 31, 1162-1176. http://dx.doi.org/10.1016/j.econedurev.2012.07.018
Iniesta, M.A., Sánchez, R., & Schlesinger, W. (2013). Investigating factors that influence on ICT usage in higher education: A descriptive analysis. International Review Public Nonprofit Marketing, 10, 163-174.
http://dx.doi.org/10.1007/s12208-013-0095-7
Jansen, D., Schuwer, R., Teixeira, A., & Aydin, H. (2015). Comparing MOOC adoption strategies in Europe: Results from the HOME project survey. International Review of Research in Open and Distributed Learning, 16(6), 116-136. http://dx.doi.org/10.19173/irrodl.v16i6.2154
Jordan, K. (2014). Initial Trends in Enrolment and Completion of Massive Open Online Courses. The International Review of Research in Open and Distance Learning, 15(1), 133-160.
http://dx.doi.org/10.19173/irrodl.v15i1.1651
Kirkup, G., & Kirkwood, A. (2005). Information and communications technologies (ICT) in higher education teaching—a tale of gradualism rather than revolution. Learning, Media and Technology, 30(2), 185-199. http://dx.doi.org/10.1080/17439880500093810
Liyanagunawardena, T.R., Adams, A. & Williams, S. (2013a). MOOC: A Systematic Study of the Published Literature 2008-2012. International review of Research in Open and Distance Learning, 14(3), 202-227.
Liyanagunawardena, T.R., Adams, A., & Williams, S. (2013b). The Impact and Reach of MOOC: A Developing Countries’ Perspective. eLearning Papers No. 33. Available online in: www.elearningpapers.eu
Luque-Martínez, T. (2013). La actividad investigadora de la universidad española en la primera década del siglo XXI: La importancia del tamaño de la universidad. Revista Española de Documentación Científica, 36(4): e026. http://dx.doi.org/10.3989/redc.2013.4.1046
Ng'ambi, D., & Bozalek, V. (2015). Editorial: Massive open online courses (MOOCs): Disrupting teaching and learning practices in higher education. British Journal of Educational Technology, 46(3), 451-454. http://dx.doi.org/10.1111/bjet.12281
OECD (2015). Fostering new forms of learning for the 21st century. En D. Orr, M. Rimini & D. van Damme (Eds.). Open Educational Resources: A Catalyst for Innovation. Paris: OECD Publishing.
http://dx.doi.org/10.1787/9789264247543-en
Oliver, M., Hernández-Leo, D., Daza, V., Martin, C., & Albó, L. (2014). MOOC en España: Panorama de los Cursos Masivos Abiertos en Línea en las universidades españolas. Cátedra Telefónica – UPF Social Innovation in Education. Barcelona: Universitat Pompeu Fabra.
Ong, B.S., & Grigoryan, A. (2015). MOOCs and Universities: Competitors or Partners? International Journal of Information and Education Technology, 5(5), 373-376. http://dx.doi.org/10.7763/IJIET.2015.V5.533
Ospina-Delgado, J., & Zorio-Grima, A. (2016). Innovation at universities: A fuzzy-set approach for MOOC-intensiveness. Journal of Business Research, 69(4), 1325-1328.
http://dx.doi.org/10.1016/j.jbusres.2015.10.100
Pang, Y., Tong, W., & Na, W. (2014). MOOC Data from Providers. En Enterprise Systems Conference (ES), 2014 (2-3 Aug). IEEE Computer Society, 87-90. http://dx.doi.org/10.1109/ES.2014.45
Raposo, M., Martínez, E., & Sarmiento, J. (2015). Un estudio sobre los componentes pedagógicos de los cursos online masivos. Comunicar, 44(22), 27-35. http://dx.doi.org/10.3916/C44-2015-03
Rodriguez, O. (2012). MOOCs and the AI-Stanford like Courses: two successful and distinct course formats for massive open online courses. European Journal of Open, Distance, and E-Learning, 2012(II). Available online in: http://www.eurodl.org/?p=archives&year=2012&halfyear=2&abstract=516
Rodriguez, O. (2013). The Concept of Openness behind c and x-MOOC (Massive Open Online Courses). Open Praxis, 5(1), 67-73. http://dx.doi.org/10.5944/openpraxis.5.1.42
Sangrà, A., González Sanmamed, M., & Anderson, T. (2015). Metaanálisis de la investigación sobre MOOC en el período 2013-2014. Educación XXI, 18(2), 21-49. http://dx.doi.org/10.5944/educxx1.13463
SCOPEO (2013). Informe Nº2. MOOCs: Estado de la situación actual, posibilidades, retos y futuro. Salamanca: Universidad de Salamanca. Available online in:
http://scopeo.usal.es/wp-content/uploads/2013/06/scopeoi002.pdf
Schuwer, R., Gil-Jaurena, I., Aydin, C.H., Costello, E., Dalsgaard, C., Brown, M. et al. (2015). Opportunities and Threats of the MOOC Movement for Higher Education: The European Perspective. International Review of Research in Open and Distributed Learning, 16(6), 20-38.
http://dx.doi.org/10.19173/irrodl.v16i6.2153
Siemens, G. (2004). Connectivism. A Learning Theory for the Digital Age. Elearnspace, December, 12. Available online in: http://www.elearnspace.org/Articles/connectivism.htm
Sierra, J. (2012). Factors influencing a student’s decision to pursue a communications degree in Spain. Intangible Capital, 8(1), 43-60. http://dx.doi.org/10.3926/ic.277
Taylor, R., & Osorio, J. (2005). Economías de e-learning en la enseñanza superior: Estrategias de implantación. Revista de Universidad y Sociedad del Conocimiento, 2(1), 87-100.
UNESCO. (2009). A New Dynamic: Private Higher Education. World Conference on Higher Education. By Bjarnason, S., Cheng, K-M., Fielden, J., Lemaitre, M-J., Levy, D. y Varghese, N.V. Available online in:
http://unesdoc.unesco.org/images/0018/001831/183174e.pdf
UNESCO/COL. (2011). Guidelines for Open Educational Resources (OER) in Higher Education. Unesco and Commonwealth of Learning. Available online in:
http://unesdoc.unesco.org/images/0021/002136/213605e.pdf
University of Maryland (2013). Call for proposals for MOOCs. Available online in:
http://www.provost.umd.edu/announcements/Coursera_call_for_proposals.cfm
University of Illinois (2014). Call for proposals for MOOCs. Available online in:
http://mooc.illinois.edu/faculty/
Vásquez, E., López, E., & Sarasola, J.L. (2013). La expansión del conocimiento en abierto: Los MOOC. Barcelona: Octaedro-ICE.
Waldrop, M. (2013). Campus 2.0 Massive open online courses are transforming higher education and providing fodder for scientific research. Nature, 495, 160-163. http://dx.doi.org/10.1038/495160a
West Virginia University (2015). Call for proposals for MOOCs Round 2. Available online in:
http://academicinnovation.wvu.edu/MOOC/CallForProposals.php
World Bank (2014). Available online in: http://datos.bancomundial.org/indicador/NY.GDP.PCAP.CD/countries
Yousef, A.M.F., Chatti, M.A., Wosnitza, M., & Schroeder, U. (2015). Análisis de clúster de perspectivas de participantes en MOOC. Universities and Knowledge Society Journal, 12(1), 74-91.
Yuan, L., & Powell, S. (2013). MOOCs and Open Education: Implications for Higher Education. eLearning Papers, In-depth, 33(2), 1-7. Available online in:
http://www.openeducationeuropa.eu/sites/default/files/asset/In-depth_33_2_0.pdf
Versión en español
Título: Cursos en línea masivos y abiertos en educación superior. Un análisis desde su oferta
Resumen
Objeto: Los MOOCs se han difundido como una práctica innovadora en cuya oferta participan diversos proveedores entre ellos las universidades. El propósito del estudio es analizar si algunos factores internos y estratégicos de las universidades como el prestigio, su carácter público o privado, la antigüedad, el tamaño (medido en número de profesores o número de estudiantes) y la región de origen, influyen en la oferta universitaria MOOC.
Diseño/metodología/enfoque: Con un enfoque cuantitativo y usando técnicas de análisis multivariante, se contrastan cinco hipótesis asociadas al perfil institucional de 151 universidades originarias de 29 países, con oferta de MOOCs a través de cuatro de las plataformas globales privadas más difundidas en la etapa de auge de los MOOCs (Udacity, Coursera, edX y MiríadaX).
Aportaciones y resultados: El trabajo pone de manifiesto, a través de dos modelos, algunas diferencias cuando el prestigio de la universidad es medido con el ranking de Shanghai (modelo 1) y cuando lo es con el ranking de Webometrics (modelo 2). En ambos modelos, el tipo de universidad (privada) y la región (Norteamérica) son factores que influyen de manera significativa en la oferta MOOC. También resultan ser factores significativos el tamaño y la edad, dependiendo del ranking. El prestigio es un factor significativo en la oferta sólo en el modelo 2.
Implicaciones prácticas: El estudio aporta nuevos elementos empíricos para desarrollar estudios a futuro que permitan analizar y comparar los cambios en la oferta universitaria de MOOCs.
Implicaciones sociales: El estudio aporta a la comprensión de factores que influyen en que las universidades participen de manera más o menos intensiva en una iniciativa que señala nuevas tendencias en la educación. Asimismo, sugiere aspectos relevantes para la política universitaria de innovación educativa ya que las universidades deben afrontar decisiones estratégicas en un entorno competitivo que afecta su filosofía institucional.
Originalidad / Valor añadido: Este trabajo constituye un aporte empírico a la literatura existente sobre la oferta MOOC, al analizar la relevancia del factor prestigio medido a través de dos rankings universitarios, el de Webometrics, cuyo énfasis es hacia la visibilidad en Internet y el de Shanghai, cuyo énfasis está en el impacto de la investigación científica.
Palabras clave: Cursos en línea masivos y abiertos, Educación superior, Plataformas MOOC, Universidades, Prestigio, Oferta MOOC
Códigos JEL: A22, I23
1. Introducción
La Universidad, como institución social llamada a responder a los desafíos de la modernización y la globalización, ha incorporado de múltiples formas las tecnologías de la información y la comunicación (TIC). Como consecuencia, se han generado nuevos escenarios educativos virtuales con importantes transformaciones que van desde la forma de acceder al conocimiento, hasta las estructuras mismas de las instituciones educativas (European Commission, 2013; UNESCO/COL, 2011).
desde el 2012, ocupa gran parte del debate actual en el ámbito educativo y pedagóg ico (Ng'ambi & Bozalek, 2015; Sangrà, González & Anderson, 2015). Su importancia radica en la propuesta de una educación sin barreras para cualquier persona que disponga de conexión a Internet, gracias a su condición de apertura y gratuidad, aspectos que promueven otra de sus características principales, su acceso masivo.
Si bien se trata de un fenómeno nacido en la universidad norteamericana (Rodriguez, 2012; Waldrop, 2013), los MOOCs no forman parte de la oferta reglada de las universidades y son impartidos a través de plataformas proveedoras de educación virtual creadas, en su mayoría, como consorcios para tal fin (p.ej. Coursera, Udacity, edX, MiríadaX), en cuya oferta participan diversos tipos de entidades con y sin ánimo de lucro (Ong & Grigoryan, 2015; Pang, Tong & Na, 2014; Yuan & Powell, 2013). Algunos estudios (Daniel, Vásquez & Gisbert, 2015; Yuan & Powell, 2013) consideran la participación de las universidades en el fenómeno MOOC como resultado del proceso de convergencia tecno-mediática y como consecuencia de la masificación de la educación superior en el contexto de la homogenización cultural que conlleva la globalización. Otros consideran los MOOCs como una oportunidad para las universidades públicas, con menor presupuesto, y no como una amenaza como se creía inicialmente, señalando sus beneficios para llegar a grupos sociales como los retirados o empleados que desean mejorar su desempeño técnico, para quienes estos cursos serían un desafío intelectual (Ong & Grigoryan, 2015). También son vistos como una oportunidad para avanzar en el aprendizaje permanente (lifelong learning) (De Freitas, Morgan & Gibson, 2015), aspectos compartidos por organismos oficiales europeos, que los consideran como un agente de cambio en la educación superior (European Parliament, 2015; European Commission, 2013).
Dos características diferencian los MOOCs del ya reconocido e-Learning, su masividad y apertura (Atenas, 2015); este último más en el sentido de la gratuidad que en el sentido original de los recursos educativos abiertos (REA) cuyos principios básicos de apertura, reutilización y remezcla (OECD, 2015) han sido velado por el mensaje de gratuidad inicial al que luego los proveedores añaden cobros por servicios adicionales, tales como la acreditación y la certificación (Daniel et al., 2015; Atenas, 2015), aspecto que ha dado lugar a la crítica a asociar el auge de los MOOCs con razones de tipo económico y comercial.
como para construir y mantener su marca (Sangrà et al., 2015; Daniel et al., 2015). Estas razones han sido identificadas en estudios norteamericanos y recientemente se han publicado estudios basados en cuestionarios en Europa que permiten ampliar los referentes sobre la oferta y las perspectivas de desarrollo de los MOOCs. Según datos de la Asociación Europea de Universidades, los MOOCs representan una de las actividades con mayor potencial de crecimiento en las universidades europeas (EUA, 2015). Por su parte, la Conferencia de Rectores de las Universidades Españolas (CRUE, 2015) señala como razones de las universidades para ofrecer estos cursos, en primer lugar, la innovación en el aprendizaje y en segundo lugar, la visibilidad y la presencia de la docencia universitaria en la red.
Este panorama permite resaltar la oportunidad de esta investigación cuyo objetivo es analizar la oferta universitaria de MOOCs, a través de las cuatro primeras plataformas más reconocidas en su ámbito, para conocer las características de las universidades que están respondiendo a esta tendencia educativa. Se contrastan, en primer lugar, cinco hipótesis asociadas al prestigio, el tipo de universidad -pública o privada-, la antigüedad, el tamaño y la región de la universidad, y en segundo lugar, se realiza un análisis multivariante para identificar si algunos de estos factores característicos de las universidades influyen en la oferta de MOOCs. Así, este trabajo aporta nuevas evidencias de las relaciones empíricas entre variables asociadas al perfil de las universidades y su nivel de oferta MOOC, mostrando sobre todo, la relevancia del prestigio como factor estratégico.
Tras esta introducción, el siguiente apartado presenta una revisión de la literatura internacional sobre los MOOCs y se formulan las hipótesis del estudio. La tercera sección describe los datos obtenidos, las variables y la metodología utilizada. A continuación, en el cuarto apartado, se presenta el análisis de los resultados obtenidos, seguido por una sección final con las principales conclusiones derivadas del trabajo.
2. Antecedentes teóricos y formulación de hipótesis
Coursera, Udacity, edX y MiríadaX (Atenas, 2015; Rodriguez, 2013), en las cuales se centra el presente trabajo.
Desde el punto de vista de la teoría de las innovaciones disruptivas de Bower y Christensen (1995), los MOOCs son descritos como una práctica innovadora que implica una disrupción educativa (Yuan & Powell, 2013; Anderson & McGreal, 2012) y más exactamente como una innovación disruptiva de mercado, al convertirse en un interesante producto que combina un desarrollo tecnológico con un nuevo mercado de negocio que promueve un tipo de formación más flexible y de bajo costo (Vásquez, López & Sarasola, 2013).
No obstante la novedad del tema, se observa un ascenso permanente en la literatura (Sangrà et al., 2015; Gašević et ál. 2014; Liyanagunawardena, Adams & Williams, 2013a), especialmente desde el punto de vista de la demanda. Christensen, Steinmetz, Alcorn, Bennett, Woods y Emanuel (2013) sostienen que la mayoría de los participantes en estos cursos son jóvenes con estudios superiores y empleados, provenientes de países desarrollados, que buscan, además de satisfacer su curiosidad, mejorar su perfil laboral. Yousef, Chatti, Wosnitza y Schroeder (2015) agrupan en ocho clústeres los motivos de los participantes en MOOC: aprendizaje mezclado, flexibilidad, contenido de alta calidad, diseño instruccional y metodologías de aprendizaje, aprendizaje permanente, aprendizaje en red, apertura y aprendizaje centrado en el estudiante.
En España, el estudio auspiciado por Telefónica, (Oliver, Hernández, Daza, Martin & Albó, 2014), con datos a diciembre de 2013, indica que el 35% de las universidades tiene al menos un MOOC y que el fenómeno involucra tanto a universidades con tradición en formación a distancia como a universidades de tradición presencial, reconociendo una mayor oferta en las públicas e identificando a España como líder de la oferta de MOOCs en Europa, aspecto también reconocido por la CRUE (2015).
A partir de estos referentes, el presente trabajo se centra en estudiar si algunos factores característicos de la institución (prestigio, tipo de universidad -pública o privada, antigüedad, tamaño y región de origen) explican el nivel de oferta universitaria de MOOCs.
2.1. Prestigio
En la actual dinámica de internacionalización de la educación superior, uno de los objetivos comunes más importantes entre las universidades es incrementar su reputación y prestigio, en lo cual juega un papel clave su posicionamiento en los rankings (European Parliament, 2015). De hecho, en un ambiente competitivo, la reputación y el prestigio institucional son uno de los factores que determinan, entre otras cosas, la elección de universidad y carrera por parte de los estudiantes (Sierra, 2012; Aguillo, Bar-Ilan, Levene & Ortega, 2010; Docampo, 2008); llegando incluso a confirmarse que dicho prestigio no provenga necesariamente de actividades propias de investigación (Horstschräer, 2012; Maringe, 2006).
Por lo anterior, el prestigio ha sido analizado como factor estratégico de la universidad (Hollands & Tirthali, 2014; Jordan, 2014; Ospina & Zorio, 2016), siendo un término usado con frecuencia por las plataformas MOOC al declarar que su oferta proviene de las universidades más prestigiosas del mundo (Ong & Grigoryan, 2015; Schuwer et al., 2015; Pang et al., 2014; Yuan & Powell, 2013). También es uno de los objetivos que persiguen los participantes en MOOC, según el estudio de Yousef et al. (2015). Por lo tanto, puede plantearse que las universidades de mayor prestigio lideran la oferta con un mayor número de MOOCs, haciendo ostensible su innovación educativa. Así, la primera hipótesis que se propone es:
2.2. Carácter público o privado
Si bien es cierto que se trata de un fenómeno en el que participan instituciones públicas y privadas, la literatura existente permite asociarlo mayoritariamente al interés de actores privados con importantes cuantías de inversión (Yuan & Powell, 2013; Belleflamme & Jacqmin, 2014), en gran medida por la tendencia de crecimiento de la educación privada (UNESCO, 2009). Hollands y Tirthali (2014) y Allen y Seaman (2014), con referencia a instituciones estadounidenses, señalan diferencias estadísticas entre el tipo de instituciones que ofrecen MOOC, predominando las privadas. De igual modo, Shrivastava y Guiney (2014) ponen de relieve en su estudio una mayor tendencia hacia estos cursos en las universidades privadas, debido a una mayor resistencia en las públicas. No siendo así en España donde hay mayor oferta en las universidades públicas, que han contado con el impulso de una de las plataformas más utilizadas como “MiríadaX”, fruto de alianzas privadas (Oliver et al., 2014). Para validar esta tendencia, se plantea la siguiente hipótesis:
H2: La universidad de tipo privada evidencia, con significatividad estadística, una mayor oferta de MOOCs que la universidad pública.
2.3. Antigüedad
De otra parte, interesa estudiar si el factor antigüedad genera diferencias significativas en la oferta universitaria de MOOCs. Este factor ha sido analizado en diversos estudios sobre educación superior (Luque-Martínez, 2013; Guzmán, del Moral, González & Gil, 2013; Gallego-Álvarez, Rodríguez & García-Sánchez, 2011), hallando por ejemplo, una relación significativa y negativa entre la edad de la universidad y el uso de TIC (Iniesta, Sánchez & Schlesinger, 2013). Considerando estos antecedentes, se admite que las universidades más antiguas, que han construido su know-how en muchos años, tienden a preservar más que las jóvenes su imagen corporativa (Gallego-Álvarez et al., 2011) y en consecuencia, podrían ser menos entusiastas frente a modelos que, respecto de su efectividad, aún se encuentran en estado incipiente como los MOOCs. Por lo anterior, se formula la siguiente hipótesis:
2.4. Tamaño
El tamaño de la institución, medido en número de estudiantes o de profesores, es otro de los factores característicos analizados en educación superior (UNESCO, 2009; Luque-Martínez, 2013; Guzmán et al., 2013; Gallego-Álvarez et al., 2011). Según el estudio de Allen y Seaman (2014), las instituciones estadounidenses de mayor tamaño -con más de 15 mil estudiantes- son las más proclives a la oferta MOOC. Otros estudios (Hollands & Tirthali, 2014; SCOPEO, 2013), indican que la iniciativa responde en muchos casos a aliviar la presión por alta demanda -cursos "cuello de botella”, factor asociado al tamaño, en número de estudiantes. De acuerdo con Ospina y Zorio (2016), un bajo tamaño, medido en número de profesores, es la única condición presente en una de las dos soluciones que llevan a un perfil universitario no-intensivo en MOOC. Estos antecedentes permiten plantear que son las universidades de mayor tamaño las que disponen de un mayor nivel de recursos para hacer frente a este tipo de innovación, por lo cual se propone la siguiente hipótesis:
H4: Existe una relación significativa y positiva entre el tamaño de la universidad y su oferta de MOOCs.
2.5. Región
El estudio de Aguillo, Ortega y Fernández (2008) anima a pensar en la importancia de este factor al sugerir la tendencia de las universidades norteamericanas a hacer un mejor y más profundo uso de la web. Por otro lado, aunque se reconoce que el primer MOOC se lanzó en Canadá en 2008 y la literatura señala la preponderancia del fenómeno en los EEUU (Schuwer et al., 2015; Yousef et al., 2015; Shrivastava & Guiney, 2014; Liyanagunawardena et al., 2013a; SCOPEO, 2013), nuevos participantes de otras regiones se incorporan a la oferta, señalando incluso una mayor tendencia creciente del fenómeno en Europa (Jansen et al., 2015). En consecuencia, interesa validar este aspecto planteando la siguiente hipótesis:
3. Diseño del estudio: Metodología, datos y variables
La metodología consta, en primer lugar, de un análisis estadístico descriptivo para lograr una primera aproximación a las variables del estudio, seguido de un análisis bivariado que permite explorar la importancia de cada una de las variables disponibles en relación con la oferta MOOC. Posteriormente, un análisis de regresión múltiple permite corroborar cuáles de las variables incluidas en el modelo tienen algún grado de incidencia en el nivel de oferta MOOC.
3.1. Muestra
Región américaNorte- SuraméricaCentro y Europa Asia y Oceanía
Total Países EE.UU.Canadá
Argentina Colombia México Perú Puerto-Rico R-Dominicana Alemania Bélgica Dinamarca España Francia Holanda Reino-U. Italia Rusia
Suecia Suiza
Australia China Corea-sur Hong-Kong India Israel Japón Singapur Taiwán Turquía
Coursera MOOCUniv. 34542 122 2597 1455 50983
Países 2 1 10 9 22
edX MOOCUniv. 14616 00 318 1046 22334
Países 2 0 6 6 14
Udacity MOOCUniv. 212 00 00 00 212
Países 1 0 0 0 1
Miríada X MOOCUniv. 00 1016 13522 00 15132
Países 0 5 1 0 6
Total MOOCUniv. 51260 1228 26355 10124 151904
Países 2 6 11 10 29
Tabla 1. Descripción de la muestra
3.2. Magnitudes y variables
Para medir el prestigio (H1), se han considerado, como proxys, dos rankings de amplio reconocimiento mundial pero con diferencias metodológicas sustanciales: Shanghai, (ARWU, 2014) cuya clasificación privilegia la actividad de investigación (Aguillo et al., 2010; Aguillo et al., 2008; Docampo, 2008) y Webometrics, (Cybermetrics Lab, 2014) que clasifica a las universidades en función de su visibilidad en Internet (Chen, Tang, Wang & Hsiang, 2015; Garde-Sánchez, Rodríguez & López, 2013; Aguillo et al., 2008). Ospina y Zorio (2016), mediante un enfoque cualitativo (fsQCA), ponen en evidencia que la ausencia del prestigio, medido a través del ranking Webometrics, es una condición suficiente que lleva a un perfil universitario no-intensivo en MOOC.. En el presente estudio se ha querido incorporar, además, el ranking de Shanghai para comprobar si al igual que Webometrics, está relacionada con la oferta MOOC.
variable LNEDAD, que constituye el logaritmo neperiano de la edad en años de la institución desde su fundación. Para medir el tamaño de la universidad, H4, de acuerdo con estudios previos (Allen & Seaman 2014; Guzmán et al., 2013; Gallego-Álvarez et al., 2011) se han utilizado dos variables, LNFACULTY y LNESTUD, que representan el logaritmo neperiano del número de profesores vinculados y del número de estudiantes matriculados en la universidad, respectivamente; el análisis bivariado permitirá elegir, entre estas dos, la variable que mayor nivel de relación y significatividad alcance con la dependiente. La variable REGION, H5, agrupa el país de origen de cada universidad (Guzmán et al., 2013) en cuatro grandes regiones, Norteamérica, Centro y Sur América, Europa y Asia, y Oceanía.
De otra parte, la literatura existente (Ospina & Zorio, 2016; Daniel et al., 2015; Bartolomé & Steffens, 2015; Hollands & Tirthali, 2014; Liyanagunawardena, Adams & Williams, 2013b; SCOPEO, 2013) ofrece elementos de referencia para considerar en el estudio, como variables de control, dos factores externos que pueden afectar la oferta de MOOCs, relacionados con el país de origen de las universidades: el Producto Interno Bruto (PIB) per cápita y el nivel de penetración de Internet, cuyo datos fueron tomados de los indicadores de desarrollo mundial: la sociedad de la información (World Bank, 2014). Así, la variable PIB toma el valor 0 cuando el PIB per cápita del país de la universidad es menor al de la media del conjunto de los 29 países implicados en la muestra, en este caso, US$50.000, y el valor 1 cuando es mayor. La variable INTERNET toma el valor 0 cuando la penetración de Internet (% de la población con acceso) en el país de la universidad es menor a la media del conjunto de países de la muestra, en este caso, al 70%, y el valor 1 cuando es mayor.
Para analizar la relación de la oferta MOOC en función de las variables descritas, se plantean dos modelos de regresión múltiple,
• incorporando la variable SHANGHAI como medida del prestigio más orientado al impacto de la producción científica; y
• incorporando a cambio, la variable WEBOMETRICS, cuya orientación principal es hacia el impacto general de la universidad en la Web.
MOOCi = β0 + β1 (SHANGHAI) + β2 (TYPE) + β3 (LNAGE) + β4 (LNFACULTY) + β5
(REGION) + β6 (GDP) + β7 (INTERNET) + ε i (1)
MOOCi = β0 + β1 (WEBOMETRICS) + β2 (TYPE) + β3 (LNAGE) + β4 (LNFACULTY) +
β5 (REGION) + β6 (GDP) + β7 (INTERNET) + ε i (2)
donde MOOC es la variable dependiente que representa el número de MOOCs ofrecido por la Universidad; “i” representa a cada universidad incluida en la muestra; β0 es el parámetro del término constante; mientras que cada uno de los coeficientes de las variables se denota con β1,… β7. El término de error, ε, capta los factores no observados en el modelo. Para el tratamiento estadístico de los datos se utilizó el programa Stata v.12.
4. Análisis de resultados
A Continuación se presenta el análisis de la estadística descriptiva, seguido del análisis bivariado para proseguir finalmente con el análisis de regresión múltiple.
4.1 Análisis descriptivo