http://dx.doi.org/10.4236/gep.2014.25005
Study on Ultimate Pullout Force of
Grouting Anchors of the
Anchor-Pull Retaining Wall
Hongbo Zhang
1,2, Yifan Yu
1,2, Xiuguang Song
1,2, Yingyong Li
2, Jianqing Wu
1,2 1School of Civil Engineering, Shandong University, Jinan, 250061, China2Subgrade Security Engineering Research Center of Shandong Province, Jinan, 250061, China
Email: [email protected]
Received August 2014
Abstract
Determination of the grouting anchor pullout force is a key step during the design of anchor-pull retaining wall, but it is mostly determined relied on empirical formula at present, and the ratio-nality and the safety cannot be effectively guaranteed. Based on the engineering case of the gravity retaining wall of Qinglin Freeway, the model test was designed, and combined with the results of the ABAQUS finite element numerical analysis, it was analyzed that how the anchor axial pulling force distributes. The results showed that the force of the anchor near the wall bolt was large and which far from the wall was small and the ultimate pullout force was proportional to the length, diameter and shear strength. When the end tension of the anchor was small, the top load played a leading role on the anchor tension. This conclusion confirmed the calculation formula of ultimate pullout force was and provided a theoretical basis for anchor-pull retaining wall design and cal-culation.
Keywords
Anchor-Pull Retaining Wall, Ultimate Pullout Force, Lateral Earth Pressure, Model Test, Numerical Analysis
1. Introduction
2. The Design of Model Experiment
2.1. Design Principle
Model test is carried out in the model tank, which is made with four steel plates, three of which is fixed to the surface and one is free. The installation of the anchors is at the height of 80 cm and 130 cm of the steel plate. The model tank is filled with sand. The free wall tilts outward when the top was applied by load, which led anchor with pullout force. But the friction between anchor and soil can keep the balance. The change rules can be got by detecting the displacement, soil pressure of the free wall, and the anchor tension.
2.2. Model Design
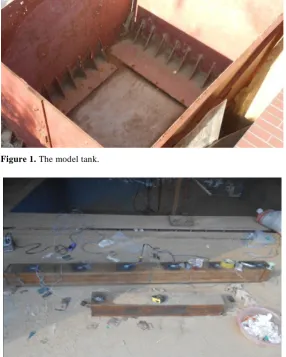
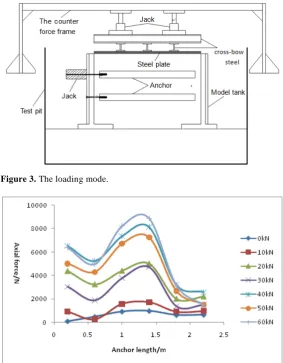
[image:2.595.171.457.283.479.2]The size of the model tank is 270 cm × 200 cm × 200 cm, which is made with four steel plates, three of which is fixed to the surface and one is free as shown in Figure 1. The wall thickness is 2 cm. The installation of the anchors is at the height of 80cm and 130cm of the steel plate. The anchor diameter is 26 mm which is connected to the free wall with nut. Strain gauges were stuck on both sides of the anchor at the position of 20 cm, 60 cm, 100 cm, 140 cm, 180 cm, 220 cm. It was shown in Figure 2. The anchor tension was got through monitoring the
[image:2.595.171.458.330.688.2]Figure 1. The model tank.
strain gauges by the static and dynamic test instrument. The model tank is filled with sand. Its maximum dry density is 1.75 g/cm3 and the minimum dry density is 1.375 g/cm3. The friction angle is 40˚.
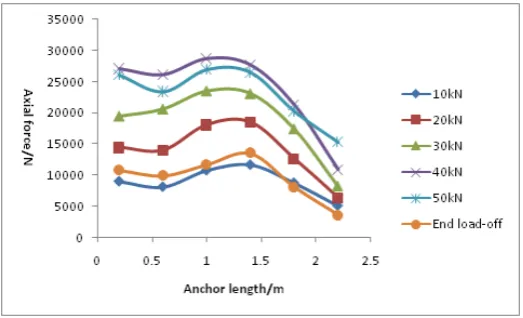
2.3. Loading Mode
When the soil reaches a predetermined height, a piece of steel plate was spread on the sand. Two jacks were used to load. The steel plate is used to change the concentrated load to be uniformly distributed load, which is used to simulate the subgrade and vehicle load. The upper loading was applied by 10 kN, 20 kN, 30 kN, 40 kN, 50 kN 60 kN five levels. When the upper load was 60 kN, the jack was also used to load at the end of the upper anchor by 10 kN, 20 kN, 30 kN, 40 kN, 50 kN five levels. The loading mode was shown in Figure 3.
3. The Analysis of Experimental Data
3.1. The Axial Force of the Upper Anchor at Upper Loading
The following can be obtained based on Figure 4:1) Due to the increased upper loading, the lateral earth pressure of the retaining wall increased. The extrover-sion tendency of the retaining wall led to the bolt axial force increasing. So the axial force of the anchor’s every position increased with the top load increasing.
[image:3.595.171.455.333.697.2]2) Due to the friction between the soil and the retaining wall and the influence of uneven load distribution, the middle part of the axial force of the anchor is higher than the two ends.
Figure 3. The loading mode.
3) Due to the cumulative effect of friction between anchor and soil along the length, so the axial force of the anchor showed that it is larger near wall and smaller far from the wall.
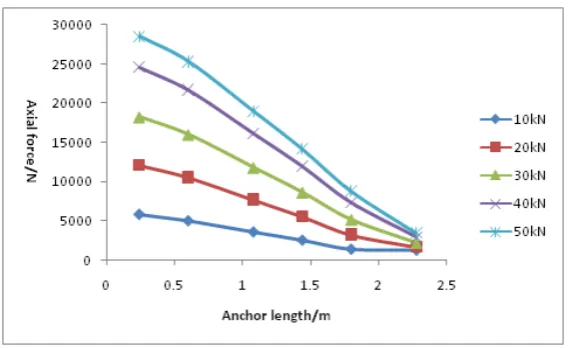
3.2. The Axial Force of the Upper Anchor at End Loading
The following can be obtained based on Figure 5:1) 40 kN > 30 kN > 20 kN > 10 kN
Along with the increase of end load, the anchor had the trend of moving outwards, then soil would provide greater friction, so the anchor axial stress increased.
2) 40 kN > 50 kN
Under the top load of 60 kN, when the end tension of the anchor increased to 50 kN, the relative slip appeared between the anchor and soil, which caused the stress redistribution, so the ultimate pullout force was between 40 kN and 50 kN.
3) The force of 0.2 m > the force of 2.2 m
The Anchor bearing the tension was realized by the mutual friction with soil. In the side, the axial force near the wall is large because the friction length is small. The axial force far from the wall is small because the fric-tion length is large, which accords to the law.
4) The axial force at the middle of the anchor is very large.
Due to the stiffness of the steel plate is not enough, so that the load is not evenly distributed, which resulted in the intermediate load at the middle position and caused the uneven settlement, so the soil arching effect ap-peared. The pressure of the middle position was large, so the axial force of the anchor is large at the middle.
4. Numerical Simulations
4.1. Model Establishment
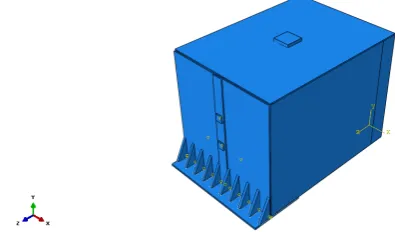
The retaining wall model constructed by ABAQUS was shown in Figure 6. The top of the retaining wall was applied uniformly distributed load, and the end loading was the same as model test.
The numerical model was the same size as the model test. The density of sand was 1750 kg/ m3. Young’s modulus was 60 MPa. Poisson’s ratio was 0.32. The friction angle was 40˚. Cohesion was 5 kPa. The density of the model tank and anchor was 7850 kg/m3. Young’s modulus was 2.1 × 10⁴ MPa. Poisson’s ratio was 0.3. Sand was frictional contact with the model tank and anchor at the tangential. The coefficient of friction was 0.45. They were all isotropic.
4.2. The Axial Force of the Upper Anchor at Upper Loading
[image:4.595.183.445.546.705.2]The result of numerical simulation at upper Loading was shown in Figure 7 and Figure 8. The top load on the retaining wall is absolutely uniform, so the regularity of the axial force was better than the measured value. The axial force declined from near the wall to far from and the axial force of every position increased with the top load increasing. It was in good agreement at the numerical size and general regularity with the measured values.
Figure 6. Retaining wall model constructed by ABAQUS.
Figure 7. The anchor axial stress nephogram at the maximum end loading.
Figure 8. The axial force of the upper anchor at upper load.
4.3. The Axial Force of the Upper Anchor at End Loading
The result was shown in Figure 9. The pull force of the upper anchor is linear distribution under different load. With the increase of total friction, the pull force decreases gradually. Because the medium is homogeneous, so reducing is uniformly distributed.
Special instructions: The numerical simulation and curve at 50 kN is not at 50 kN actually. The anchor is crit-ical to failure at the moment, which is the ultimate pullout state.
Comparative analysis:
[image:5.595.171.458.399.579.2]Figure 9. The average pull force of numerical simulation of the upper anchor
gradually. It is the same as the theoretical calculation. But there is great difference between the numerical value and bolt measured value. But from the overall distribution, they are large near the wall and small far from the wall. It is also consistent in magnitude.
From the measured data, when the end tension of the anchor increased to 50 kN, the anchor tension force is less than 40 kN, so the ultimate pullout force is between 40 kN and 50 kN.
5. Conclusions
1) The grouting anchor pullout force is 46.21 kN in numerical simulation. 2) The calculation formula of ultimate pullout force:
0.8
u e
T土≤ ×πDLτ τ= +c K0γhtgϕ
πD = 0.6 m, Le = 2.3 m, c = 0,K0 = 1, γ = 18 kN/m 3
, h = (60/γ + 0.7) m, ϕ = 30˚. The pullout force is 46.27 kN by calculation. This value is very close to the numerical values.
3) But in case of many anchors, because of the influence of anchor group, calculation formula of ultimate pullout force will no longer apply. The ultimate pullout force need to be multiplied by a coefficient meet the re-quirements at this time.
4) Studies on the effects of anchor groups are mostly based on empirical and semi empirical analysis, and there is no substantive breakthrough in theory. Anchor group effect is similar to pile group effect, but now they are still studied separately, and the effect of interaction between pile and anchor does not be taken into account, which needs to be further studied.
Acknowledgements
This work was financially supported by National Natural Science Foundation of China (51208284) and Science and Technology Development of Shandong Province (2013GSF11603).
References
Ge, L. D., & Zhu, H. B. (1999). Application of Anchor Retaining Wall. Beijing Water Conservancy, 1, 20-22.
Liao, F. X., Chen, Y. K., & Yin, J. D. (2006) The Pressure Dispersion-Type Prestressed Anchor Cable Construction Tech-nology. Subgrade Engineering, 1, 85-87.
Ying, H. W., Jiang, B., & Xie, K. H. (2007). Considering Soil Arching Effect of Retaining Wall Active Soil Pressure Distri-bution. Chinese Journal of Geotechnical Engineering, 29, 717-722.
Zhang, H. B., Song, X. G., Jiang, J. H., et al. (2011). Model Test of Mechanical Characteristics of Cantilever Retaining Wall with Mutual Anchor. Applied Mechanics and Materials, 90-93, 508-513.
http://dx.doi.org/10.4028/www.scientific.net/AMM.90-93.508