GEOMORPHOLOGICAL MAPPING FOR CONSERVATION USING GEOINFORMATICS
Suneet Naithani* and V.B. Mathur
*Assistant Professor, School of Environment and Natural Resources,Doon University, Dehradun.
**Dean. Wildlife Institute of India, P.O. Chandrabani, Dehradun
Corresponding Author Suneet Naithani
Assistant Professor, Doon University ,Dehradun Uttarakhand
Geomorphology deals with surface features of the earth, their forms, origin and
development. The increasing application of geomorphic interpretation through aerial
photographs and satellite data facilitates the understanding of the relationship between
landforms, habitat and planning processes. The study was conducted in Great Himalayan
National Park Conservation Area (GHNPCA, 1,171 km2) in Himachal Pradesh.
Mapping of major units were done by using satellite imageries (FCC of IRS 1-B LISS
II Sept/Oct 1993, scale 1:50,000). Geomorphological mapping of the area was the main aim
to understand the habitat and its relation with impact on management and conservation
schemes. Nine categories have been delineated taking into account the topographical
features also. Area under different categories has been determined- the total length of the
major water divides and prominent facets calculated about 723.08 km2.). Aerial estimation of escarpments was about 33.82 km2 (3%). Exposed Rocks (2%), Alpine Exposed Rocks (13%), Escarpment (3%), Glacier (2%) and Moraines cover about 2% area. Besides that
other topographical features have also been generated like; slope aspect, contour, drainage
density, terrain complexity and digital elevation model.
The geomorphology is one of the important disciplines because various landforms are the
result of intersecting causes. Their significance is related to conservation efforts. This will
not only help to understand the distribution of species but also to understand any
development plan in hilly terrain. The landslides and poor constructions have a negative
impact because of their destructive nature. It is reflected through study that for hill
development or landscape planning, geomorphology and its mapping should be on priority
for proper understanding of management planning, species distribution, habitat suitability;
protected area management as far as overall conservation is concern.
Key words:- Habitat suitability, Conservation, Species distribution, Geomorphology and
Geo-informatics
INTRODUCTION
The discipline, deals with features of the globe, their origin, forms, their nature and development are termed as geomorphologyby Davis, W.M. (1912). The roles of factors that are important to understand the geomorphology are lithology, stratigraphy, climatic variation and the regional basis for the development of landforms. The geomorphology is primarily concerned with present day landscape. As far as the Himalaya is concerned, its evolution was from middle Miocene to Recent. Himalayas are still active and taking shape in the form of disasters in many ways, that is why landforms are dynamic in nature with many climatic factors influencing them.
concern. The various landforms can influence a habitat, conservation and developmental work in many ways like sloping gradient, elevation and aspect, altitude and water-divide affecting the quantity of solar energy, water, nutrients and other materials, while the slopes affect the flow of materials. Slope is also the deciding factor of intensity of disturbance, such as fire and wind, which are strongly influenced by the presence of vegetation (Swanson et al 1988). A number of workers have made an attempt to resolve the geological and geo-morphological complexity of the country and abroad using aerial photo’s and satellite data, mainly are Gugan and Dowman (1988), Davis et al, (1989), Falcidieno and Spagnuols (1990), Tripathi, et al (1996) and Rao et al (1996). Specific objective for this study was geo-morphological mapping being an element of landscape governs the suitability of habitat parameter affecting developmental activities normal livelihood and off curse the distribution of species.
STUDY AREA:
Comprise of four management entities viz. Great Himalayan National Park (GHNP)
about 754.40 km2; Sainj Wildlife Sanctuary (90 km2); Tirthan Wildlife Sanctuary (61 km2)
and Eco-development Area (265.60 km2). GHNP, located in Kullu district of Himachal Pradesh (310 33’ 00’’ – 310 56’ 56’’ N and 770 17’ 15’’- 770 52’ 05’’ E). The major tributaries of Beas river viz. Tirthan, Sainj, Jiwa and Parvati. Basically the Himalayan soils are in situ in nature and belong to Podsolic group. Broadly, three season can be recognised for the GHNPCA viz. Summer (April to June), Rainy (July to September) and Winter (October to March). Depicted in Fig.1.
Fig.1.
The study area lies in Inner Himalayas in GHNP, Kullu district, Himachal Pradesh. The work was referred by many workers including Mishra (1993), who broadly emphasised the
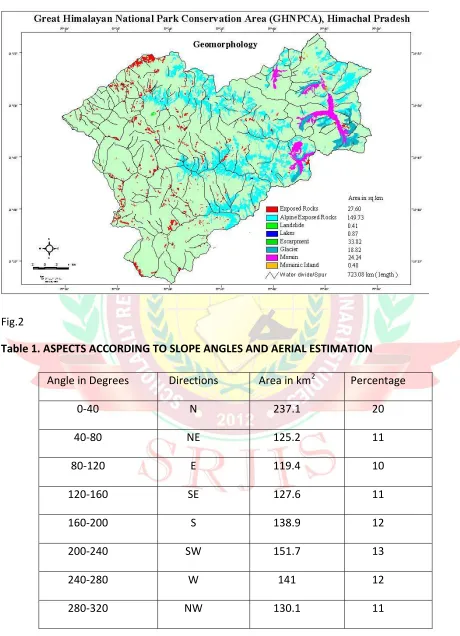
These rocks have been folded, faulted and thrusted as consequences of different tectonic episodes Fig.2.
The GHNP has about 60% of its geographical area under forest cover (Naithani, 2001). Based on the physiognomy; Temperate to Alpine forest types can be recognised in the study area. The fauna of the park comprises 31 species of mammals Vinod and Sathyakumar (1999), 183 species of birds Ramesh et al. (1999). The mammals; Musk Deer (Moschus chrysogaster) and pheasant; Western Tragopan (Tragopan melanocephalus) are important endangered species in the conservation area.
METHODOLOGY: Geomorphological mapping- The geomorphologic map of entire project area has been prepared mainly through IRS IB LISS II 1993-94 satellite data on 1:50,000 scale. Some physiographic details were transferred from toposheets (waterdivide/spurs) to the base map along with the interpreted units through satellite data.
Data Used: Satellite data of IRS-113 LISS II FCC 2,3,4, Geo-coded hardcopy of September/October 1993, Ancillary data; secondary and other collateral data used in the
study are as follow: Survey of India topographical maps No. 53 E/5, 53 E/6, 53 E/9, 53 E/10,
53 E/13, and 53 E/14 and Base map.
GIS Database: Using ARC/INFO UNIX based GIS, several other information were generated like; Digitization of thematic layers and labeling/attribute assignments and
Analysis of area calculations for management zones using GIS.
RESULTS
Geomorphology: Nine (9) major geomorphic units and seven (7) topographic Layers were delineated and
Fig.2.
Geomorphic Units
Exposed Rocks: These rocks were well distributed in all the valleys. The rocks are well exposed in the middle portion of the park and are
maximum in lower altitude zones of the study area. They cover an area about 27.60 km2 (2%).
Alpine Exposed Rocks: The area above 3600m to 4500m, where slope factor and mass movement was rapid was considered alpine exposed rock. The rocks were well exposed in the higher elevations up to the last limit of the park. The area was estimated to be about 149.73 km2 (13%).
Landslides: Landslides are the results of slope failure, may be natural (tectonic sensitivity, gravitation, seismic) or man-made (road construction, grazing, blasting, tree felling and mining). In the study area the existing landslides were mostly natural, occurring frequently in the study area especially in the rainy season. The aerial estimation of landslides was about 0.41 km2 (.03%).
Glacier: The glaciers are the huge solid ice mass moving or retreating along the valley floor. The glaciations of the valleys have considerably modified the original topography, which has been sculptured by subsequent fluvial action. The glaciers, moraines and fluvoglacial deposits generally occur in this zone. The aerial estimation of glaciers was about 18.82 km2 (2%).
Lakes: In the study area almost all the Lakes might have formed due to glacial erosion. More than 25 lakes were observed from the study area lying in the higher elevations through visual interpretation. The aerial estimation of all these lakes was about 0.87 km2 (.07%).
1993. The layer of escarpments were also digitized through Survey of India (SOI) toposheets and the area of the map calculate through GIS was 43.22 km2. The percentage difference between two areas was about 12.20%.
Moraine: Ridges and irregular deposits laid down by ice are termed as moraines. Some are associated with valley glaciers and others with ice sheets. Valley glaciers make lateral, medial, terminal and recessional moraines. The interpreted moraines may be primarily lateral or medial moraines. The aerial estimation of moraine was about 24.24 km2 (2%).
Morainic Islands: Morainic Islands are infact-uplifted debris above the valley floor, carried out by the glacier. When the glacier melts it leaves a large part of debris in the valley. The aerial estimation of these forms was about 0.48 km2 (0.04%).
Waterdivide/ Spurs: In the Himalayas major ridges and valley floor impede fire movement. This is an important aspect as far as the management of grasslands is concerned. It is noticeable the alpine grassland are distributed about 38% of the total vegetation in the conservation area. Besides that there are several other facets, which form important parts of study area. The total length of the major water divides and prominent facets calculated using GIS, was about 723.08 km2.).
TOPOGRAPHIC LAYERS:
Besides geo-morphological map some other basic inputs through SOI toposheets were produced in GIS domain with the help of contours and drainages.
Drainage Density (DD): The water availability in any area is an important factor for the Mitigation Planning and off course for survival of any species. The study area seems to be homogeneous, but for precise analysis the drainage density was also prepared and determined with following formula- Total no. of stream
Total area
Drainage Density was classified into four categories i.e. low, moderate, high and very high (Fig.6).
also the main source of depicting slope, aspect and DEM for any developmental planning with mitigative measures. The contour interval or 120m was considered because minimum mapable unit (one hectare) was taken into consideration.
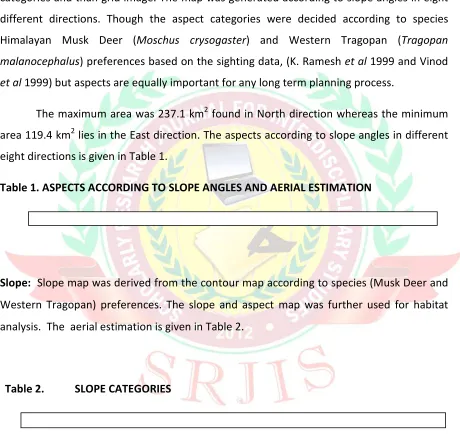
Aspect: The aspect map was derived initially from contours (line coverage) to slope categories and than grid image. The map was generated according to slope angles in eight different directions. Though the aspect categories were decided according to species Himalayan Musk Deer (Moschus crysogaster) and Western Tragopan (Tragopan malanocephalus) preferences based on the sighting data, (K. Ramesh et al 1999 and Vinod et al 1999) but aspects are equally important for any long term planning process.
[image:7.595.64.524.187.625.2]The maximum area was 237.1 km2 found in North direction whereas the minimum area 119.4 km2 lies in the East direction. The aspects according to slope angles in different eight directions is given in Table 1.
Table 1. ASPECTS ACCORDING TO SLOPE ANGLES AND AERIAL ESTIMATION
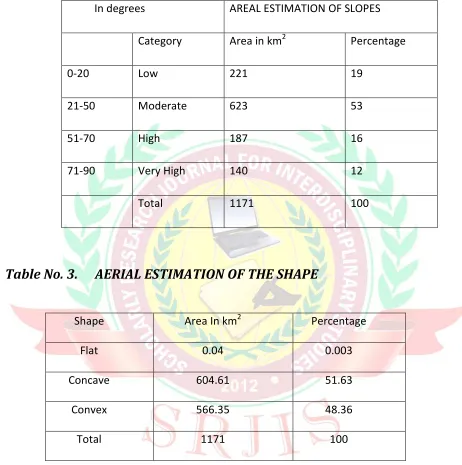
Slope: Slope map was derived from the contour map according to species (Musk Deer and Western Tragopan) preferences. The slope and aspect map was further used for habitat analysis. The aerial estimation is given in Table 2.
Table 2. SLOPE CATEGORIES
Table No. 3.
AERIAL ESTIMATION OF THE SHAPE
Terrain Complexity: The terrain can be expressed in the form of slope, shape but it can also be expressed as low, medium and high complexities. It was measured in GIS domain through DEM with 120 mt. of contour interval. The drainage and cliffs were also considered for better results.The whole idea was to capture maximum variability. The raster layer was considered for computation grid cell based variance for the entire spatial coverage. The aerial estimation is given in Table 4.
Table No. 4.
AERIAL ESTIMATION OF TERRAIN COMPLEXITY
Digital Elevation Model (DEM): To generate a DEM, a 120m contour interval was used after considering minimum mapable unit i.e. one hectare. Topogrid module a hydro logically correct grid of elevation from line and polygon coverages was generated. In this, contour data was used to generate a generalized morphology of the surface based on the curvature of the contours and also used as a source of elevation information. Stream data was used because they are powerful ways of adding additional topographic information to the interpolation, further ensuring the quality of the output DEM by Manual, GIS (ESRI, 1994).
DISCUSSION
Movement of ice in the past, which greatly steepened the valley walls, also formed escarpments. The difference in visually interpreted and digitized escarpment through Survey of India toposheets reflects the sensitivity of the area, which further indicates the loss of vegetation, wildlife, and on the contrary the escape terrain used by wildlife. So these areas may be the ecological sensitive areas. These areas are usually affected by annual rainfall, avalanches and manmade activities like construction, overgrazing and over tree felling. In view of this, the above geomorphic features need to be monitored on regular basis in order to evaluate their susceptibility. This study should be undertaken at micro watershed label preferably at cadastral level or 1:12,500 scale.
The water divides and spurs distinguish the major and minor watersheds. In general It
was observed that southern slopes are warmer then northern parts, which may also
influence the intensity of disturbances because of different slope conditions. The water
divides and spurs usually act as firebreaks / fire lines at any site. Hemstrom (1982) in
Pacific North- West USA has also reported, that major ridges and valley bottoms impede
fire movements. It is noticeable that the length of water divide can play an important role
for any hill station, developmental planning or even for protected areas.
In the study area grasslands was observed to be maximum (37.76%) of the total
vegetative cover (excluding habitation/agriculture/orchards). This shows the grasslands
covering large portion in the study area specially Alpine grasslands (17%). In the
Himalaya this distribution is mainly govern by the altitude and gradient It means the
grazing land/ pastures would be affected most if any change occurs in landscape
topography due to of avalanches, natural phenomena or even by manmade interventions.
This will lead to more disaster incidences and habitat loss.
It was observed by Dyson (1962), that a valley glacier may be a single ice stream or it
may consist of a main stream and several tributaries similar to a river system. In the
hanging valleys etc. U shaped and hanging valleys were observed. All these features
were vary well developed in all the valleys of National Park.
The glacial lakes were also interpreted especially at higher reaches. Rounded to sub rounded topography depict the presence of glaciations in the past. Few lakes seem to originate by the moraine dammed basins (product of glacial retreat) (Campbell, 1914), are swampy depressions within the ground moraines. These may be the suitable areas for the migratory birds. This particular phenomena applies on all Himalayan belt, unfortunately very little information is available regarding the hydrology of such lakes. In many countries, glacial lake out bursts leading to down valley floods has been reported. It is therefore, essential that such lakes should be mapped and monitored. Viewing the inaccessibility of the terrain, the satellite remote sensing data can be of great help in this regard (Naithani, 2008).
CONCLUSION
For integrated studies geomorphology can be treated as one of the parameters, because various landforms are the result of intersecting causes. There are no doubts with changing scenario not only the human being but also the wildlife species make use of several change habitats.
Over the years due to large-scale natural resource exploitation majority of the watersheds become vulnerable towards landslides. As far as development, planning implementation and conservation is concerned; the landslides and poor constructions have a negative impact because of their destructive nature.
It is reflected through study that for conservation planning or landscape management it
is a imperative to study the geomorphology and its mapping for proper understanding of
landforms and their relation to species distribution and diversity, habitat suitability for
better protected area management and wildlife conservation.
We express our sincere thanks to Director, Wildlife Institute of India (WII) for encouragement and logistic support during the course of this study. We are also thankful to Principal Investigator, WII-GHNP project and Director, Great Himalayan National Park (GHNP) for providing support and assistance for carrying out the field studies.
References:
Campbell, M.H. (1914). Glacier National Park. A popular guide to its geology and scenery. U.S.
Geol. Surv. Bull 600p.
Davis, P.A. and L.B. Greydon (1989). Rock discrimination in the complex geologic environment of Jabal Salma, Saudi Arabia using Landsat Thematic Mapper data. Photogrammetric engineering and remote sensing 55(8): 1147-1160.
Davis, W.M. (1912). Die Erklarende Beschreibung der Landformen. Leipzig, B.G. Teubner. 565p.
Dyson, J. L. (1962). The world of Ice. NewYork, Alfred A. Knopf, 292p.
Falcideno, B. and M. Spagnuolo (1990). Automatic recognition of topographic features for digital terrain modeling. Proceedings of spatial data handling, ( ed.) K. Brassel and H. Kishimoto (Department of Geography, University of Zurich), 35-44.
Gugan, D.J. and I.J. Dowman (1988). Topographic mapping from Spot imagery. Photogrmmetric engineering and remote sensing 54(10): 1409-1414.
Hemstrom, M.A. (1982). Fire in the forests of Mount Rainier National Park. In: E.E. Starkey, J.F. Franklin and J.W. Mathews, (eds.), Ecological research in National Park of the Pacific North West. Proceeding of the second conference on scientific research in the National Parks, Oregon State University, Carvallis, Oregon, 121-6.
Misra, D.K, (1993). Tectonic Setting and Deformation Features in Satluj and Beas Valley of Himachal Pradesh. Indian Journal of Petroleum Geology, Vol. 2 (1):81-92.
Naithani,S. (2008). Suggestions for Disaster Management in Uttarakhand. Published in ASTI, Journal of Training and Development, Volume IX Number I, January-June 2008, Pp100-105.
Ramesh, K., S. Sathayakumar and G.S. Rawat (1999). Ecology and conservation status of pheasants of the Great Himalayan National Park, Western Himalayas, Report Submitted to Wildlife Institute of India, 85p.
Rao, D.P., A. Bhattacharya and P.R. Reddy (1996). Use of IRS- IC data for geological and geomorphological studies. Current science 70(7): 619-623.
Roy, A.K. and D.K. Jugran. (1986). Remote sensing for geology and geomorphology of Kanha
wildlife habitat, M.P. Seminar on wildlife habitat. October22-23 at Wildlife Institute of India. 137-145.
Singh, S.P., B.S. Adhikari and D.B. Zobel (1994). Biomass, productivity, leaf longevity and
forest structure along in altitudinal gradient in the Central Himalaya. Ecological Monographs, 64(4): 401-421.
Swanson, F. J., T.K. Kratz, N. Caine, and R.G. Woodmansee. (1988). Landform effects on ecological process and features. Biosciences 38: 92-8.
Tripathi, J.K., R.C. Panigrahi and K.V. Kumar (1996). Geological and geomorphological studies of the part of Ganjan district, Orissa by remote sensing techniques. Journal of the Indian society of remote sensing 24(3): 170-177.
Fig.1
Fig.2
Table 1. ASPECTS ACCORDING TO SLOPE ANGLES AND AERIAL ESTIMATION
Angle in Degrees Directions Area in km2 Percentage
0-40 N 237.1 20
40-80 NE 125.2 11
80-120 E 119.4 10
120-160 SE 127.6 11
160-200 S 138.9 12
200-240 SW 151.7 13
240-280 W 141 12
[image:13.595.63.523.100.736.2]Table 2. SLOPE CATEGORIES
In degrees AREAL ESTIMATION OF SLOPES
Category Area in km2 Percentage
0-20 Low 221 19
21-50 Moderate 623 53
51-70 High 187 16
71-90 Very High 140 12
[image:14.595.59.521.134.599.2]Total 1171 100
Table No. 3.
AERIAL ESTIMATION OF THE SHAPE
Shape Area In km2 Percentage
Flat 0.04 0.003
Concave 604.61 51.63
Convex 566.35 48.36
Total 1171 100
Table No. 4.
AERIAL ESTIMATION OF TERRAIN COMPLEXITY
Class Area In km2 Percentage
Less complex 565 48.24
Highly complex 182.54 15.60