Tow a r d s t h e E x t r a c ti o n of
S t a ti s ti c al I nfo r m a ti o n fr o m
Di gi ti s e d N u m e r i c al Ta bl e s - T h e
M e di c al Offic e r of H e a l t h
R e p o r t s S c o pi n g S t u d y
Cl a u s n e r, C, An t o n a c o p o ul o s, A, H e n s h aw, C a n d H a y e s , J
T i t l e
To w a r d s t h e Ex t r a c tio n of S t a ti s tic al I nfo r m a ti o n f r o m
Di gi ti s e d N u m e r i c al Ta bl e s - T h e M e d i c al Offic e r of H e a l t h
R e p o r t s S c o pi n g S t u d y
A u t h o r s
Cl a u s n er, C, An t o n a c o p o ul o s, A, H e n s h aw, C a n d H a y e s , J
Typ e
Bo o k S e c ti o n
U RL
T hi s v e r si o n is a v ail a bl e a t :
h t t p :// u sir. s alfo r d . a c . u k /i d/ e p ri n t/ 5 2 8 3 3 /
P u b l i s h e d D a t e
2 0 1 9
U S IR is a d i gi t al c oll e c ti o n of t h e r e s e a r c h o u t p u t of t h e U n iv e r si ty of S alfo r d .
W h e r e c o p y ri g h t p e r m i t s , f ull t e x t m a t e r i al h el d i n t h e r e p o si t o r y is m a d e
f r e ely a v ail a bl e o nli n e a n d c a n b e r e a d , d o w nl o a d e d a n d c o pi e d fo r n o
n-c o m m e r n-ci al p r iv a t e s t u d y o r r e s e a r n-c h p u r p o s e s . Pl e a s e n-c h e n-c k t h e m a n u s n-c ri p t
fo r a n y f u r t h e r c o p y ri g h t r e s t r i c ti o n s .
Towards the Extraction of Statistical Information from
Digitised Numerical Tables - The Medical Officer of Health
Reports Scoping Study
Christian Clausner
1, Apostolos Antonacopoulos
1, Christy Henshaw
2, Justin Hayes
1(1)
PRImA Research Lab
The University of Salford
United Kingdom
www.primaresearch.org
(2)
Wellcome Collection
London
United Kingdom
wellcomelibrary.org
ABSTRACT
1Numerical data of considerable significance is present in historical documents in tabular form. Due to the challenges involved in the extraction of this data from the scanned documents it is not available to researchers in a useful representation that unlocks the underlying statistical information. This paper sets out to create a better understanding of the problem of extracting and representing statistical information from numerical tables, in order to enable the creation of appropriate technical solutions and also for collection holders to appropriately plan their digitisation projects to better serve their readers. To that effect, after an initial overview of current practices in digitisation and representation of historical numerical data, the authors’ findings are presented from a scoping exercise of the Wellcome Library’s high-profile collection of the Medical Officer of Health reports. In addition to users’ perspectives and a detailed examination of the nature and structure of the data in the reports, a study of the extraction and integration of the data is also described.
General Terms
Algorithms, Management, Reliability, Experimentation.
Keywords
Digitisation, Tabular data, Printed documents, Historical, Cultural Heritage, Recognition.
1.
INTRODUCTION
There is an abundance of tabular numerical data in historical documents. Examples are censuses, weather data, ship logs, medical reports, stock prices, and business-related data. The information represented by such data is of considerable significance as it provides an accurate account of historical facts and can be combined to identify trends and other useful insights not available from other sources. However, unlike narrative textual content, where digitisation is progressing well and in large scale, tabular numerical content is mostly untouched. The likely reason are the special challenges the processing of this kind of material poses: large quantity and complexity, low print / scan
quality, variability of table layouts, changing content over time (for long time series), and requirements for very high accuracy.
Contrary to making available the textual content of historical documents, extracting statistical information involves much more than the application of Optical Character Recognition (OCR). Simply recognising the numbers in a table is not sufficient, even though that also is a very challenging task due to the 100% accuracy required, the error-prone table layout analysis and the limited scope for automated correction using contextual information.
It should be noted that at the lowest level of data, a given numerical entry in a table represents a value for a specific row and column relation. Therefore, this semantic information must also be extracted and represented. Furthermore, in order to obtain higher level statistical information, semantically annotated data from several tables needs to be integrated.
Having the integrated higher level of information (across a complete collection) will allow more complex and useful questions to be asked. For instance, in a collection of medical reports (see later sections) one will not be limited to, say, finding how many cases of a specific disease occurred in a specific hospital in a specific year (information contained in a single table). Instead, one will be able to have answers to questions such as “which was the deadliest disease in London in the past Century?” or “What illnesses occurred in cities as opposed to the countryside?”.
Currently, statistical information such as described above is only available as a result of laborious manual entry of data in custom-made databases in very small quantities (see Section 2). The most common treatment of numerical table data in historical documents is its simple representation in a form (e.g. XML or CSV) replicating the original table in the document – a simple arrangement of numbers in rows and columns, with no semantic information.
In the following section, an overview of major trends in current practices in digitisation and representation of numerical information in historical documents is presented. Section 3 introduces the Medical Officer of Health reports, the collection on which the case study focused, and examines both the structure of the data contained and the users’ perspectives on the usefulness and usability of the data. A small-scale but complete data extraction and integration study on a representative subset is described in Section 4 and discussed in Section 5. Concluding remarks are made in Section 6.
2.
CURRENT PRACTICES
A review of current publicly available information and a consultation with a small number of key stakeholders (researchers and content holders) were carried out to establish different types of digitisation and current approaches to making the digitised numerical data (in different forms) available for consumption/re-use. While this was not a large-scale nor exhaustive search, it is realistically indicative of the current state of the art.
The value of numerical information is widely recognised, as is also the realisation that current digitisation pipelines and OCR do not deal with this information in a satisfactory way. Numerical information is present mostly in tabular form and, while OCR can very often recognise individual numbers/digits quite well, this is far from sufficient. This is for two reasons:
1. Numerical information needs to be absolutely accurate to the original – OCR errors are not tolerated by users in the same way as the occasional error in text is.
2. Current OCR makes several errors with respect to preserving page layout, especially spacing in tables. Errors in table cell spacing are detrimental to the semantics of the number content of cells, i.e. suddenly a numerical entry may wrongly refer to a different table column altogether.
At the very lowest end of provision, users can simply view numerical tables (in image form) contained on pages within scanned volumes which are indexed at the item level with the usual library record metadata – examples are the Public Health Reports from the US National Library of Medicine [1] and various medical etc. reports at the Hathi Trust Digital Library [2]. Since the content is not searchable, users search for relevant items(s) and browse through the images of each item, page by page, to identify the tables they are interested in. Page images can be downloaded.
The first level of improvement comes with indexing the individual scanned pages containing tables with keywords extracted from the table headers – through OCR (corrected or not) or manually keyed. An example is the historical statistics available from Statistics Sweden – the national statistics organisation of Sweden [3], where the numerical content of the tables is not made available online due to the unreliability of the OCR results obtained. A report on the corresponding large-scale digitisation effort [4] offers more details on the difficulties of OCRing historical tables. Another example is the Online Historical Population Reports (histpop) [5] maintained by the UK Data Service. In addition to item-level indexing (whole reports/books), raw text OCR results are available for some of the scanned pages and used for indexing and searching. Some of the items available at the Hathi Trust Digital Library [2] also have associated raw (uncorrected) OCR results which afford some usefulness with keyword search.
The next level of making numerical information available is through extracting the data (manually corrected OCR or manual entry) and re-creating the visual representation of tables in an encoded form. The numerical information of each individual table can thus be copied by the user and pasted onto a spreadsheet etc. for further analysis. Examples of this, in the simplest form with tables represented in HTML, are the Digitised Collections of Statistics New Zealand [6] and the results of the German project Digital Reich Statistics (for some of the tables) [7]. The Medical Officer of Health (MOH) reports at the Wellcome Library [8] are the best example in this category, with individual tables recognised, corrected, indexed and visually reconstructed for viewing on the web, and the corresponding numerical information available for download in a variety of formats.
Finally, in the ultimate form that is most useful to researchers, numerical information is transcribed from tables, cross-referenced and standardised in a purpose-made database and is fully searchable (faceted search). It should be noted that the resources required (funding and time of field experts) to achieve this are very significant and, correspondingly, information is not currently available at large scale. The prime example in this category is Project Tycho® at the University of Pittsburgh [9] where completely transcribed data on disease counts from a variety of primary sources (scanned reports such as those from [1] and [2]) are available and visually presented as graphs. At the time of writing, the UK’s Office for National Statistics is about to release the complete data extracted (with a combination of a new semi-automated workflow and crowdsourcing) and verified by the PRImA Research Lab from the scanned 1961 Census (Small Area Statistics tables) [10]. When ingested in a suitable database, this data will offer similar functionality at large scale and at lower production cost.
3.
THE MEDICAL OFFICER OF HEALTH
REPORTS
This section introduces the Medical Officer of Health Reports, provides an overview on the tabular content, and outlines problems and challenges (as identified in the scoping study).
3.1
The Collection
The Wellcome Collection [11] represents the UK’s largest collection of Medical Officer of Health reports, charting the development of public health country-wide over a period of 130 years.
In the mid-19th century, in the aftermath of the first national cholera outbreak, the UK government took steps to establish a substantial public health monitoring service. Starting in Liverpool in 1847 when the first Medical Officer of Health (MOH) was appointed, local authorities began to take stock of the state of the health of the local populations. By the time the 1875 Public Health Act came into force nearly every local authority in the country had an MOH.
The first big data gathering exercise on the health of a nation was now in full swing. Each year the MOH prepared a report for the local authority summarising the information the team had gathered and providing expert commentary on their findings. This continued until the 1970s, when the NHS largely took over the MOH’s monitoring and reporting functions.
statistics. Over time, the reports became more and more comprehensive and often contained statistics on occurrences of many different types of diseases and ailments, causes of death, local sanitary conditions, school health, food inspections, water safety, housing, and more.
[image:4.612.334.492.163.385.2]
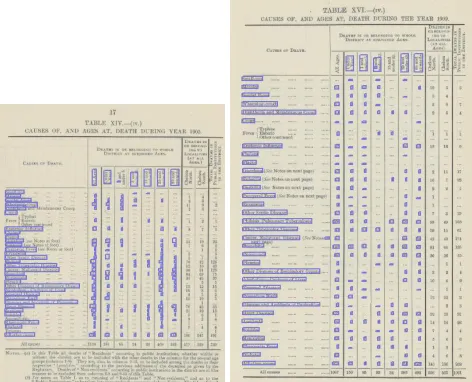
Figure 1. Example MOH table showing causes of death.
Millions of tables are now freely available as OCRed text alongside the images of each report, on Wellcome’s website. In theory. In practice, it is very difficult to discover and access tabular data in this format. Wellcome has extracted tabular data from a small set of reports (covering greater London), but the process required a large amount of manual correction that is not feasible for the entire collection. Access is also a challenge when providing numerical data to the public.
A pressing need is recognised to start considering other ways to extract the data, with a more fully automated process, and to consider what the user community really needed in terms of discovery and access to such a vast set of statistical data.
3.2
Tables and Topics
To identify the most popular topics of tabular content within the MOH reports a text-based analysis was performed on all table captions contained in the transcribed tables for Greater London.
The table captions were grouped by similarity (using an automated method) and sorted by frequency of topics. Table 1 shows the most popular topics.
From results of the textual similarity analyses of captions as described above but also from column headers and row headers, an ontology of broad topic categories (see below) was developed as a tool to enable classification and characterisation of the information content of tables with the most commonly occurring groupings:
• Demographics
o Age
o Sex
o Births o Deaths
▪ Causes of death
▪ Infant death
• Ailments
o Diseases
▪ Infectious diseases
▪ Notifiable diseases o Immunisations
• Environmental o Inspections
▪ Food
▪ Conditions o Meteorological
• Financial
• Legal
As would be expected, most tables report information for district areas, but many tables also report for areas from smaller geographies such as sub-districts and wards. Some tables also contain information for larger geographies in order to draw regional and national comparisons.
There is considerable variety of information content, and of physical structure in the arrangement of captions, columns and rows in tables across the reports. However, there is much similarity in the structures of certain tables with more commonly occurring combinations of variables (Cause of Death by Age and Sex, for example) which use standardised, externally defined classifications.
There is wide variety in the information content and structures of tables across locations and time. However, there are tables with some combinations of variables (Cause of Death by Age and Sex, for example) that are present with a good level of consistency in structures across many locations and many years.
Table 1 - Topics identified from table captions
Topic Table Count
(approx.) Mortality / Cause of Death 2530 General statistics / demographics 1900 Infectious Diseases / Notifiable
Diseases
1720
[image:4.612.310.532.634.715.2]Financial 470
Food 330
Births 240
Meteorological 100
Legal 190
Immunisation 60
3.3
User Consultation
A focussed online survey was created by the authors containing a set of questions developed and circulated to a select group of people identified from suggestions from Wellcome, as well as from other contacts with interests in using information from the MOH reports. In addition, an informal meeting was held with researchers from the Centre for the History of Science, Technology and Medicine at the University of Manchester to discuss the survey results and any wider perspectives.
The information collected showed that respondents had a mixture of levels of awareness of the MOH reports. Those who had already used the reports had mainly done so for a variety of academic research purposes. Respondents were keen to make use of information on various topics contained in the reports, particularly information relating to: Basic demographics, mortality and cause of death, ailments, and fertility.
Respondents generally found the current access functionalities (e.g. search by topic and time period) very useful, and made positive comments about them, along with some suggestions for improvements.
An informal meeting was also held with staff from the Centre for the History of Science, Technology and Medicine at the University of Manchester. In addition to confirming the results of the survey, participants suggested that there would be a wide range of different audiences from different disciplines with different interests in using data retrieved from the MOH tables (e.g. historians of various kinds, geographers, demographers, medical researchers). Interests would vary from those interested in finding and using individual tables containing data of interest in the context of their containing report to researchers (e.g. epidemiologists) more interested in comparative analyses of large subsets of data spanning many years and/or different areas.
4.
EXTRACTION OF TABULAR DATA
One task of the MOH scoping study was to explore ways to extract and integrate tabular data in large scale. Transcribed tables for Greater London were available in form of XML files reflecting the table content (but not the meaning of fields in a standardised or identifiable form). One goal was to analyse if a (costly) transcription is necessary for the remaining reports (outside Greater London) or if a more efficient solution can be applied.
4.1
Table Recognition
In the context of the MOH reports, table recognition can be broken down into three tasks:
1. Identifying pages containing relevant tables. 2. Locating a table within a page image. 3. Identifying and extracting fields (data cells).
The high-level scoping exercise identified common variables and categories present in the MOH report tables, and common combinations in multivariate tables. By examining multiple instances of tables containing equivalent information described by
categories belonging to the same variables, it is possible to construct table ‘fingerprints’ containing sets of keywords most often associated with particular combinations of variables, and especially words that are unique to particular variables. These fingerprints can be used to search for tables in unstructured text directly produced from OCR (including row and column headers of tables).
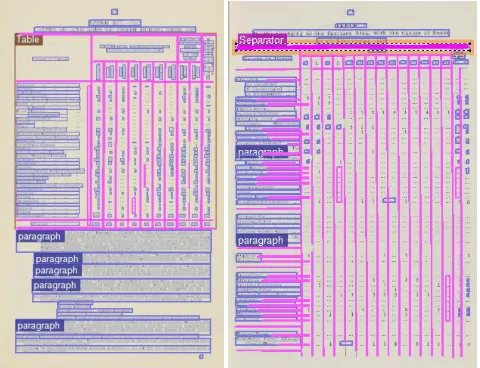
To locate a table within a page image (scan), detailed results from OCR systems (such as ABBYY FineReader Engine) can be used. In addition to the recognised text, such outputs contain information on the page structure and contained non-text objects. ABBYY FineReader can detect and locate tables. Although one of the best systems for this task (see ICDAR 2013 Table Competition [12]) Experiments showed that this is not very reliable for the material at hand. Alternatively, tables can be identified from other features, such as large numbers of vertical separators to locate them and define their content. While exact numbers would require more extensive experiments, accumulations of vertical separators (see Figure 2) should very reliably point to tabular content. A text-based analysis of OCR result, looking at the number of digits found, can further enhance the table detection accuracy.
[image:5.612.319.559.309.493.2]
Figure 2. Example OCR output (content objects highlighted: blue: text, brown: table, magenta: separator). Produced with ABBYY FineReader default settings and export to PAGE
XML format.
Once a table candidate page is identified, it can be tried to find relevant table columns and rows. A prototype algorithm was developed which tries to find predefined table headers within an uncorrected FineReader OCR result.
Figure 3. Recognised table content for two different table layouts.
4.2
Data Integration and Quality Assurance
In order to integrate data and metadata retrieved from multiple tables containing information about similar characteristics a further challenge must be addressed. Global data models with structures (variables and categories) must be developed that are standardised, but contain the variation required to describe the full range of input data and metadata.
A data recovery and integration exercise was carried out using the Wellcome MOH transcribed tables (XML files) to explore the feasibility of, and effort required to create an integrated and operable information resource that could provide a backend for application development to deliver users with discovery, browse and query functions across the information contained in commonly occurring tables across different reports (across geographies and time). This would satisfy the majority of user requirements. The exercise focussed on tables containing information about Cause of Death by Age and Sex. These tables were chosen as most likely to deliver high value for effort.
Cause of Death tables from several districts from 1910 were examined, and data and metadata were retrieved from them and integrated into an interactive spreadsheet with simple data filtering functionality to demonstrate the benefits that recovery and transformation of information from images into operable digital data provide.
When working with OCR results, quality assurance measures have to be put in place to test and/or improve the accuracy of extracted numerical values. Most tables within the MOH collection have internal redundancies such as row and column totals and other sums that can be used to validate individual field values. If inconsistencies are found, these can be addressed by further (targeted) processing or manual post-correction (e.g. via crowdsourcing).
5.
DISCUSSION
A main goal of the scoping study was to identify problems for extracting tabular statistical data from Medical Officer of Health reports and outline possible solutions. This section discusses the findings.
The challenge of a large quantity of documents and the complexity of tabular content and topics can be approached by using semi-automated textual analysis (based on transcribed text or OCR results). Grouping by similarity of headings can help to find and sort topics by popularity (quantity).
Variability of table layouts can be handled by using a flexible table recognition approach that identifies a table by textual features, locates a table on a page based on structured OCR outputs, and extracting the relevant fields of interest. In context of data integration, variability can be handled by developing models generic enough to capture statistical data over the entire time period of interest and by documenting changes of terms and concepts over time.
Low print and/or scan quality can be overcome by image pre-processing, adaptive table recognition methods, quality assurance measures, and (automated) post-correction. Scanning-related quality problems could also be reduced by rescanning of part of the material, finetuned to the table data extraction task (if cost-effective).
The requirement of achieving the highest possible accuracy of extraction results can be fulfilled by integrating the data, validating it using table-internal (and geographical) redundancies, and qualifying (and/or correcting) the extracted tabular data by a degree of confidence of correctness.
Feedback from users indicates that a way of locating the tables they need (across all reports) for their work would add considerable value to the collection and its attractiveness for use. Having an index of relevant tables created based on user query terms would facilitate researchers’ work considerably. Such an index, generated on the fly or as a set of pre-stored query results, can be presented in chronological order and/or according to geographical area.
6.
CONCLUSION AND FUTURE WORK
The scoping study showed that, in addition to considerable interest in statistical data of this nature, automated extraction is a viable alternative to costly (manual) transcription. Despite the challenging nature of the task, technical solutions exist to overcome obstacles like low-quality input data and demand of high-accuracy output data.
Key topics and tables can be identified and processed. Flexible detection and recognition approaches can extract numerical information together with their context and meaning. Data integration and validation helps to deliver usable and reliable data.
Providing high-quality queryable large-scale data enables whole new research endeavours where so far only small data samples could be collected using cumbersome manual data gathering. Deep statistical insights into our past are now achievable and feasible. Large-scale work of this kind is already being carried out (for example the 1961 Census of England and Wales project mentioned earlier).
Future work regarding the MOH reports could include:
• Creating an index of exiting transcribed MOH tables for better accessibility.
• Indexing and data extraction across all MOH reports based on structured OCR results.
• Testing / developing improved table recognition algorithms (e.g. based on deep learning / convolutional neural networks).
In general, more work is needed to create generic data models, integration approaches, and validation procedures for numerical statistical information. This would represent a more efficient solution that can be applied to different digitisation projects for tabular data (ship logs, stock market, registers, censuses etc.).
7.
REFERENCES
[1] Public Health Reports, US National Library of Medicine, https://www.ncbi.nlm.nih.gov/pmc/journals/347/ (Last Accessed: 16/03/2018)
[2] Hathi Trust Digital Library, https://www.hathitrust.org (Last Accessed: 16/03/2018)
[3] Statistics Sweden – Historical Statistics,
http://www.scb.se/en_/Finding-statistics/Historical-statistics/Some-facts-about-historical-statistics/ (Last Accessed: 14/03/2018)
[4] Digitisation of Bidrag till Sveriges officiella statistik (BiSOS) – Project Report,
http://www.rj.se/GlobalAssets/Slutredovisningar/2006/Rolf-Allan_Norrmosse_eng.pdf (Last Accessed: 14/03/2018)
[5] Online Historical Population Reports (histpop), http://www.histpop.org/ (Last Accessed: 14/03/2018) [6] Statistics New Zealand, Digitised Collections,
http://archive.stats.govt.nz/browse_for_stats/snapshots-of-nz/digitised-collections.aspx (Last Accessed: 14/03/2018) [7] Digital Reich Statistics – Digitisation of the Statistics of the
German Reich – Alte Folge – (1873-1883),
http://www.digitalereichsstatistik.de (Last Accessed: 14/03/2018)
[8] London’s Pulse: Medical Officer of Health Reports (1848-1972), https://wellcomelibrary.org/moh/ (Last Accessed: 16/03/2018)
[9] Project Tycho®, https://www.tycho.pitt.edu (Last Accessed: 16/03/2018)
[10]C. Clausner, J. Hayes, A. Antonacopoulos, S. Pletschacher , "Creating a Complete Workflow for Digitising Historical Census Documents: Considerations and
Evaluation", Proceedings of the 2017 Workshop on Historical Document Imaging and Processing (HIP2017), Kyoto, Japan, November 2017, pp. 83-88.
[11]The Library at The Wellcome Collection,
https://wellcomelibrary.org (Last accessed: 01/02/2019) [12]M. Göbel, T. Hassan, E. Oro, G. Orsi, “ICDAR 2013 Table