R E S E A R C H
Open Access
Evaluation of a novel closed-loop
fluid-administration system based on dynamic
predictors of fluid responsiveness: an
in silico
simulation study
Joseph Rinehart
1, Brenton Alexander
1, Yannick Le Manach
2,3, Christoph K Hofer
4, Benoit Tavernier
5, Zeev N Kain
1and Maxime Cannesson
1*Abstract
Introduction:Dynamic predictors of fluid responsiveness have made automated management of fluid
resuscitation more practical. We present initial simulation data for a novel closed-loop fluid-management algorithm (LIR, Learning Intravenous Resuscitator).
Methods:The performance of the closed-loop algorithm was tested in three phases by using a patient simulator including a pulse-pressure variation output. In the first phase, LIR was tested in three different hemorrhage scenarios and compared with no management. In the second phase, we compared LIR with 20 practicing anesthesiologists for the management of a simulated hemorrhage scenario. In the third phase, LIR was tested under conditions of noise and artifact in the dynamic predictor.
Results:In the first phase, we observed a significant difference between the unmanaged and the LIR groups in moderate to large hemorrhages in heart rate (76 ± 8 versus 141 ± 29 beats/min), mean arterial pressure (91 ± 6 versus 59 ± 26 mm Hg), and cardiac output (CO; (6.4 ± 0.9 versus 3.2 ± 1.8 L/min) (P< 0.005 for all comparisons). In the second phase, LIR intervened significantly earlier than the practitioners (16.0 ± 1.3 minutes versus 21.5 ± 5.6 minutes;P< 0.05) and gave more total fluid (2,675 ± 244 ml versus 1,968 ± 644 ml;P< 0.05). The mean CO was higher in the LIR group than in the practitioner group (5.9 ± 0.2 versus 5.2 ± 0.6 L/min;P< 0.05). Finally, in the third phase, despite the addition of noise to the pulse-pressure variation value, no significant difference was found across conditions in mean, final, or minimum CO.
Conclusion:These data demonstrate that LIR is an effective volumetric resuscitator in simulated hemorrhage scenarios and improved physician management of the simulated hemorrhages.
Introduction
Automation is ubiquitous in modern life but historically has found limited application in medical care. However, recent interest has led to the rapid growth of research in automated controllers in areas ranging from glucose management to sedation to mechanical ventilation (1-3). Closed-loop (automated) controllers have been shown to manage patients safely and more consistently than
clinicians for myriad applications [1-3], but a key requirement for proper function is reliable feedback data from systems being controlled. In the case of fluid responsiveness, historical measures like urine output, central venous pressure, and pulmonary capillary wedge pressure are very poor predictors and thus unsuitable for use in a closed-loop system [4].
Fortunately, great progress has been made in two areas that now make automated fluid management prac-tical [5]. The first is the description and characterization of the dynamic predictors of fluid responsiveness. Para-meters like pulse-pressure variation (PPV), stroke
* Correspondence: [email protected]
1
Department of Anesthesiology & Perioperative Care, University of California, Irvine 101 S City Drive, Orange, CA 92868, USA
Full list of author information is available at the end of the article
volume variation (SVV), or respiratory variations in the plethysmographic waveform amplitude (ΔPOP) allow a reliable determination of whether a mechanically venti-lated patient is likely to respond to a fluid bolus with a subsequent increase in cardiac output (CO) [6-8]. This strong predictive relation can be used to guide resuscita-tion, and fluid therapy based on the dynamic predictors has suggested improved outcomes in recently published prospective trials [8,9].
The second area is the rapid advancement in monitor-ing technology; noninvasive and increasmonitor-ingly accurate monitors can provide vital-signs data previously available only through invasive approaches.
As one of the first steps in the development of an auto-mation algorithm is testing under simulation [10-15], we present data for a novel closed-loop fluid-management algorithm (LIR: Learning Intravenous Resuscitator) in simulation studies using heart rate (HR), mean arterial pressure (MAP), CO, and PPV as the input variables. The goals of the present study were (a) to assess the perfor-mance of LIR in a spectrum of bleeding scenarios, (b) to compare automated fluid management by LIR with stan-dard fluid management by practitioners in simulation cases, and finally (c) specifically to challenge the reliance of LIR on the accuracy of PPV for effective resuscitation.
Materials and methods
The study was performed during October and November of 2010 and February of 2011 at the UCI Medical Center in Orange, California. IRB exemption was obtained for the work done with faculty and residents.
Closed-loop algorithm design
The LIR algorithm is an adaptive controller that incorpo-rates data from previous clinical trials in its decision engine. It monitors a variety of patient hemodynamic parameters (CO, dynamic predictors like PPV and stroke volume variation, heart rate, and blood pressure) and uses this information to control fluid administration. The design of the algorithm is described in the following sections.
Database construction for use in the controller
A dataset of 414 patients, which contained hemodynamic parameters before and after a 500-ml bolus of hetastarch 6% or modified fluid gelatin given over a 10- to 20-minute period, was used to derive population-based formulas for guiding fluid therapy based on PPV and CO. This popula-tion, the method used, and the way CO was measured have been described elsewhere in detail [16]. Institutional review board (Comité de Protection des Personnes Hos-pices Civils de Lyon, Lyon, France, Comité de Protection des Personnes Paris-Ile de France, France, Comité de Pro-tection des Personnes Nord Ouest, Lille, France, and
Institutional Review Board Triemli City Hospital, Zurich, Switzerland) approvals were obtained. As described pre-viously, patients were included either as part of clinical trials or as part of routine clinical care [16]. CO was mea-sured in all patients (a) by thermodilution via a pulmonary artery catheter (PAC; Swan-Ganz catheter, 7.5F; Edwards LifeScience, Irvine, CA, USA), or (b) by the pulse-contour method by using a 4F thermistor-tipped arterial catheter (Pulsiocath thermodilution catheter) inserted into the left femoral artery and connected to a stand-alone PiCCOplus or PiCCO2monitor (Pulsion Medical Systems, Munchen,
Germany); or (c) via transesophageal echocardiography [16].
Controller characteristics
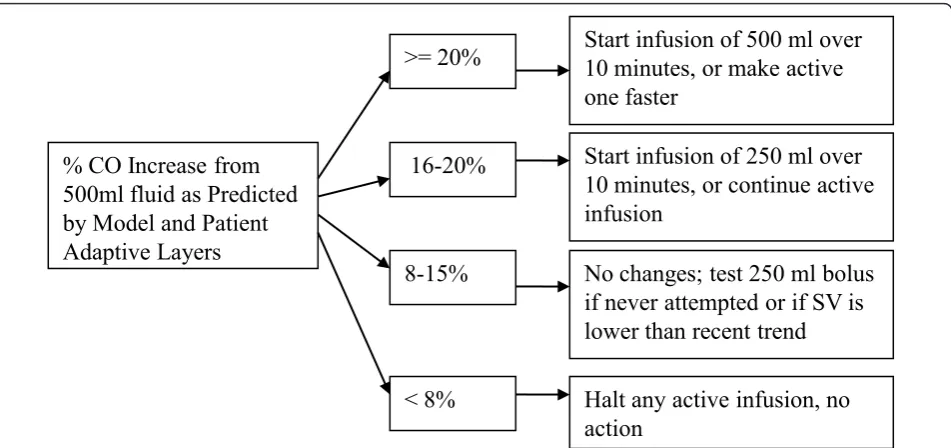
The controller uses the resulting database to calculate when a patient is likely to respond to a fluid bolus and with what degree of increase in CO. Patient hemodynamic parameters (primarily PPV, but also CO, mean arterial pressure (MAP), and HR) are compared with the dataset, and a probability of positive response is assigned based on the population data. This probability and the hemody-namic data are then modified based on previous patient responses to fluid administration and deviations from the model predictions. The core rule-based component of the system is shown in Figure 1. The net expected percentage increase in CO predicted by the previous layers is used to direct therapy. If little to no increase in CO is expected, no fluid bolus is given; if an infusion is already being given, it is halted. Conversely, if the expected percentage increase is high, a fluid bolus is started (or quickened). In the mid-dle range–the portion corresponding to the recently described“gray zone”[16]–no actions are taken, and if a bolus is already running, it will be allowed to continue. Under some circumstances (for example, a downward trend in CO), a test bolus may be given in this middle range to assess the patient response [17].
Simulator design
Because no commercial simulators currently include dynamic predictors like PPV, we developed one to test the closed-loop algorithm. The design and validation of the simulator is included in Additional file 1. The software was run on a PC during these studies, with simulated patient data displayed on the PC monitor and the partici-pants interacting through the mouse and keyboard.
Participants were able to control infusions (crystalloids or colloids) and administer ephedrine, phenylephrine, epi-nephrine, or fentanyl. As ventilator parameters (mode, rate, tidal volume) were not of specific interest for this study, they were excluded from the participant controls. All the numeric parameters available to the LIR algorithm (HR, MAP, CO, and PPV), in addition to others (SBP, DBP, SPO2, CO2), were shown on the participants’
moni-tor during the simulation. Blood products were not avail-able for infusion; LIR was not designed to determine the appropriate fluid to administer (this would be at the dis-cretion of the supervising physician), but only the appro-priate volumes. As such, the decision was made to allow only crystalloids and colloids to keep the participant and LIR conditions comparable.
Study protocol
As stated, the goals of this preliminary study were to (a) to evaluate the performance of LIR in simulated hemorrhage scenarios, (b) to compare fluid management by LIR with standard fluid management by practitioners in those
scenarios, and (c) specifically to test the controller in the absence of highly accurate PPV data. These objectives were split into phases and are detailed in Table 1 for reference.
Phase 1: Basic evaluation of the controller in hemorrhage scenarios
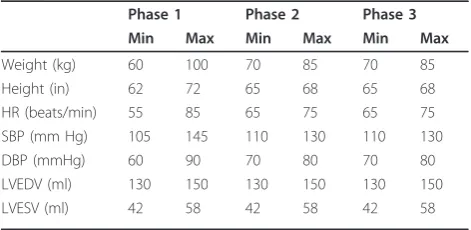
The first phase evaluated the basic efficacy of the control-ler and its ability to manage fluids during hemorrhage scenarios. The simulator was run on one PC with vital signs (HR, systolic and diastolic blood pressure, CO, and PPV) being recorded over the network by a separate PC running the LIR algorithm. Interventions (in the form of fluid boluses) were communicated back to the simulator over the network. Three simulation scenarios were run during this phase: (a) mild hemorrhage of 500 ml over a 1.5-hour period; (b) moderate hemorrhage of 1,500 ml over a 1.5-hour period, and (c) massive hemorrhage of 2,000 ml over a 20-minute period. Patient height, weight, baseline HR, and baseline SBP/DBP were randomized within preset ranges (Table 2) In each scenario, bleeding began 30 minutes after the start of the simulation, and the scenario ran for 2.5 hours before finishing. For each scenario, two management groups were tested; 20 trials were performed with no hemodynamic management (to demonstrate the effects of the simulated hemorrhage sce-narios on hemodynamic parameters), and 20 additional trials received crystalloid infusions managed by the LIR algorithm. Both groups received a steady infusion rate of 200 ml/hr of crystalloid.
% CO Increase from
500ml fluid as Predicted
by Model and Patient
Adaptive Layers
16-20%
No changes; test 250 ml bolus
if never attempted or if SV is
lower than recent trend
< 8%
Halt any active infusion, no
action
Start infusion of 250 ml over
10 minutes, or continue active
infusion
8-15%
>= 20%
Start infusion of 500 ml over
10 minutes, or make active
one faster
[image:3.595.62.538.88.312.2]Phase 2: Closed-loop system versus practitioner management during simulated hemorrhage scenarios
The second phase of testing compared the fluid man-agement of practitioners with that of the LIR algorithm in simulated hemorrhage cases. After IRB exemption was obtained, 20 academic anesthesiologists and resi-dents were asked to manage fluids and medications for a 1-hour simulated case of massive hemorrhage (2,000 ml blood loss over 20 minutes). The subjects were given the following history:
“You are taking over management of an otherwise healthy 40-year-old woman who is having a pelvic tumor debulking. The surgery started 1 hour ago, and anesthetic management has been uncomplicated. Baseline chemistries were within normal ranges, and the starting hematocrit was 39%.”
Subjects were allowed to ask questions, and responses were standardized from a preset list of available informa-tion. Simulator output was presented on the PC graphi-cally similarly to the monitors used in the operating
rooms, showing HR, blood pressure, pulse oximetry, CO, and PPV. The hemorrhage began 15 minutes into the simulation and continued for 20 minutes. Five minutes after the hemorrhage began, the subject managing the scenario was told,“The surgical team tells you they’re losing a lot of blood.”Five minutes after the hemorrhage ended, they were told that the bleeding seemed to be under control. The practitioners could give crystalloid, ephedrine, 10 mg, phenylephrine, 100 mg, or fentanyl, 50
μg, during the management of the simulated patient. One week later, the subjects repeated the simulation, but this time the rate of crystalloid infusion was secretly managed by the closed-loop system while practitioner fluid admin-istrations were ignored and only the medications affected the simulator. The simulation was also run 20 times with only LIR managing crystalloids and 20 times with no management. The same clinical scenario was run for each practitioner, and the baseline characteristics of the simulated patient were again randomized by the compu-ter within a small range of preset paramecompu-ters (Table 2). The range of randomization was narrowed for this phase so that differences in management would be highlighted, as opposed to differences in the simulation.
Phase 3: Testing the controller’s dependence on accurate PPV
For the third phase of testing, the simulator was modi-fied such that PPV was no longer as accurate a predictor of fluid responsiveness. Four conditions were run during this phase of testing:
1. Accurate PPV: the PPV was perfectly predictive of the response to fluid;
2. Biased PPV: the PPV value was constantly biased ± 5% (absolute value) from the true value throughout the entire scenario;
[image:4.595.57.544.99.277.2]3. Fluctuating PPV: the PPV value fluctuated randomly from ± 5% (absolute value) of the true value at random during the scenario; and
Table 1 Study phases and groups
Phase Scenario(s) PPV condition Management
Phase 1: Testing of Massive hemorrhage Accurate PPV No management stability
(2.5-hour simulation)
Moderate hemorrhage LIR management
Mild hemorrhage
Phase 2: Comparison with Massive hemorrhage Accurate PPV No management practitioner management
(1-hour simulation)
Practitioner management
Practitioner meds/LIR Management LIR management
Phase 3: noise and artifact Mild hemorrhage Accurate LIR management tolerance
(2-hour simulation)
Biased
Fluctuating
biased and fluctuating
LIR, Learning Intravenous Resuscitator; PPV, pulse-pressure variation.
Table 2 Baseline parameter ranges for study phases
Phase 1 Phase 2 Phase 3 Min Max Min Max Min Max Weight (kg) 60 100 70 85 70 85
Height (in) 62 72 65 68 65 68
HR (beats/min) 55 85 65 75 65 75 SBP (mm Hg) 105 145 110 130 110 130
DBP (mmHg) 60 90 70 80 70 80
LVEDV (ml) 130 150 130 150 130 150
LVESV (ml) 42 58 42 58 42 58
[image:4.595.56.292.590.705.2]4. Biased and fluctuating PPV: the PPV had both a steady bias within ± 5% (absolute value) and an addi-tional fluctuating component of ± 5% (absolute value). Thus, in the final condition, the PPV reported by the simulator may have been up 10% different from the true value; a“true”PPV of 15% might have been reported as anywhere from 5% to 25%). The closed loop was then used to manage crystalloid infusions for a 2-hour, 1,000-ml blood-loss scenario under each of these four condi-tions, with bleeding starting 30 minutes into the simula-tion. A longer and slower hemorrhage scenario than was used in Phase 2 was intentionally simulated for this phase to accentuate the differences in the accuracy of the PPV across groups; a massive hemorrhage might have hidden small differences.
Statistical analysis
Data are presented as mean ± SD. For Phase 1, data between the no intervention group and the LIR manage-ment group were compared by using a Mann-Whitney test. For Phases 2 and 3, data were compared by using analysis of variance for repeated measurements (ANOVA). If significant differences were found,post hoc testing was performed by using Tukey’s honest significant difference. APvalue < 0.05 was considered statistically significant. All statistic analysis was performed by using SPSS 13.0 for Windows, SPSS, Chicago, IL, USA.
Results
Phase 1
Basic evaluation of the controller in hemorrhage scenarios
Mean CO, HR, and blood pressure were similar across groups at baseline (6.5 ± 1.1 L/min, 71 ± 9 beats/min, and 90 ± 8 mm Hg, respectively). In the massive hemorrhage
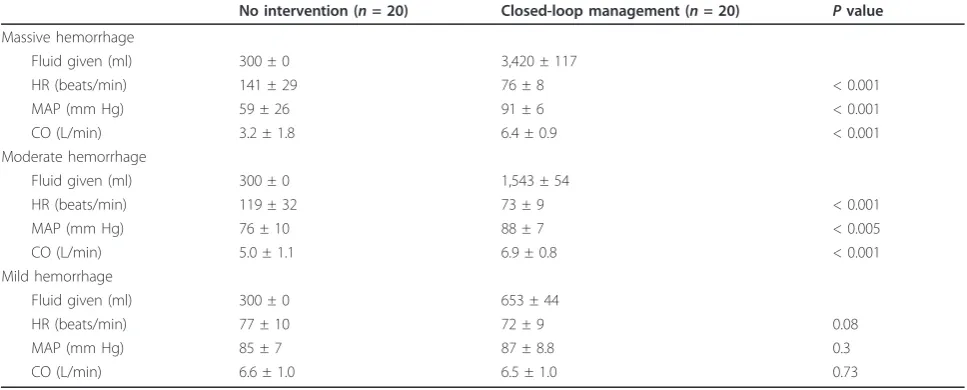
scenario, a significant difference was noted between the unmanaged and the closed-loop managed conditions in HR, MAP, and CO throughout the case and at the end of the simulation (Table 3). Likewise, in the moderate-hemorrhage scenario, a significant difference was found between the unmanaged and the closed-loop managed groups in HR, MAP, and CO throughout the case and at the end of the simulation (Table 3). No significant differ-ence existed between management groups in the mild-hemorrhage scenario (Table 3). The closed-loop adminis-tered fluid before clinical evidence of hemorrhage was apparent from CO, HR, or MAP. In the massive-hemor-rhage scenario, for example, the average time to show a 10% decrease from baseline CO and MAP was 14 ± 4 min-utes and 16 ± 3 minmin-utes, respectively, from the start of the hemorrhage, and HR increased to 10% over baseline at 13 ± 3 minutes. LIR, meanwhile, began administering fluid on average at 7 ± 2 minutes. PPV was the earliest indicator of hemorrhage, increasing to 10% within 7 ± 2 minutes and 15% within 8 ± 2 minutes in this scenario.
Phase 2
Closed-loop system versus practitioner management during simulated-hemorrhage scenarios
[image:5.595.56.540.528.723.2]Eleven residents and nine attending anesthesiologists participated in the simulation. The residents were PGY-2 to PGY-4, aged PGY-28 to 34 years, with seven men and four women. Attendings consisted of five men and four women, and had been practicing a median of 5 years (range, 1 to 15 years). Simulated patient HR, MAP, and CO values were similar at baseline across all four man-agement groups (6.5 ± 0.2 L/min, 68 ± 2 beats/min, and 85 ± 2 mm Hg, respectively). Once the hemorrhage began, the LIR-managed groups intervened significantly
Table 3 Final hemodynamic parameters in Phase 1 groups
No intervention (n= 20) Closed-loop management (n= 20) Pvalue Massive hemorrhage
Fluid given (ml) 300 ± 0 3,420 ± 117
HR (beats/min) 141 ± 29 76 ± 8 < 0.001
MAP (mm Hg) 59 ± 26 91 ± 6 < 0.001
CO (L/min) 3.2 ± 1.8 6.4 ± 0.9 < 0.001
Moderate hemorrhage
Fluid given (ml) 300 ± 0 1,543 ± 54
HR (beats/min) 119 ± 32 73 ± 9 < 0.001
MAP (mm Hg) 76 ± 10 88 ± 7 < 0.005
CO (L/min) 5.0 ± 1.1 6.9 ± 0.8 < 0.001
Mild hemorrhage
Fluid given (ml) 300 ± 0 653 ± 44
HR (beats/min) 77 ± 10 72 ± 9 0.08
MAP (mm Hg) 85 ± 7 87 ± 8.8 0.3
CO (L/min) 6.6 ± 1.0 6.5 ± 1.0 0.73
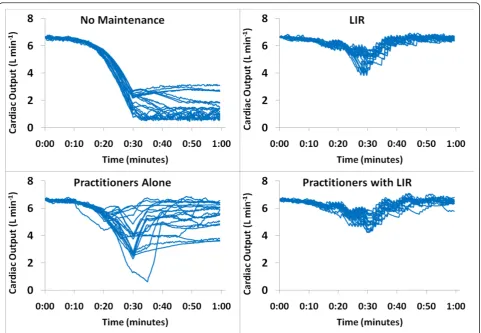
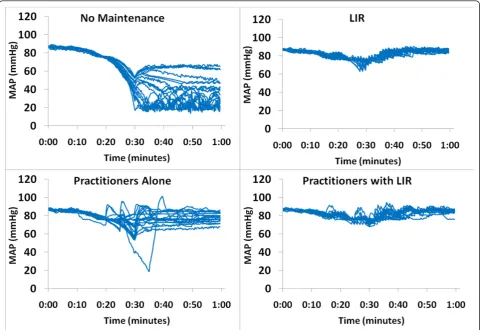
earlier than the practitioner group and gave more total fluid (Table 4). The mean, minimum, and final CO values were higher in both LIR-managed groups than in the practitioners group (Figure 2), and the coefficient of variance was lower (Table 4 and Figure 2). No difference in MAP was found between intervention groups, but all were significantly higher than the unmanaged group
[image:6.595.56.538.100.227.2](Figure 3). No significant difference appeared between attending and resident performance in final CO, HR, or MAP values in the practitioner-management group (4.5 ± 1.2 L/min, 95 ± 13 beats/min, and 76 ± 10 mm Hg for attendings, and 4.9 ± 1.7 L/min, 91 ± 28 beats/min, and 75 ± 19 mm Hg for residents). Finally, a significant reduction in vasopressor use was noted in the
Table 4 Fluid management: anesthesiologists versus closed loop
No
management (1)
Anesthesiologist managed (2)
Anesthesiologist, pressors; closed-loop, fluids (3)
Closed-loop managed (4) Time window until the application of first bolus from
start of hemorrhage (min)
- 21.5 ± 5.6a 15.6 ± 1.1 16.0 ± 1.3
Total fluid given (ml) - 1,968 + 644a 2,875 ± 275 2,675 ± 244
Mean arterial pressure (mm Hg) 61 ± 6.9 76 ± 4.2 79 ± 2.0 79 + 1.1 Mean cardiac output (L/min) 3.8 ± 0.4 5.2 ± 0.6a 5.8 ± 0.2b 5.9 ± 0.2b Minimum cardiac output (L/min) 1.4 ± 0.8 3.6 ± 1.3a 4.8 ± 0.5b 4.8 ± 0.4b
Final cardiac output (L/min) 1.7 ± 0.9 4.8 ± 1.5a 5.6 ± 0.5b 5.7 ± 0.4b
Cardiac output during case, coefficient of variance (%) 89 ± 29 36.7 ± 23a 16.6 ± 9b 16.3 ± 8b
n= 20 in each group. Data are reported as mean ± standard deviation.aP
< 0.05 versus groups 2, 3, and 4.bP
< 0.05 versus groups 1 and 4.
[image:6.595.58.540.348.681.2]Practitioners with LIR group versus the Practitioners group (Table 5).
Phase 3. Testing the controller’s dependence on accurate PPV
Baseline CO, HR, and MAP values across all trial condi-tions were similar at baseline in this phase (6.6 ± 0.4 L/ min, 70 ± 1 beats/min, and 87 ± 2 mm Hg, respectively). No significant difference was found in mean, minimum, or final CO across PPV conditions, regardless of the type
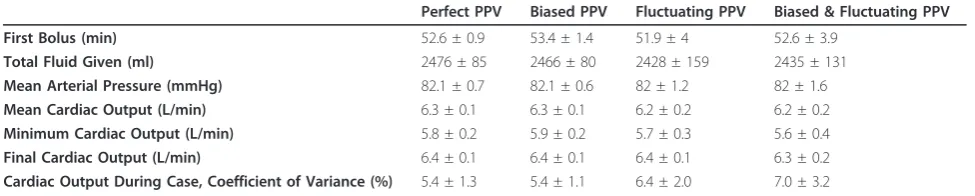
of artifact induced in the PPV signal (Table 6). Time to first fluid bolus and total volume infused were likewise nonsignificant. Although the coefficient of variance of the CO during the case did increase from 5.4% ± 1.3% in the perfect PPV condition to 7.0% ± 3.2% in the biased and fluctuating PPV condition, this difference was also not significant (P= 0.06).
Discussion
As simulation studies are a standard step in the testing of new controllers [10-15], these data represent the first step in the development of an automated fluid-manage-ment system for clinical use. Overall, the results suggest that (a) the LIR algorithm is capable of performing fluid resuscitations, at least in simulation; (b) the controller performs comparably to practitioners in this setting and maintains a higher and more stable CO; and (c) the controller is not dependent on a highly predictive PPV value to function.
[image:7.595.58.540.89.419.2]The first phase of our simulation study was to show that LIR is capable of adequately resuscitating patients
Table 5 Ephedrine and phenylephrine use in Phase 2 of the study
Ephedrine (mg) Phenylephrine (μg) No management 0 ± 0 0 ± 0
LIR alone 0 ± 0 0 ± 0
Practitioners alone 0 ± 0 100 ± 132a Practitioners with LIR 0.3 ± 1.1b 40 ± 94b
Data are presented as mean ± SD. aP< 0.05 for practitioners alone versus LIR alone.b
[image:7.595.56.291.641.707.2]P< 0.05 for practitioners with LIR versus practitioners alone. LIR, Learning Intravenous Resuscitator.
during blood-loss scenarios. Although it was perhaps not surprising that the controller was superior to a low-rate steady crystalloid infusion, this was nevertheless an essential step in the development of the algorithm. One of the key results of this phase is the low standard deviation of the fluid infusions within scenarios; although this is not an engineering test of stability, this suggests at the minimum, consistency of the algorithm in its management. Another important observation from this portion of the study is that LIR did notover -resus-citate; the controller stopped administering fluid when the CO began to level off.
In comparison to practitioners in the second phase of the study, LIR detected the need for resuscitation earlier and was more consistent in management. Some indivi-dual practitioners maintained CO in the same range that LIR did throughout the case, but a huge interpracti-tioner variability occurred (Figure 2). This is one of the biggest offerings of closed-loop management: reduction of interpersonal variability and bias in management. Another interesting observation from this phase of the study is that whereas the differences in CO were signifi-cant, the differences in MAP between practitioner and LIR groups were not (Figure 3). Still a larger variability in MAP was noted in the practitioner group, but overall, the clinicians maintained MAP closer to baseline than CO. This is consistent with the historical trend in clini-cal management to focus on blood pressure in hemody-namic management, although evidence now suggests that CO and oxygen delivery should also be central to management.
Although no significant difference was found between attendings and residents in hemodynamic parameters, this study was not designed to look for such differences and was not sufficiently powered toward that end. Inter-estingly, however, although the means were similar between the two subgroups, the standard deviations for HR, MAP, and CO were much wider in the resident management subgroup versus the attending manage-ment subgroup. One would expect that the lesser level of expertise of the resident subgroup might lead to greater variation in management.
Finally, a reduction in vasopressor use by practitioners occurred when LIR was managing fluids (although the practitioners did not know that the closed-loop was actually in use) (Table 5). Interestingly, phenylephrine was chosen almost exclusively over ephedrine during this simulation by the practitioners, despite their having access to both agents at all times. This is just a conjec-ture, but it seems likely that practitioners chose pheny-lephrine because the heart rate was already elevated because of hemorrhage when vasopressors were being given.
The final phase of the study demonstrates that LIR is not completely dependent on a highly predictive PPV value to function effectively. In the tests, the greater the uncertainty introduced, the larger the variance in manage-ment becomes, but even when the PPV value was off by up to 10% of the true value, the resulting difference in fluid given was less than 75 ml per hour, and represented less than 5% of the total volume administered (Table 4). If closed-loop systems are to be deployed in clinical use, they must be equipped to handle noise, artifact, and the uncer-tainty present in all clinical work and still operate safely and effectively, and although the controller will certainly need more-definitive tests of robustness, this is a reassur-ing early result. However, limitations to the use of dynamic parameters of fluid responsiveness will still have to be respected (limitations include spontaneous ventila-tion, low tidal volume equal to or less than 7 ml/kg, arrhythmia, open-chest procedures, and HR/respiratory rate ratio < 3.6). For this reason, the LIR algorithm is also designed for conducting stroke-volume optimization alone when PPV and SVV are not available [18] and, inversely, to conduct PPV or SVV minimization when stroke volume is not monitored [6]. However, the present study does not test these features, and these results cannot be extrapo-lated. The same kind of study testing the ability of LIR to handle noise or artifacts for stroke-volume maximization alone or PPV/SVV minimization alone is warranted.
[image:8.595.55.543.101.199.2]The same patient database was used in the design of both the LIR algorithm and the PPV portion of the simulator with which it was tested, possibly creating a bias that favored the performance of the algorithm. This
Table 6 Closed-Loop Fluid Management - Uncertain PPV Conditions
Perfect PPV Biased PPV Fluctuating PPV Biased & Fluctuating PPV First Bolus (min) 52.6 ± 0.9 53.4 ± 1.4 51.9 ± 4 52.6 ± 3.9
Total Fluid Given (ml) 2476 ± 85 2466 ± 80 2428 ± 159 2435 ± 131 Mean Arterial Pressure (mmHg) 82.1 ± 0.7 82.1 ± 0.6 82 ± 1.2 82 ± 1.6 Mean Cardiac Output (L/min) 6.3 ± 0.1 6.3 ± 0.1 6.2 ± 0.2 6.2 ± 0.2 Minimum Cardiac Output (L/min) 5.8 ± 0.2 5.9 ± 0.2 5.7 ± 0.3 5.6 ± 0.4 Final Cardiac Output (L/min) 6.4 ± 0.1 6.4 ± 0.1 6.4 ± 0.1 6.3 ± 0.2 Cardiac Output During Case, Coefficient of Variance (%) 5.4 ± 1.3 5.4 ± 1.1 6.4 ± 2.0 7.0 ± 3.2
is a valid concern, but one that was both unavoidable and in part addressed in the third phase of the study. This was unavoidable because both the algorithm and the simulator were designed, to the best of the authors’ skill, by using the best available information on how PPV predicts response to fluid in human subjects (see Additional file 1). Because of this, and regardless of how it had actually been accomplished, the systems would have been built by using the same underlying principles governing the dynamic predictors or else, by definition, one (or both) would have included inferior operational information. In this case, the most extensive information available was the data set collected by Cannessonet al. [16]. The caveat, of course, is that if the data are erro-neous, the closed loop may nevertheless function in the artificial simulation environment because it is partially based on those same data. The third phase of the study was intended in part to examine this possible bias in the design by making the reported PPV an imprecise predic-tor to see what impact, if any, this had on the LIR algo-rithm. As demonstrated, the controller continues to function even when PPV varies widely from the “true” value generated from the incorporation of the database into the simulator. Although this suggests that the appropriate operation of LIR is not dependent on the included PPV dataset alone, only further study indepen-dent of the simulator will adequately address this concern.
Good evidence indicates that maximizing SV in the perioperative period will reduce complications and improve outcomes for moderate- to high-risk surgical patients [19-24]. Thermodilution with a pulmonary artery catheter remains the clinical standard, but alter-native CO monitoring devices (like esophageal Doppler) have also been used to guide therapy with positive effects [25]. With the proliferation of noninvasive and minimally invasive CO devices in recent years, goal-directed CO monitoring is readily achievable in a broad patient population. Hemodynamic management of this type requires frequent interventions, protocol-driven decision making, and high levels of attention to be effec-tive and repeatable. Given these requirements, it may be difficult to gain acceptance for standardized protocols. The more complex a protocol becomes, the harder it is to implement correctly and consistently, and even in the best of cases, errors in implementation are common because of care-provider time constraints [26]. Addition-ally, health care providers work in an environment full of distractions [27] and are susceptible to fatigue, lapses in attention, and stress, all of which can have a negative impact on work performance [28]. Furthermore, studies have shown that when management protocols are imple-mented in clinical care, adherence rates are only 40% to 50%, and this remains true across a variety of disciplines
from ICU glucose control to trauma assessment and even outpatient screening guidelines [26,29-32].
Closed-loop systems are a bridge across this imple-mentation gap, allowing the closed loop to perform the often tedious tasks of the protocols and intervening when needed, which then allows clinical care providers to focus on other aspects of management. Moreover, the closed loop is not susceptible to distraction, fatigue, or personal bias. This means that a clinical protocol or algorithm can be followed exactly and improved on over time. Once a closed loop is shown to be effective in management of a given clinical scenario, it can be used repeatedly and will produce consistent results in that scenario.
A great deal of automation is already being integrated into clinical care. Closed-loop ventilators that adapt breath-to-breath in response to changes in oxygenation and lung compliance are commonplace in modern ICUs [3,33]. Insulin therapy systems are being actively investi-gated for both inpatient and outpatient use [34]. A closed-loop propofol and remifentanil administration system based on BIS (processed EEG) was recently reported on in a large clinical trial [35]. Closed loops like these are demonstrating the possible uses and bene-fits of automation in medicine.
Study limitations
Although the LIR algorithm proved effective in manage-ment of the simulated hemorrhage scenarios, some lim-itations exist with the current study. First, the simulator was designed with as accurate a hemodynamic model as possible, given the current understanding of the dynamic predictors of fluid responsiveness, but generali-zations about the possible efficacy of this controller in clinical practice would be premature based on this initial work. In terms of the algorithm design, the controller has not been rigorously studied for stability and robust-ness from an engineering standpoint and will need this testing before clinical studies can commence. The patient database used to seed the population-based algo-rithm is our own, which may limit applicability. Finally, the third phase of our study (in which the tolerance of the algorithm for error in the PPV signal was examined) suggests that the algorithm will still function well in the face of moderate levels of noise and error, but whether this is sufficient to tolerate the noise and uncertainty actually present in clinical monitoring of patients remains to be tested.
practice. Only further testing and clinical trials can ade-quately address this issue.
Additionally, the decision specifically to exclude blood-product administration may have limited the application of these simulation results to real-world hemorrhage and resuscitation. As previously mentioned, LIR was designed to determine the appropriate volumes for resuscitation, but not the appropriate fluid to give in a particular situation. This decision would be left to the supervising physician, who could hang any fluids or pro-ducts desired and allow the algorithm to determine the rate and timings of administrations. As this was not a part of the algorithm, we sought to limit the study to the question of volumetric appropriateness only by removing the option of blood products from both groups. A system like LIR would never be deployed in the absence of some form of direct supervision for exactly this reason. The supervising physician would need to determine when blood products were needed; otherwise, in a slow but steady hemorrhage, the control-ler would continue to give fluids to maintain intravascu-lar volume until the patient died of anemia. A supervising physician would recognize the need for pro-ducts and could hang them instead of a fluid bag when appropriate. An“anemia risk”alarm could be integrated that tracked parameters like volume given, time span, and patient weight, but this would only be an adjunct to supervision. Moreover, the ongoing development and improvement of continuous, noninvasive hemoglobin sensors represents another possible safety feature and enhancement for future integration [36].
Because of the nature of the scenarios, we limited the patient parameter randomization process in the simula-tor to narrower ranges than might be found in the real patient population. The reason for this was to keep the scenarios more consistent in their evolution (for exam-ple, a 2,000-ml blood loss would have been catastrophic in a 45-kg patient versus a 100-kg patient). This kept the scenarios more consistent across trials, but the restricted range may limit applicability of the efficacy of the LIR algorithm to a large and variable patient population.
Finally, this study did not seek to answer a host of questions regarding this system. For example, how would the system cope with a significant change in patient condition like the onset of atrial fibrillation, or a change from volume control to assisted or spontaneous ventilation? What about a new-onset myocardial infarc-tion? The LIR algorithm was designed to detect when patient responses are not matched by expectations, especially when a sudden change in responses or overall patient condition occurs, and adjust future interventions accordingly, but clearly this is out of the scope of the current study and requires much more testing. Further
studies testing the ability of the system to work by using SV optimization alone or PPV/SVV optimization alone are needed.
Conclusion
The current study demonstrates that the LIR algorithm effectively resuscitates simulated patients in the tested scenarios and significantly improved physician manage-ment in the second phase of the study. Future studies will focus on the stability of the controller and testing in a broader range of scenarios, including in other simulators.
Key Messages
•This study is the first to describe an automated system for hemodynamic optimization based on car-diac output and pulse-pressure variation optimiza-tion. These data demonstrate that the learning intravenous resuscitator (LIR) is an effective volu-metric resuscitator in simulated hemorrhage scenar-ios and improved physician management.
• The controller performs comparably to practi-tioners in this setting and maintains a higher and more stable cardiac output
•The controller is not dependent on a highly pre-dictive pulse-pressure variation value to function •This system is designed to optimize hemodynamics based on pulse-pressure variation and/or stroke-volume variation and/or stroke stroke-volume alone •Engineering testing and simulation studies are the first required steps before any testing of a closed-loop system in a living system
Additional material
Additional file 1: Hemodynamic Simulator Design. This document describes how the hemodynamic simulator was design. It provides an in-depth description of the mathematical and physiological models used to build the hemodynamic simulator used in the present study.
Abbreviations
CO: cardiac output; DBP: diastolic blood pressure HR: heart rate; LIR: Learning Intravenous Resuscitator; MAP: mean arterial pressure;ΔPOP: respiratory variations in the plethysmographic waveform amplitude; PPV: pulse-pressure variation; SBP: systolic blood pressure; SVV: stroke-volume variation.
Acknowledgements
We thank residents and attendings from the Department of Anesthesiology and Perioperative Care at the University of California Irvine for their participation in the simulation study. This work was solely funded by the Department of Anesthesiology and Perioperative Care at the University of California Irvine.
Author details
1Department of Anesthesiology & Perioperative Care, University of California,
Pitié-Salpêtrière, Paris, France.3Centre for Statistics in Medicine, Wolfson
College, University of Oxford, Oxford, UK.4Institute of Anesthesiology and
Intensive Care Medicine, Triemli City Hospital, Zurich, Switzerland.
5Department of Anesthesiology and Critical Care Medicine, Centre
Hospitalier Universitaire de Lille, Lille, France.
Authors’contributions
JR designed the controller and the simulator, designed the study, collected and analyzed the data, drafted the manuscript, and gave final approval of the manuscript. BA designed the controller and the simulator, drafted the manuscript, and gave final approval of the manuscript. YLM, CH, BT, and ZNK participated in data analysis and interpretation, drafted the manuscript, and gave final approval of the manuscript. MC designed the controller and the simulator, designed and coordinated the study, analyzed the data, drafted the manuscript, and gave final approval of the manuscript.
Competing interests
Maxime Cannesson and Joseph Rinehart are co-inventors and co-owners of US patent serial no. 61/432,081 for a closed-loop fluid-administration system based on the dynamic predictors of fluid responsiveness. Maxime Cannesson is a consultant for Edwards LifeSciences (Irvine, CA, USA), Covidien (Boulder, CO, USA), Masimo Corp. (Irvine, CA, USA), ConMed (Irvine, CA, USA), Philips Medical System (Suresnes, France), CNsystem (Vienna, Austria), BMeye (Amsterdam, Netherlands), and Fresenius Kabi (Sèvres, France). Yannick Le Manach is a consultant for Air Liquide Santé (Paris, France) and received lectures/travel fees from Masimo Corp. (Irvine, CA, USA) and Fresenius Kabi (Sèvres, France). Chris Hofer is a consultant for Pulsion Medical Systems (Munchen, Germany), Edwards LifeSciences (Irvine, CA, USA), CSL Behring (King of Prussia, PA, USA). Benoit Tavernier received lectures/travel fees from Masimo Corp. (Irvine, CA, USA) and Fresenius Kabi (Sèvres, France).
Received: 3 September 2011 Revised: 9 September 2011 Accepted: 23 November 2011 Published: 23 November 2011
References
1. Van Herpe T, De Moor B, Van den Berghe G:Towards closed-loop glycaemic control.Best Pract Res Clin Anaesthesiol2009,23:69-80. 2. Hemmerling TM:Automated anesthesia.Curr Opin Anaesthesiol2009,
22:757-763.
3. Wysocki M, Brunner JX:Closed-loop ventilation: an emerging standard of care?Crit Care Clin2007,23:223-240, ix.
4. Marik PE, Baram M, Vahid B:Does central venous pressure predict fluid responsiveness? a systematic review of the literature and the tale of seven mares.Chest2008,134:172-178.
5. Rinehart J, Liu N, Alexander B, Cannesson M:Closed loop systems in anesthesia: is there a potential for closed loop fluid management and hemodynamic optimization?Anesth Analges2012,114:130-143. 6. Cannesson M:Arterial pressure variation and goal-directed fluid therapy.
J Cardiothorac Vasc Anesth2010,24:487-497.
7. Forget P, Lois F, de Kock M:Goal-directed fluid management based on the pulse oximeter-derived pleth variability index reduces lactate levels and improves fluid management.Anesth Analg2010,111:910-914. 8. Benes J, Chytra I, Altmann P, Hluchy M, Kasal E, Svitak R, Pradl R, Stepan M:
Intraoperative fluid optimization using stroke volume variation in high risk surgical patients: results of prospective randomized study.Crit Care
2010,14:R118.
9. Lopes MR, Oliveira MA, Pereira VO, Lemos IP, Auler JO Jr, Michard F: Goal-directed fluid management based on pulse pressure variation monitoring during high-risk surgery: a pilot randomized controlled trial. Crit Care2007,11:R100.
10. Kamath S, George VI, Vidyasagar S:Simulation study on closed loop control algorithm of type 1 diabetes mellitus patients.Iete J Res2009,
55:230-235.
11. De Smet T, Struys MMRF, Greenwald S, Mortier EP, Shafer SL:Estimation of optimal modeling weights for a bayesian-based closed-loop system for propofol administration using the bispectral index as a controlled variable: a simulation study.Anesthes Analges2007,105:1629-1638. 12. Struys MMRF, De Smet T, Greenwald S, Absalom AR, Binge S, Mortier EP:
Performance evaluation of two published closed-loop control systems using bispectral index monitoring: a simulation study.Anesthesiology
2004,100:640-647.
13. Chassin LJ, Hovorka R:Closed-loop glucose control with IV glucose sampling and SC insulin infusion: evaluation by simulation studies. Diabetologia2001,44:A58-A58.
14. Trajanoski Z, Regittnig W, Wach P:Neural predictive controller for closed-loop control of glucose using the subcutaneous route: a simulation study.Control Eng Pract1997,5:1727-1730.
15. Linkens DA, Abbod MF, Backory JK:Closed-loop control of depth of anaesthesia: a simulation study using auditory evoked responses.Control Eng Pract1997,5:1717-1726.
16. Cannesson M, Le Manach Y, Hofer CK, Goarin JP, Lehot JJ, Vallet B, Tavernier B:Assessing the diagnostic accuracy of pulse pressure variations for the prediction of fluid responsiveness: a“gray zone” approach.Anesthesiology2011,115:231-241.
17. Pinsky MR, Payen D:Functional hemodynamic monitoring.Crit Care2005,
9:566-572.
18. Maguire S, Rinehart J, Vakharia S, Cannesson M:Respiratory variation in pulse pressure and plethysmographic waveforms: intraoperative applicability in a North American academic center.Anesth Analg2010,
112:94-96.
19. Gan TJ, Soppitt A, Maroof M, el-Moalem H, Robertson KM, Moretti E, Dwane P, Glass PS:Goal-directed intraoperative fluid administration reduces length of hospital stay after major surgery.Anesthesiology2002,
97:820-826.
20. Pearse R, Dawson D, Fawcett J, Rhodes A, Grounds RM, Bennet ED:Early goal-directed therapy after major surgery reduces complications and duration of hospital stay: a randomised, controlled trial
[ISRCTN38797445].Crit Care2005,9:R687-R693.
21. Wakeling HG, McFall MR, Jenkins CS, Woods WG, Miles WF, Barclay GR, Fleming SC:Intraoperative oesophageal Doppler guided fluid management shortens postoperative hospital stay after major bowel surgery.Br J Anaesth2005,95:634-642.
22. Mayer J, Boldt J, Mengistu AM, Rohm KD, Suttner S:Goal-directed intraoperative therapy based on autocalibrated arterial pressure waveform analysis reduces hospital stay in high-risk surgical patients: a randomized, controlled trial.Crit Care2010,14:R18.
23. Rhodes A, Cecconi M, Hamilton M, Poloniecki J, Woods J, Boyd O, Bennett D, Grounds RM:Goal-directed therapy in high-risk surgical patients: a 15-year follow-up study.Intensive Care Med2010,36:1327-1332. 24. Hamilton MA, Cecconi M, Rhodes A:A systematic review and
meta-analysis on the use of preemptive hemodynamic intervention to improve postoperative outcomes in moderate and high-risk surgical patients.Anesth Analg2010,112:1392-1402.
25. Roche AM, Miller TE, Gan TJ:Goal-directed fluid management with trans-oesophageal Doppler.Best Pract Res Clin Anaesthesiol2009,23:327-334. 26. Cyrus RM, Szumita PM, Greenwood BC, Pendergrass ML:Evaluation of
compliance with a paper-based, multiplication-factor, intravenous insulin protocol.Ann Pharmacother2009,43:1413-1418.
27. Healey AN, Sevdalis N, Vincent CA:Measuring intra-operative interference from distraction and interruption observed in the operating theatre. Ergonomics2006,49:589-604.
28. Weinger MB, Englund CE:Ergonomic and human factors affecting anesthetic vigilance and monitoring performance in the operating room environment.Anesthesiology1990,73:995-1021.
29. Spanjersberg WR, Bergs EA, Mushkudiani N, Klimek M, Schipper IB:Protocol compliance and time management in blunt trauma resuscitation.Emerg Med J2009,26:23-27.
30. Freeman BD, Kennedy C, Robertson TE, Coopersmith CM, Schallom M, Sona C, Cracchiolo L, Schuerer DJE, Boyle WA, Buchman TG:Tracheostomy protocol: experience with development and potential utility.Critical Care Med2008,36:1742-1748.
31. Frame PS, Kowulich BA, Llewellyn AM:Improving physician compliance with a health maintenance protocol.J Family Pract1984,19:341-344. 32. Khan AY, Shaikh MR, Ablah E:To examine the extent of compliance to
the proposed monitoring protocol among practicing psychiatrists for second generation antipsychotics.J Pak Med Assoc2010,60:446-450. 33. Branson RD, Johannigman JA, Campbell RS, Davis K Jr:Closed-loop
mechanical ventilation.Respir Care2002,47:427-451, discussion 451-423. 34. Hovorka R, Allen JM, Elleri D, Chassin LJ, Harris J, Xing D, Kollman C,
adolescents with type 1 diabetes: a phase 2 randomised crossover trial. Lancet2010,375:743-751.
35. Liu N, Chazot T, Hamada S, Landais A, Boichut N, Dussaussoy C, Trillat B, Beydon L, Samain E, Sessler DI, Fischler M:Closed-loop coadministration of propofol and remifentanil guided by bispectral index: a randomized multicenter study.Anesth Analg2011,112:546-547.
36. Lamhaut L, Apriotesei R, Combes X, Lejay M, Carli P, Vivien B:Comparison of the accuracy of noninvasive hemoglobin monitoring by
spectrophotometry (SpHb) and HemoCue(R) with automated laboratory hemoglobin measurement.Anesthesiology2011,115:548-554.
doi:10.1186/cc10562
Cite this article as:Rinehartet al.:Evaluation of a novel closed-loop fluid-administration system based on dynamic predictors of fluid responsiveness: anin silicosimulation study.Critical Care201115:R278.
Submit your next manuscript to BioMed Central and take full advantage of:
• Convenient online submission
• Thorough peer review
• No space constraints or color figure charges
• Immediate publication on acceptance
• Inclusion in PubMed, CAS, Scopus and Google Scholar
• Research which is freely available for redistribution