M E T H O D
Open Access
Differential analysis of high-throughput
quantitative genetic interaction data
Gordon J Bean
1and Trey Ideker
1,2,3,4*Abstract
Synthetic genetic arrays have been very effective at measuring genetic interactions in yeast in a high-throughput manner and recently have been expanded to measure quantitative changes in interaction, termed‘differential interactions’, across multiple conditions. Here, we present a strategy that leverages statistical information from the experimental design to produce a novel, quantitative differential interaction score, which performs favorably compared to previous differential scores. We also discuss the added utility of differential genetic-similarity in differential network analysis. Our approach is preferred for differential network analysis, and our implementation, written in MATLAB, can be found at http://chianti.ucsd.edu/~gbean/compute_differential_scores.m.
Background
Genetic interactions are functional dependencies between genes, which become apparent when the phenotypic effect of one mutation is altered by the presence of a second. In model organisms such as yeast, genetic interactions can be rapidly assessed through the systematic construction of double mutants and measurement of quantitative pheno-types such as growth rate. Quantitative interactions may be positive or negative, indicating less or more severe dou-ble mutant phenotypes than expected from the single mutant phenotypes. Many large genetic network maps have been constructed from high-throughput genetic interaction screens in yeast, providing insight into the glo-bal landscape of interactions within the cell as well as the functional relationships between specific components of biological processes and pathways [1-5].
Recently, we used genetic interaction mapping in a ‘differential mode’to compare the changes in genetic net-works across experimental conditions [6-8]. To demon-strate this approach, called differential epistasis mapping, we compared the difference between quantitative genetic interaction scores derived from yeast grown on standard versus DNA-damaging media [6]. We found substantial changes in interaction patterns and demonstrated that the difference in scores was more effective than the scores in either static condition for highlighting interactions relevant
to the pathway under study (DNA damage response (DDR)). Other biological networks, such as protein-protein interaction (PPI) or protein-DNA interaction networks, have also progressed from observing single experimental conditions to comparing the changes in interactions across multiple experimental conditions or genetic backgrounds. For example, Wrana and colleagues [9] developed the LUMIER (luminescence-based mammalian interactome mapping) strategy to identify pairwise PPIs among a set of human factors with and without stimulation by transform-ing growth factorb. Similarly, Workmanet al. [10] used genome-wide chromatin immunoprecipitation to focus on changes in transcription factor binding after exposure to the DNA damaging agent methyl methanesulfonate (MMS). More recently, a quantitative approach has been presented by Bissonet al. [11] for measuring differential interactions in PPI networks. This approach, which the authors call affinity purification-selected reaction monitor-ing (AP-SRM), was used to map quantitative changes in interaction with the protein Grb2, which showed that the composition of Grb2 complexes was remarkably dependent on the stimulation. By focusing on additional hub proteins beyond Grb2, this method is likely to be useful for obtain-ing a global overview of protein network remodelobtain-ing in response to a stimulus.
The progression from static to differential network biol-ogy in many fields increases the need for specialized statis-tical strategies for scoring differential networks. One approach to improving differential signal is to use paired experimental designs that reduce the noise between treated * Correspondence: [email protected]
1
Bioinformatics and Systems Biology Program, University of California, San Diego, 9500 Gilman Drive, Dept. 0419, La Jolla, CA 92093-0419, USA Full list of author information is available at the end of the article
and untreated measurements. For example, experimental designs such as the two-color microarray were originally developed to reduce the noise resulting from technical variability, and various statistical methods have been devel-oped to leverage the paired structure of these experiments (reviewed in [12-15]). Similar to two-color microarrays, dif-ferential network measurements can pair treated and untreated measurements. While some of the differential interaction studies [6,7] have employed such an experi-mental design, they did not utilize this information in their analysis, treating each measurement as independent.
Here, we investigate the statistical structure of two large-scale differential genetic interaction experiments [6,7] and present a generalized strategy for scoring differential genetic interaction data. Our strategy produces differential genetic interaction networks that are more reproducible and more enriched for biologically relevant interactions than previous approaches based on network subtraction. A MATLAB implementation of our strategy is provided as Additional file 1 with the online version of this article.
Results and discussion
The differential interaction model
The format of a differential genetic interaction experiment takes growth-rate measurements for each double mutant
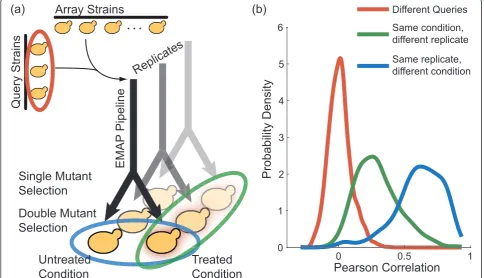
across two or more conditions. A single mutant yeast strain, called the‘query’, is mated with an entire set of other single mutants (for example, deletions of all non-essential yeast genes), referred to as‘array’strains. The resulting diploids are sporulated and then undergo multi-ple selection steps to produce colonies of haploid double deletion mutants. In the last step of the pipeline, the same yeast colonies are replicated onto different media exhibit-ing the chosen growth conditions (Figure 1a; see [3,6,16] for high-throughput genetic interaction screening protocols).
Because one run of this experimental pipeline produces double mutant colonies that are grown in separate condi-tions but share the same initial steps, we had reason to believe that the double mutant growth-rate measurements are not independent. Using data from Bandyopadhyay et al. [6], we tested this hypothesis by comparing the correlation of experimental replicates (that is, colonies generated in separate pipelines but grown in the same condition) with the correlation of colonies generated in the same pipeline but grown in different final conditions. Strikingly, we found that the correlation of colonies grown in different conditions was much greater than the correla-tion of experimental replicates (Figure 1b), even though the experimental replicates were grown under identical
Single Mutant
Selection
Double Mutant
Selection
Replicates
EMAP
Pipeline
Untreated
Condition
Treated
Condition
. . .
Array Strains
Query Strains
2 3 4 5
0 0.5 1
0 1 6
Pearson Correlation
Probability Density
Different Queries Same condition, different replicate
Same replicate, different condition
[image:2.595.56.541.404.682.2](a)
(b)
growth conditions and the conditional replicates were not. This observation suggested some degree of statistical
dependence between the conditional replicate
measurements.
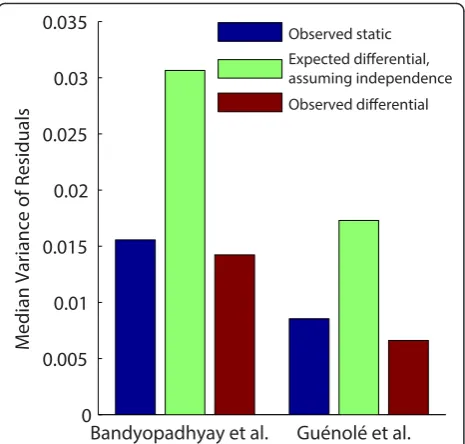
We further assessed the dependence across the condi-tional measurements with an analysis of the variance of replicate measurements. Assuming independence, the difference between two normally distributed random variables is distributed normally, with a variance equal to the sum of the variances of the original distributions (Equation 1):
N(μ1,σ12)−Nμ2,σ22∼N(μ1−μ2,σ12+σ22) (1)
Therefore, for each double mutant, the variance of the differences between the static measurements should be equal to the sum of the variances of the static measurements.
Using the data from two differential interaction mapping experiments comparing MMS and standard growth condi-tions [6,7], we found that the variance of the difference for each double mutant was less than half of the expected dif-ferential variance, and even less than the variance of static (non-differential) measurements (Figure 2). These results confirm that the across-condition measurements are not independent and raise the possibility that significant error reduction may be achieved by the differential mode of analysis.
The dS score: a quantitative measure of differential interaction
Accordingly, we developed a strategy for scoring differ-ential genetic interactions, which accounts for the dependency structure of the data. Assuming a growth constant pfor each plate, which captures plate-to-plate differences in growth rate, the observed double mutant colony sizezqaican be factored as follows:
zqaic=pqic·fqc·fac+∈qaic (2)
whereq andarepresent the query and array strains, i represents the experimental replicate,c represents the condition, findicates the single mutant fitnesses, andÎ represents the residual. Collins et al. [17] developed a strategy that uses colony size population trends to esti-matep,fq, andfaand obtain a measurement of the resi-dual, which serves to quantify the degree of genetic interaction between the query and array mutants.
For differential interactions, the null or ‘ non-interac-tion’model is that the mean of the differences between paired residuals is equal to zero:
n
i
∈qaic− ∈qaic0
n =
n
i
δqaic
n = 0 (3)
where cindicates the treatment and c0 indicates the untreated, or reference, condition, and δrepresents the difference in colony size residuals. Assuming thesÎ are normally distributed, the degree to which this mean dif-fers from zero given the variance of the replicates can be modeled using the paired t-statistic. We call our sta-tistic the dS score,‘d’for‘differential’and‘S score’after the name of the statistic used by Collinset al. [17]:
dS score = δqac
sqac/
√
n (4)
whereδqacis the mean of the differences of the residuals (Equation 3) andsqacis the sample standard deviation of the differences of the residuals. Unlike the S-score [17], we found that the sample variance was the best approxima-tion of the variance (based on the quality control metrics described below) and did not employ a minimum bound or any modifiers or priors (such as in the case of SAM, Cyber-T, or LIMMA in microarray analysis [15,18,19]; see also [20]).
Similarity of differential interaction profiles provides distinct functional information
Previously, it has been shown that the correlation of sta-tic interaction profiles identifies many gene functional relationships not identified by direct genetic interactions (a genetic interaction profile is the set of all interactions with a given gene) [1,17]. Given our new quantitative Bandyopadhyay et al.
0 0.005
0.01 0.015 0.02 0.025 0.03 0.035
Median Variance of Residuals
Observed static Expected differential, assuming independence
Observed differential
[image:3.595.58.291.450.672.2]Guénolé et al.
score for differential interactions, we therefore investi-gated whether differential interaction profiles could also be used to provide distinct functional information. Indeed, we found that the correlation of differential interaction profiles was able to identify relationships relevant to the treatment response and, furthermore, that these links were not identified either by direct interactions (static or differential) or by correlation of static profiles.
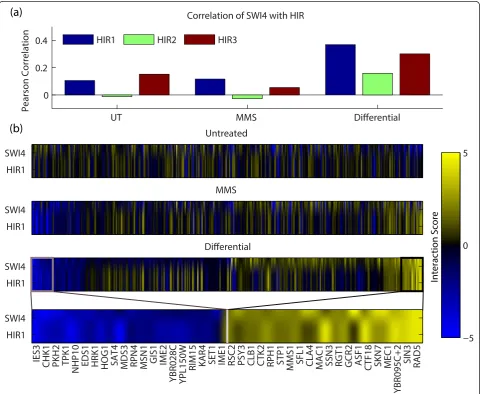
For example, using the dS score, we observed a very high differential similarity score between SWI4 and the subunits of the HIR complex (Figure 3). In contrast, when computing genetic profile similarity between SWI4 and HIR in either static condition (standard or MMS-treated), similarity scores were strikingly low. SWI4 is the DNA-binding member of the SBF complex,
a key regulator of genes involved in DNA synthesis and repair in G1 to S phase [21,22]. HIR1, HIR2, and HIR3 are subunits of the HIR complex that negatively regulate histone protein transcription [23] under control of the DNA-damage checkpoint kinase DUN1 [24]. Although SWI4 and HIR have not been previously implicated in a genetic relationship, SWI4 has been shown to regulate histone gene expression [25,26], suggesting that an interaction between SWI4 and HIR is feasible, especially in context of the DDR. Thus, differential similarity can identify functional relationships between genes that are not apparent from profile similarity analysis in static conditions.
We identified a total of 99 functional associations like SWI4 and HIR, that is, gene pairs with low static similar-ity and high differential similarsimilar-ity (see Additional file 2
Differential
SWI4
HIR1
MMS
SWI4
HIR1
Untreated
SWI4
HIR1
SWI4
HIR1
IES3
CHK1 PKH2 TPK1
NHP10 EDS1 HRK1 HOG1 SAT4 MDS3 RPN4 MSN1 GIS1 IME2
YBR028C YPL150W
RIM15 KAR4 SET1 IME1 RSC2 PSY3 CLB1 CTK2 RPH1 STP1 MMS1 SFL1 CLA4 MAC1 SSN3 RGT1 GCR2 ASF1 CTF18 SKN7 MEC1
Y
BR095C+2
SIN3 RAD5
(a)
(b)
−5 0 5
In
te
rac
tion S
cor
e
UT MMS Differential
0 0.2 0.4
Pearson Correlation
Correlation of SWI4 with HIR
[image:4.595.58.539.299.693.2]HIR1 HIR2 HIR3
for a complete list of gene pairs and their interaction and similarity scores). These gene pairs indicate DDR-relevant interactions that would not be identified through previously available methods. One of the key limitations of static profile similarity is that the static profile is popu-lated by interactions pertaining to both the treatment as well as general cell growth. These non-relevant interac-tions diminish the similarity between genes that other-wise function very similarly in the treatment response. Additionally, the larger variance inherent in the static measurements contributes to noisier interaction profiles, which decreases the similarity of otherwise related pro-files. Differential interactions are effective at identifying treatment-relevant relationships because they cut down the noise and eliminate non-related interactions.
Performance of the dS score and differential profile similarity
We investigated the quality of the dS score by examin-ing its false discovery rate, reproducibility and biological
enrichment. As a baseline for comparison, where applic-able dS scores were compared to the differential P-values described by Bandyopadhyayet al. [6], which indicate an empirically determined significance for the difference in S scores between two conditions. We des-ignate the -log P-values from Bandyopadhyay et al. [6] as the‘B score’. To estimate the false discovery rate of different dS score thresholds, we first generated a dS null distribution using the data from Bandyopadhyay et al. [6], in which the final step involved pinning each double mutant twice in the same condition. These two colonies were paired and scored as if they were colonies grown in separate conditions (corresponding to zqaicand
zqaic0 in Equation 2 above). We observed that the dS
score has approximately symmetric false discovery rates for positive and negative scores (Figure 4a).
Next, we assessed reproducibility of the dS score by comparing B and dS scores generated using replicates 1 to 3 and, separately, 4 to 6 from Guénoléet al. [7]. Using only gene pairs that were scored in both analyses, we
−100 −8 −6 −4 −2 0 2 4 6 8 10
0.2 0.4 0.6 0.8 1
dS score
False Discovery Rate
10−3 10−2 10−1 100
−0.2 0 0.2 0.4 0.6 0.8
Fraction called significant Pearson correlation of significant interactions B scoredS score
−20 0 20 40
−20 −10 0 10 20 30
B score (Reps. 1−3)
B score (Reps. 4−6)
−10 0 10 20 30
−10 0 10 20
dS score (Reps. 1−3)
dS score (Reps. 4−6)
100.5 101 101.5 102 102.5 103 103.5
(a)
[image:5.595.57.540.345.663.2](b)
(c)
(d)
found that the dS score yields a much tighter reproduci-bility across replicates than the B score (Figure 4b-c; Figure S1 in Additional file 3). In particular, the Pearson correlation across replicates was remarkably higher for the dS score than the B score (Figure 4d; the values on the far right correspond to data shown in Figure 4b,c). We found it of particular interest that for the most signif-icant interactions, the dS score tends to greater and greater reproducibility, while the reproducibility of the B score drops to zero, indicating that for larger and larger values, the B score picks up on less and less signal.
To measure the biological enrichment of the dS score, we generated a bronze-standard set of interactions simi-lar to that used by Bandyopadhyayet al. [6]. We included in our standard set any gene pair in which both genes were annotated as‘DNA-damage response’(DDR) in the Gene Ontology [27] (corresponding to 903 or 2,575 gene pairs in the Bandyopadhyayet al. [6] or Guénoléet al. [7] data sets, respectively), as well as any gene pair defined by the YeastNet 2.0 benchmark set [28] containing at least one DDR gene (390 or 772 gene pairs, respectively). As a second standard, we used the set of co-complex interac-tions compiled by Baryshnikovaet al. [29], which is based on the set of macromolecular complexes recorded
in theSaccharomyces Genome Database [30] or in the
CYC2008 protein complex catalogue [31]. Using these two standards, we generated precision-recall plots for two previously published differential interaction networks (Bandyopadhyayet al. [6] and Guénoléet al. [7]). This analysis indicated that the dS score has essentially the same precision for recovering the DDR and the co-complex standards as the originalP-values published by Bandyopadhyayet al. [6] (Figure 5; see also Figures S2 to S4 in Additional file 3). However, we observed a notable improvement in enrichment for DDR interactions when using profile similarity of dS scores compared to profile similarity of B scores (Figure 5a,b).
Additionally, it is well known that gene pairs with high profile similarity are often members of the same physical complexes [32,33], so we investigated whether the same is true for differential-profile similarity. We found that the genes with similar dS score profiles are strikingly more enriched for co-complex pairs (Figure 5c,d), and specifically for protein complexes involved in the DDR (Figure S2 in Additional file 3). For example, differential profile similarity was able to achieve a precision of 60 to 100% for recovering either DDR pathway interactions or protein complexes, using data from either of two studies. This performance was in contrast to that of individual differential interactions, which had a precision of 1 to 20% using these same standards and data.
It is interesting that B score profile similarity is under-enriched for meaningful relationships. Part of this beha-vior may be explained by our observation that extreme
B score values tend to capture noise and are not repro-ducible (Figure 4b-d). Because profile similarity is heav-ily influenced by larger values, B score profile similarity is overly sensitive to noise. Thus, relatively few spurious interactions can have an extensive influence on profile similarity.
We finally compared dS scores and dS profile similar-ity scores to the static S scores and profile similarsimilar-ity scores from the same data. We found that differential similarity scores are more enriched for DDR interactions than static similarity scores, even though static scores are more enriched for non-DDR-specific interactions (Figure S3 in Additional file 3).
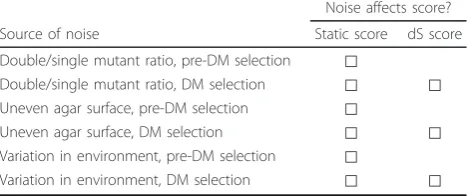
The reasons for the improved performance in identify-ing relevant genetic relationships of the dS score over the B score and the static scores deserve some attention. Genetic interaction mapping experiments are subject to many systematic sources of noise. For example, the ratio of double mutant cells to single mutant cells in the colonies growing on the single-mutant selection plate (see Figure 1 for an outline of the experimental work-flow) affects the observed double mutant fitness in the following step. Other sources of systematic noise include uneven agar surfaces, which affect the quantity of mate-rial that is picked up and deposited during plate pin-ning, and variations in incubation time, humidity, and so on (Table 1). Despite sophisticated data processing methods, traces of these systematic artifacts may be pre-served, and this noise can influence the estimation of interaction effects. The current experimental design for static interaction mapping experiments does not control for these artifacts, and the previous method for scoring differential interactions did not take advantage of built-in controls. However, our approach uses the paired rela-tionships between plates to eliminate many sources of systematic noise, increasing our ability to identify repro-ducible and relevant differential interactions (Figures 1, 2, and 4). This result is of broad interest because finding the appropriate control plays an important part in dif-ferential experimental design in many fields.
Interpretation of the dS score
redundant pathways [34]. The difference between differen-tial and static interpretation is that static scores indicate interactions that affect general cell growth, whereas differ-ential scores indicate interactions that affect the treatment response.
While the theoretical interpretation of the dS score is straightforward, the practical interpretation is more complex because the static interaction scores provide a
context for the interpretation of the dS score. For exam-ple, a gene pair exhibiting a positive interaction in untreated conditions that is more positive in MMS (yielding a positive dS score) should be interpreted dif-ferently than an interaction that is negative in untreated conditions that becomes positive in MMS (also yielding a positive dS score). According to the standard interac-tion model, the latter example is supposedly going from
0 0.1 0.2 0.3 0.4 0.5
0 0.2 0.4 0.6 0.8 1
Precision
Recall (DDR)
B score dS score B score similarity dS score similarity
0 0.1 0.2 0.3 0.4 0.5
0 0.2 0.4 0.6 0.8 1
Precision
Recall (Co−complex)
0 0.1 0.2 0.3 0.4 0.5
0 0.2 0.4 0.6 0.8 1
Precision
Recall (DDR)
0 0.1 0.2 0.3 0.4 0.5
0 0.2 0.4 0.6 0.8 1
Precision
Recall (Co−complex)
(a)
(b)
(c)
(d)
Guénolé et al. Bandyopadhyay et al.
[image:7.595.57.540.89.576.2]Bandyopadhyay et al.
a between-pathway relationship in untreated conditions to a within-pathway relationship in the treatment, which quality the former example does not have, even though both examples exhibit a co-pathway relationship in the DDR response. These various classes of differential interactions exhibit different enrichment rates for our DDR standard (Figure S4 in Additional file 3), suggest-ing that there may be unique qualities to each class, but a more detailed investigation of differential interaction interpretation is left for future work.
Conclusions
Here, we have put forth a quantitative differential interac-tion score, the dS score, based on important statistical information inherent in the experimental design. This score not only provides more information about each interaction than previous approaches, but also shows improved reproducibility and comparable biological enrichment. Additionally, quantitative differential interac-tions give rise to differential interaction profiles, which we demonstrate to be biologically relevant and uniquely insightful. Furthermore, we provide a new interpretation for differential interactions based on the accepted interpre-tation of static genetic interactions. We conclude that our differential interaction score is preferred to the previous approach for differential genetic interaction mapping analysis.
Materials and methods
Correlation of query replicates
We used normalized colony size residuals to calculate the correlation of query replicates (Figure 1b). Our approach to computing these residuals is based on the approach published by Collinset al. [17]. In brief, the raw colony sizes are pre-processed to filter bad colonies and correct spatial artifacts. Each plate (that is, the set of all colony sizes from the same plate) is normalized by the plate mode, calculated using a kernel density estimation method [35]. Next, array single mutant fitnesses are estimated using the median normalized colony size for a given array position across all plates, which are then subtracted from
the respective double mutant colony sizes to yield normal-ized colony size residuals. These residuals are, in turn, used to calculate several quantities: (1) the pair-wise corre-lation for each pair of conditional plate replicates, that is, double mutant selection plates derived from the same sin-gle mutant selection plate differing only in the growth condition; (2) pairwise correlation of untreated experimen-tal replicates; and (3) pairwise correlation of randomly selected queries.
The dS score
Normalized differentials are obtained by subtracting untreated normalized colony sizes from the correspond-ing treated normalized colony sizes. The dS score is then computed as the pooled t-statistic of the six repli-cates for a given double mutant versus all double mutant measurements containing the respective array gene deletion. Note that the S score, for scoring static interactions, employs a minimum bound on the variance of the six double mutant replicates [17], while the dS score does not bound the variance.
Scoring null differential interactions
The null distribution of dS scores was generated by using replicate pairs of measurements grown on the same plate (and therefore same condition) and following the same scoring procedure already described. The differentials for the three replicates in each condition were pooled to pro-duce six total replicates for each gene pair. We computed false discovery rates for each dS score cutoff as the ratio of the proportion of null scores beyond the cutoff to the pro-portion of observed dS scores beyond the cutoff.
Biological enrichment
The‘bronze’standard for differential genetic interactions in response to DNA damage was compiled as (1) the set of all gene pairs in which both genes are annotated as‘DNA damage response’(DDR) in the Gene Ontology [27] (term ID GO:0006974, direct association; accessed December 2011), and (2) the set of all gene pairs indicated by the YeastNet 2.0 benchmark set [28] in which at least one gene is annotated as DDR. The lists of DDR genes and bronze-standard DDR gene pairs are provided as Addi-tional file 4.
The gold standard used for co-complex membership is defined by Baryshnikovaet al. [29]. Precision-recall plots were computed using the absolute value of the dS scores (treating positive and negative interactions equally).
Significance of Pearson correlation
[image:8.595.57.291.114.212.2]To assess the significance of the difference between the correlation coefficients of the scores in Figure 3, we cal-culated the correlation of bootstrapped data for 10,000 iterations in a paired fashion and counted the number of
Table 1 Sources of noise and their effect on interaction scores
Noise affects score?
Source of noise Static score dS score
Double/single mutant ratio, pre-DM selection ⃞
Double/single mutant ratio, DM selection ⃞ ⃞ Uneven agar surface, pre-DM selection ⃞
Uneven agar surface, DM selection ⃞ ⃞
Variation in environment, pre-DM selection ⃞
Variation in environment, DM selection ⃞ ⃞
cases in which the correlation of B scores was greater than the correlation of the dS scores.
Determining associations similar to SWI4-HIR
To identify gene associations similar to SWI4 and HIR, where the differential similarity is high and the static similarity is low, we used the cutoffs of >0.35 and <0.15 for differential and static similarity scores, respectively.
Additional material
Additional file 1: MATLAB implementation of our method.
Additional file 2: A table of the dS, S, and profile similarity scores for the data from Bandyopadhyayet al. [6].
Additional file 3: a PDF containing our additional notes and figures.
Additional file 4: a table indicating the gene pairs used as the DNA damage response bronze standard in our study.
Abbreviations
DDR, DNA-damage response; MMS, methyl methanesulfonate; PPI, protein-protein interaction.
Authors’contributions
GB developed the statistical model and performed the validation and discovery. Both authors read and approved the final manuscript.
Competing interests
The authors declare that they have no competing interests.
Acknowledgements
The authors thank Rohith Srivas, Koyel Mitra, and Philip Jaeger for providing insight and advice. This work was supported by National Institutes of Health grants ES014811 and GM084279 to TI and 5T32GM008666-13 to Bruce Hamilton.
Author details
1Bioinformatics and Systems Biology Program, University of California, San
Diego, 9500 Gilman Drive, Dept. 0419, La Jolla, CA 92093-0419, USA. 2Department of Bioengineering, University of California, San Diego, 9500
Gilman Drive MC 0412, La Jolla, CA 92093-0412, USA.3Institute for Genomic Medicine, University of California, San Diego, 9500 Gilman Drive, 0642, La Jolla, CA 92093, USA.4Department of Medicine, University of California, San Diego, 9500 Gilman Drive, # 0671, La Jolla, CA 92093-0671, USA.
Received: 17 August 2012 Revised: 15 November 2012 Accepted: 26 December 2012 Published: 26 December 2012
References
1. Costanzo M, Baryshnikova A, Bellay J, Kim Y, Spear ED, Sevier CS, Ding H, Koh JLY, Toufighi K, Mostafavi S, Prinz J, St Onge RP, VanderSluis B, Makhnevych T, Vizeacoumar FJ, Alizadeh S, Bahr S, Brost RL, Chen Y, Cokol M, Deshpande R, Li Z, Lin Z-Y, Liang W, Marback M, Paw J, San Luis B-J, Shuteriqi E, Tong AHY, van Dyk N,et al:The genetic landscape of a cell.Science2010,327:425-431.
2. Fiedler D, Braberg H, Mehta M, Chechik G, Cagney G, Mukherjee P, Silva AC, Shales M, Collins SR, van Wageningen S, Kemmeren P, Holstege FCP, Weissman JS, Keogh M-C, Koller D, Shokat KM, Krogan NJ:Functional organization of the S. cerevisiae phosphorylation network.Cell2009,
136:952-963.
3. Schuldiner M, Collins SR, Thompson NJ, Denic V, Bhamidipati A, Punna T, Ihmels J, Andrews B, Boone C, Greenblatt JF, Weissman JS, Krogan NJ:
Exploration of the function and organization of the yeast early secretory pathway through an epistatic miniarray profile.Cell2005,
123:507-519.
4. Collins SR, Miller KM, Maas NL, Roguev A, Fillingham J, Chu CS, Schuldiner M, Gebbia M, Recht J, Shales M, Ding H, Xu H, Han J, Ingvarsdottir K, Cheng B, Andrews B, Boone C, Berger SL, Hieter P, Zhang Z, Brown GW, Ingles CJ, Emili A, Allis CD, Toczyski DP, Weissman JS, Greenblatt JF, Krogan NJ:Functional dissection of protein complexes involved in yeast chromosome biology using a genetic interaction map.
Nature2007,446:806-810.
5. Zheng J, Benschop JJ, Shales M, Kemmeren P, Greenblatt J, Cagney G, Holstege F, Li H, Krogan NJ:Epistatic relationships reveal the functional organization of yeast transcription factors.Mol Systems Biol2010,6:420. 6. Bandyopadhyay S, Mehta M, Kuo D, Sung M-K, Chuang R, Jaehnig EJ,
Bodenmiller B, Licon K, Copeland W, Shales M, Fiedler D, Dutkowski J, Guénolé A, van Attikum H, Shokat KM, Kolodner RD, Huh W-K, Aebersold R, Keogh M-C, Krogan NJ, Ideker T:Rewiring of genetic networks in response to DNA damage.Science2010,330:1385-1389.
7. Guénolé A, Srivas R, Vreeken K, Wang S, Krogan NJ, Ideker T, van Attikum H:
Dissection of DNA damage response pathways using a multi-conditional genetic interaction map. .Mol Cell2012,49:346-358.
8. Ideker T, Krogan NJ:Differential network biology. .Mol Systems Biol2012,
8:1-9.
9. Barrios-Rodiles M, Brown KR, Ozdamar B, Bose R, Liu Z, Donovan RS, Shinjo F, Liu Y, Dembowy J, Taylor IW, Luga V, Przulj N, Robinson M, Suzuki H, Hayashizaki Y, Jurisica I, Wrana JL:High-throughput mapping of a dynamic signaling network in mammalian cells.Science2005,
307:1621-1625.
10. Workman CT, Mak HC, McCuine S, Tagne J-B, Agarwal M, Ozier O, Begley TJ, Samson LD, Ideker T:A systems approach to mapping DNA damage response pathways.Science2006,312:1054-1059.
11. Bisson N, James DA, Ivosev G, Tate S a, Bonner R, Taylor L, Pawson T:
Selected reaction monitoring mass spectrometry reveals the dynamics of signaling through the GRB2 adaptor.Nat Biotechnol2011,29:653-658. 12. Patterson T a, Lobenhofer EK, Fulmer-Smentek SB, Collins PJ, Chu T-M,
Bao W, Fang H, Kawasaki ES, Hager J, Tikhonova IR, Walker SJ, Zhang L, Hurban P, de Longueville F, Fuscoe JC, Tong W, Shi L, Wolfinger RD:
Performance comparison of one-color and two-color platforms within the MicroArray Quality Control (MAQC) project.Nat Biotechnol2006,
24:1140-1150.
13. Cui X, Churchill G a:Statistical tests for differential expression in cDNA microarray experiments.Genome Biol2003,4:210.
14. Cui X, Hwang JTG, Qiu J, Blades NJ, Churchill G a:Improved statistical tests for differential gene expression by shrinking variance components estimates.Biostatistics (Oxford, England)2005,6:59-75.
15. Smyth GK:Linear models and empirical bayes methods for assessing differential expression in microarray experiments.Stati Appl Genet Mol Biol2004,3:Article3.
16. Tong a H, Evangelista M, Parsons a B, Xu H, Bader GD, Pagé N, Robinson M, Raghibizadeh S, Hogue CW, Bussey H, Andrews B, Tyers M, Boone C:
Systematic genetic analysis with ordered arrays of yeast deletion mutants.Science2001,294:2364-2368.
17. Collins SR, Schuldiner M, Krogan NJ, Weissman JS:A strategy for extracting and analyzing large-scale quantitative epistatic interaction data.Genome Biol2006,7:R63.
18. Tusher VG, Tibshirani R, Chu G:Significance analysis of microarrays applied to the ionizing radiation response.Proc Natl Acad Sci USA2001,
98:5116-5121.
19. Baldi P, Long AD:A Bayesian framework for the analysis of microarray expression data: regularized t-test and statistical inferences of gene changes.Bioinformatics2001,17:509-519.
20. Murie C, Woody O, Lee AY, Nadon R:Comparison of small n statistical tests of differential expression applied to microarrays.BMC Bioinformatics
2009,10:45.
21. Sidorova J, Breeden L:Analysis of the SWI4/SWI6 protein complex, which directs G1/S-specific transcription in Saccharomyces cerevisiae.Mol Cell Biol1993,13:1069-1077.
22. Ho Y, Mason S, Kobayashi R, Hoekstra M, Andrews B:Role of the casein kinase I isoform, Hrr25, and the cell cycle-regulatory transcription factor, SBF, in the transcriptional response to DNA damage in Saccharomyces cerevisiae.Proc Natl Acad Sci USA1997,94:581-586.
23. Spector M, Raff A, DeSilva H:Hir1p and Hir2p function as transcriptional corepressors to regulate histone gene transcription in the
24. Sharp J a, Rizki G, Kaufman PD:Regulation of histone deposition proteins Asf1/Hir1 by multiple DNA damage checkpoint kinases in
Saccharomyces cerevisiae.Genetics2005,171:885-899. 25. Kato M, Hata N, Banerjee N, Futcher B, Zhang MQ:Identifying
combinatorial regulation of transcription factors and binding motifs.
Genome Biol2004,5:R56.
26. Eriksson PR, Ganguli D, Clark DJ:Spt10 and Swi4 control the timing of histone H2A/H2B gene activation in budding yeast.Mol Cell Biol2011,
31:557-572.
27. Ashburner M, Ball CA, Blake JA, Botstein D, Butler H, Cherry JM, Davis AP, Dolinski K, Dwight SS, Eppig JT, Harris MA, Hill DP, Issel-Tarver L, Kasarskis A, Lewis S, Matese JC, Richardson JE, Ringwald M, Rubin GM, Sherlock G:Gene ontology: tool for the unification of biology. The Gene Ontology Consortium.Nat Genet2000,25:25-29.
28. Lee I, Li Z, Marcotte EM:An improved, bias-reduced probabilistic functional gene network of baker’s yeast, Saccharomyces cerevisiae.PloS One2007,2:e988.
29. Baryshnikova A, Costanzo M, Kim Y, Ding H, Koh J, Toufighi K, Youn J-Y, Ou J, San Luis B-J, Bandyopadhyay S, Hibbs M, Hess D, Gingras A-C, Bader GD, Troyanskaya OG, Brown GW, Andrews B, Boone C, Myers CL:
Quantitative analysis of fitness and genetic interactions in yeast on a genome scale.Nat Methods2010,7:1017-1024.
30. SaccharomycesGenome Database.[http://www.yeastgenome.org/]. 31. Pu S, Wong J, Turner B, Cho E, Wodak SJ:Up-to-date catalogues of yeast
protein complexes.Nucleic Acids Res2009,37:825-831.
32. Srivas R, Hannum G, Ruscheinski J, Ono K, Wang P-L, Smoot M, Ideker T:
Assembling global maps of cellular function through integrative analysis of physical and genetic networks.Nat Protocols2011,6:1308-1323. 33. Bandyopadhyay S, Kelley R, Krogan NJ, Ideker T:Functional maps of
protein complexes from quantitative genetic interaction data.PLoS Comput Biol2008,4:e1000065.
34. Boone C, Bussey H, Andrews BJ:Exploring genetic interactions and networks with yeast.Nat Rev Genet2007,8:437-449.
35. Parzen E:On estimation of a probability density function and mode.Ann Mathematical Stat1962,33:1065-1076.
doi:10.1186/gb-2012-13-12-r123
Cite this article as:Bean and Ideker:Differential analysis of
high-throughput quantitative genetic interaction data.Genome Biology
201213:R123.
Submit your next manuscript to BioMed Central and take full advantage of:
• Convenient online submission
• Thorough peer review
• No space constraints or color figure charges
• Immediate publication on acceptance
• Inclusion in PubMed, CAS, Scopus and Google Scholar
• Research which is freely available for redistribution