R E S E A R C H
Open Access
The genomic landscape shaped by selection on
transposable elements across 18 mouse strains
Christoffer Nellåker
1*†, Thomas M Keane
2†, Binnaz Yalcin
3, Kim Wong
2, Avigail Agam
1,3, T Grant Belgard
1,4,5,
Jonathan Flint
3, David J Adams
2, Wayne N Frankel
6and Chris P Ponting
1,2*Abstract
Background:Transposable element (TE)-derived sequence dominates the landscape of mammalian genomes and can modulate gene function by dysregulating transcription and translation. Our current knowledge of TEs in laboratory mouse strains is limited primarily to those present in the C57BL/6J reference genome, with most mouse TEs being drawn from three distinct classes, namely short interspersed nuclear elements (SINEs), long interspersed nuclear elements (LINEs) and the endogenous retrovirus (ERV) superfamily. Despite their high prevalence, the different genomic and gene properties controlling whether TEs are preferentially purged from, or are retained by, genetic drift or positive selection in mammalian genomes remain poorly defined.
Results:Using whole genome sequencing data from 13 classical laboratory and 4 wild-derived mouse inbred strains, we developed a comprehensive catalogue of 103,798 polymorphic TE variants. We employ this extensive data set to characterize TE variants across theMuslineage, and to infer neutral and selective processes that have acted over 2 million years. Our results indicate that the majority of TE variants are introduced though the male germline and that only a minority of TE variants exert detectable changes in gene expression. However, among genes with differential expression across the strains there are twice as many TE variants identified as being putative causal variants as expected.
Conclusions:Most TE variants that cause gene expression changes appear to be purged rapidly by purifying selection. Our findings demonstrate that past TE insertions have often been highly deleterious, and help to prioritize TE variants according to their likely contribution to gene expression or phenotype variation.
Background
Transposable elements (TEs) have been highly influential in shaping the structure and evolution of mammalian genomes, as exemplified by TE-derived sequence contri-buting between 38 and 69% of genomic sequence [1-8]. TE insertions also can influence the transcription, trans-lation or function of genes [1-7]. Functional effects of TE insertions include their regulation of transcription by act-ing as alternative promoters or as enhancer elements and via the generation of antisense transcripts, or of tran-scriptional silencers. TEs can alter splice sites or RNA editing, provide alternative poly-adenylation signals or
exons, modify chromatin structure or alter translation. Furthermore, TE insertion has been suggested to be a mechanism by which new co-regulatory networks arise [1-7].
TEs are classified on the basis of their transposition mechanism [9]. A class I retrotransposon propagates in the host genome through an intermediate RNA step, requiring a reverse transcriptase to revert it to DNA before insertion into the genome. Class II DNA transposons do not have an RNA intermediate, and translocate with the aid of transposases and DNA polymerase. The overwhelm-ing majority, over 96%, of TEs in the mouse genome are of the retrotransposon type [10]. These are further classified into three distinct classes: short interspersed nuclear ele-ments (SINEs), long interspersed nuclear eleele-ments (LINEs) and the endogenous retrovirus (ERV) superfamily. The ERVs are ancient remnants of exogenous virus infec-tions, consisting of internal sequence that encodes viral * Correspondence: [email protected]; [email protected].
ac.uk
†Contributed equally 1
MRC Functional Genomics Unit, Department of Physiology, Anatomy and Genetics, University of Oxford, South Parks Road, Oxford, OX1 3PT, UK Full list of author information is available at the end of the article
[11].
TEs provide a potential source of variants that are det-rimental to host viability and that promote disease. For
example, an allele of theagoutilocus in mouse contains
an intra-cisternal A particle (IAP) retrotransposon upstream of the promoter that causes ectopic expression of the agouti protein leading to variation in fur color, obesity, diabetes and tumor susceptibility [12-14]. The murine leukemia virus (MuLV)-like family of ERVs is a potent source of mutagenesis. The first MuLV element insertion was observed to result in hairless and pleiotro-pic phenotypes [15,16]. That TEs are frequently detri-mental can also be inferred from the strong bias in orientation of TEs found in introns of genes. Human intronic ERVs and LINEs, but not SINEs, show a ten-dency to disrupt expression when inserted into introns in
the gene’s transcriptional sense orientation [17-21]. In
mice there are over 50 examples of phenotypes attributed to spontaneous insertional mutagenesis by ERVs, with one class of functional variants, early transposon (ETn), showing a strong bias to be in the sense transcriptional orientation [6]. This orientation bias is attributed to cryp-tic splice acceptor usage and/or inefficient read-through of the ERV LTR, which contains its own regulatory signals [6].
TEs that are present in the C57BL/6J reference genome assembly exhibit this orientation bias [17,19-22], which indicates that TE insertions have often been deleterious over tens of millions of years of rodent evolution. By con-trast, our knowledge of the intronic distribution and the structure of TE variants (TEVs) inserted during the recent
Mus lineage has been largely derived from targeted
approaches. Previous studies examined two ERV families in eight strains (IAP or ETn/MusD elements in C57BL/6J, A/J, DBA/2J, SPRET/EiJ, CAST/EiJ, MOLF/EiJ, WSB/EiJ and 129X1/SvJ) [18,21,23], with one study in particular focusing on intronic insertions [22] and another exploring LINE variation in four strains (129S1, 129X1, A/J and DBA/2J) [24]. Such TEVs may exhibit a reduced orienta-tion bias because weakly detrimental TEVs that have been inserted, in the sense orientation, during recent evolution may not have had sufficient numbers of generations to be effectively purged from the population. In addition, dele-terious TEVs present in laboratory mice might have been maintained owing to their artificial inbreeding. It is thus plausible that TEVs contribute substantially to the genetic load and gene expression variation among inbred and wild mice.
We previously reported the generation and analysis of over a terabase of raw sequence from the genomes of 17 mouse strains [25], and the structural variations called between these strains [26]. In this study we present exten-sive analyses of a set of TEVs that were subsequently
line that was specifically designed to counter the difficul-ties inherent in identifying transposition events. We also present this new genome-wide catalogue of ERV, LINE, and SINE TEVs with deep TE subfamily, structural and orientation classifications across 18 (17 newly sequenced plus 1 reference) mouse strains.
This mouse genome project examined 13 classical laboratory (129P2/OlaHsd, 129S1/SvImJ, 129S5/SvEvBrd, A/J, AKR/J, BALB/cJ, C3H/HeJ, C57BL/6NJ, CBA/J, DBA/ 2J, LP/J, NOD/ShiLtJ and NZO/HiLtJ) and 4 wild-derived mouse inbred strains (CAST/EiJ, PWK/PhJ, WSB/EiJ and SPRET/EiJ), and each was compared to the C57BL/6J reference sequence. Altogether, this group encompasses approximately 2 million years (My) of evolutionary diver-gence [27]. Concomitantly, RNA-Seq data were generated from whole brain tissue from 14 of the 17 mouse strains, thereby allowing us to consider the impact of genotypic differences on gene expression levels.
By taking advantage of these new data we provide a comprehensive analysis of the patterns of variation of all
three TE classes across theMusgenus, and use these data
to examine the extent to which genomic location influ-ences the retention or purifying selection of TEVs among a large number of mouse strains. We first show variable ERV, LINE and SINE variant densities across the 18 mouse genomes, within chromosomal, intergenic and genic locations, and for different gene classes, and then account for these variable densities by invoking processes of neutral evolution and purifying or positive selection.
Results
Genome landscape of recently inserted TEVs
VL30 RLTR45 RLTR1B RLTR10 MuLV MaLR IS2 IAP ETn
(b) (c)
(d) (e)
B6 TEVs+ B6 TEVs
-115 12354 15118 13929 13814 12624 13834 14004 13661 13917 14720 11895 14627 17661 38512 40833 62839 0
A B
C D
E F
G H
I
J K
L
M N
O Q
P
C57BL/6J C57BL/6NJ NZO/HlLtJ NOD/ShiLtJ AKR/J A/J BALB/cJ C3H/HeJ CBA/J DBA/2J 129S1/SvlmJ 129P2/OlaHsd 129S5/SvEvBrd LP/J
WSB/EiJ CAST/EiJ PWK/PhJ SPRET/EiJ (a)
AB BC CD DE EF FG GH
13,317 4,050 9,587 2,193 1,640 8,711 6,772 100%
80%
60%
40%
20%
0%
ERV SINE
LINE_frag
LINE
AB BC CD DE EF FL LM MN
1,255 142 120 13,317 4,050 9,587 2,193 1,640
100%
80%
60%
40%
20%
0%
AB BC CD DE EF FG GH
1,733 602 1,618 496 340 2,023 1,859 100%
80%
60%
40%
20%
0%
AB BC CD DE EF FL LM MN
610 77 70 1,733 602 1,618 496 340
100%
80%
60%
40%
20%
[image:3.595.57.539.88.563.2]0%
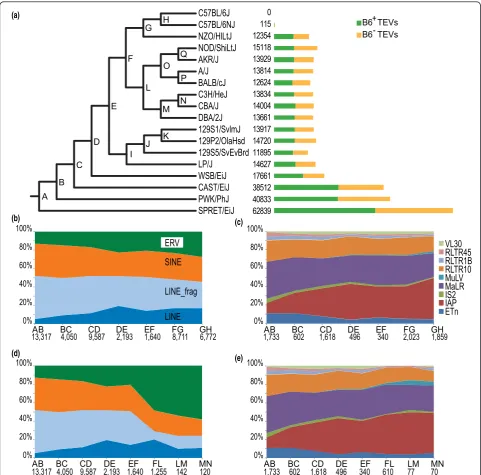
sent in C57BL/6J; B6-, not present in C57BL/6J). By further classifying TEVs according to type and class, we determined that virtually all mouse strain TEVs are drawn from subfamilies that were previously observed to be active [9] (Figure 1; Additional file 3). Each strain has
approximately equal numbers of B6+and B6-variants, as
one might expect if TEVs accumulated at similar rates. There are higher numbers of TEVs relative to C57BL/6J in the wild-derived strains (SPRET/EiJ, PWK/PhJ and CAST/EiJ; 13.8 to 22.4 per Mb) than in the laboratory strains (4.2 to 6.3 per Mb; Figure 1a). By examining the strain distribution patterns derived from 688 PCR valida-tion of TEVs across 8 strains, we find relatively low false positive rates (11 to 22%); furthermore, by conservatively assuming the genomes of the three 129-derived sub-strains (129S1/SvImJ, 129P2/OlaHsd and 129S5/ SvEvBrd) to be identical, we estimated false negative rates to be 5 to 28% across the classes (Additional files 4, 5 and 6). Given the available read length, insert size and coverage, there were limits to the degree to which subfa-milies of TEVs could be reliably stratified. Differences in our ability to distinguish TEV subfamilies are attributable to contrasting sequence divergence in their first and last 300 bp. SINE subfamilies could not be distinguished, LINEs were classified as either full-length LINEs or LINE fragments, and ERVs were placed into subfamilies VL30, RLTR45, RLTR1B, RLTR10, MuLV, MaLR, IS2, IAP and ETn. However, the range of classes and families we inves-tigated, to our knowledge, represents the broadest study
of TEVs in theMuslineage to date.
In order to interpret this vast catalog, we placed the TE insertions within a primary phylogeny of these mouse strains, which permitted an initial overview of the relative expansions of all the TE families over an approximate 2 My time period (Figure 1a). This primary phylogeny matched the phylogeny expected from the heritage of the mouse strains [29]. This analysis revealed the historic expansion of ERV families, most notably IAPs, in labora-tory strains (Figure 1b-e). ERVs were seen to contribute between 29 and 39% of all TEVs in the sequenced strains (Figure 1b-e).
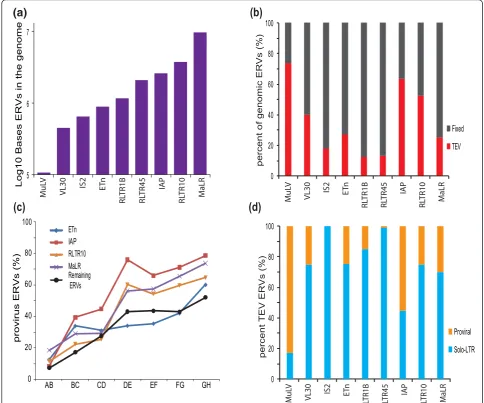
Different ERV families contribute, in sequence length, to greatly differing extents to the mouse genome (Figure 2a). The relative proportions of polymorphic, and apparently fixed ERVs, also vary considerably among these families (Figure 2b), in part reflecting the ages of past exogenous viral infections. The MuLV family, for example, arose recently and thus is found in a smaller number of copies that together show a higher fraction of variable elements (Figure 2a, b). ERVs are prone to recombination between their flanking LTR sequences. To estimate this recombina-tion rate in different ERV families, we mapped TEVs to the inferred mouse strain primary phylogeny and observed
ing phylogenetic divergence (Figure 2c). We estimate the average half-life for ERV recombination from provirus to solo-LTR to be approximately 0.8 My (assuming a con-stant rate and that all ERVs insert as proviruses; Figure 2c, d; Materials and methods). IAP elements recombine parti-cularly rapidly, with a half-life we estimate to be approxi-mately 0.7 My years (Figure 2c, d; Materials and methods). This is similar to a previous estimate derived from a single
MuLV element within thedilutelocus of DBA/2J mice
[30]. By contrast, the older family of ETn elements appear to be associated with a much slower rate of recombina-tion. The differences in recombination rate may, in part, reflect variations in LTR lengths among different ERV families.
TEV density varies by chromosome, by local nucleotide composition (G+C content) [31-33], and by position rela-tive to functional sequence, such as exons. LINE TEVs show a bias for being located in A+T-rich sequence, whilst SINE TEVs tend to reside in G+C-rich sequence (Figure 3a) [34,35]. We also observed ERV TEVs to be more het-erogeneous than SINEs or LINEs in their G+C bias, with MuLV TEVs being as enriched in high G+C sequence as SINEs (Figure 3a). In subsequent analyses we determined the extent and significance of enrichments and depletions by implementing a genome-wide association procedure that accounted for three potentially confounding effects, namely the different rates of TE insertion across (a) the G +C content spectrum (Figure 3a), (b) different chromo-somes (Figure 3b), and (c) sequence of varying length (Materials and methods) [36].
We find that apparently fixed TEs (SINEs, LINEs or ERVs) occur at relatively even densities across individual chromosomes having accounted for G+C content (Figure 3b, y-axis). An exception to this are SINEs on chromosome 11, which is unusual in at least two respects, namely its elevated replication rate [37] and gene density. Nevertheless, when we took account of these factors in this analysis, the strong enrichment of SINEs remained essentially unchanged (data not shown; Materials and methods). The second notable exception are LINEs on the X chromosome [34,35], whose higher density has been attributed to increased rates of LINE insertions in both male and female germlines [38].
autosomes (A) and on the X-chromosome allowed us to
calculate the male TEV insertion bias:a = (3(X/A) - 4)/
(2 - 3(X/A)) [39]. We obtainavalues of 7.8 (95%
confi-dence interval (CI) 4.7 to 13.2), 7.3 (95% CI 5.5 to 11.9)
and 151.8 (95% CI 18.5 to∞) for ERV, LINE and SINE
TEVs, respectively. These estimates of male TEV inser-tion bias are 3- to 68-fold higher than estimates based on substitution rates [40] and imply that TE insertions occur almost exclusively in the male germline genome. By adapting the McDonald-Kreitman test [41] (Materials
and methods), we considered whether the ratio of fixed to polymorphic TEs is indicative of the past action of positive selection on TEVs (Figure 3b). Our results cor-roborate previous proposals of positive selection on
LINE TEVs on the X chromosome [42,43] (P < 10-16).
Our study, however, has the advantage of using gen-ome-wide observations of fixed and polymorphic TEs. This approach also predicts, for the first time, positive selection for preferential retention of ERV and SINE TEVs on the X chromosome.
0 20 40 60 80 100
Proviral
Solo-LTR
MuL
V
VL30 IS2 ET
n
RL
TR1B
RL
TR45 IAP
RL
TR10 MaLR
percent
TEV ER
Vs (%)
0 20 40 60 80 100
Fixed
TEV
MuL
V
VL30 IS2 ET
n
RL
TR1B
RL
TR45 IAP
RL
TR10 MaLR
percent of genomic ER
Vs (%)
(b)
5 6 7
MuL
V
VL30 IS2 ET
n
RL
TR1B
RL
TR45 IAP
RL
TR10 MaLR
Log10 Bases ERVs in the genome
(d)
(c)
(a)
provirus ERVs (%)
0 20 40 60 80 100
AB BC CD DE EF FG GH
[image:5.595.55.540.90.493.2]ETn IAP RLTR10 MaLR Remaining ERVs
(b)
X
X
11
19 4
13
15
3 19
X
1 17
7
120 140
80
60
120 140
80
60
TEVs obs/exp (%) Fixed TEs
obs/exp (%)
SINE LINE ERV
Significant x2 Significant x1 Not Significant
(0-32) (32-34) (34-36) (36-38) (38-40) (40-42) (42-44) (44-46) (46-48) (48-50) (50-52) (52-54)
(54-100)
GC - bin (%) 100
80
60
40
20
0
Cumulative percentage of
TEVs (%)
[image:6.595.59.538.88.608.2]LINE TEV ERV TEV SINE TEV MuLV TEV Genomic LINE Genomic ERV Genomic SINE (a)
Purifying selection on TE insertions within genes
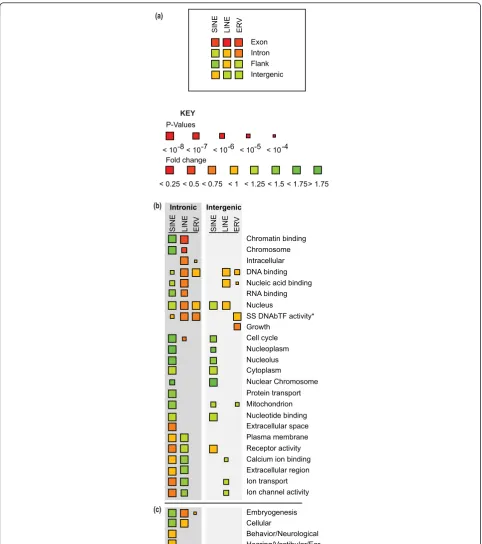
TEVs from all three classes show strong and significant depletions in protein-coding gene exons (Figure 4a), implying that such insertions are strongly deleterious (assuming that most TEVs across the noncoding gen-ome are neutral or deleterious). Using our gengen-ome-wide association procedure, we tested for the over- or under-representation of TEVs across the genome within introns, or 5 kb flanking sequences of protein coding genes, or within the remaining intergenic sequence. No significant differences were found in the densities of SINE, LINE or ERV TEVs between first, middle or last introns (data not shown). However, SINE TEVs were enriched in flanking and intronic sequence, in contrast to LINE and ERV TEVs, which were strongly depleted in introns (false discovery rate (FDR) < 0.1%; Figure 4a).
We then considered whether intronic TEV densities are higher in genes from particular functional classes (Gene Ontology (GO) and Mouse Genome Informatics annota-tions; Materials and methods), once again accounting for chromosome and nucleotide composition biases. The introns of genes with essential housekeeping functions, such as transcription and chromatin binding factors, and genes that are associated with embryogenesis phenotypes, were observed to be significantly and strongly depleted in LINE and ERV TEVs (Figure 4a, b; Additional file 7). In contrast, housekeeping genes show a significant enrich-ment of intronic SINE TEVs (Figure 4b).
Next, we calculated the orientation bias (Orientation bias = (TEVs in sense orientation)/(All TEVs)) for the 20,001 intronic TEVs for which we had orientation data. If TE insertions are random, and are not frequently deleter-ious, or if they are only mildly deleterdeleter-ious, then we would
expect to observe no bias (orientation bias≈50%). Instead,
a strong orientation bias was evident for each of the three TE classes (32.6%, 41.7%, and 41.6% for ERV, LINE and SINE TEVs, respectively). The orientation bias for IAP TEVs was recently reported to be 25.9% for a redundant set of 3,317 intronic IAPs [18]. This is lower than our non-redundant set of 2,418 intronic IAP TEVs (orienta-tion bias = 30.9%). The strong biases for ERVs and, to a lesser extent for LINEs, are consistent with these elements being depleted from introns (Figure 4a). The orientation bias for SINE TEVs indicates that despite their enrichment in introns (Figure 4a), which is assumed to reflect a muta-tional bias, they are strongly depleted when inserted in the transcriptional sense orientation. TEV orientation biases were no different for genes annotated with GO terms
found either to be enriched or to be depleted in TEVs (P>
0.05,c2test; Figure 4b).
The large set of TEVs in this study allowed us to infer whether the location of a TEV within a gene structure affects the strength by which it is purified from the popu-lation. Orientation bias was significantly stronger for
ERV TEVs within middle or last introns, and for SINE TEVs within first introns (Figure 5a). We find the orien-tation bias not to be significantly different between genes with high or low brain expression (data not shown) or between TEV classes that are relatively young (little divergence) or old (Figure 5b), or between solo-LTRs and proviral LTRs (data not shown).
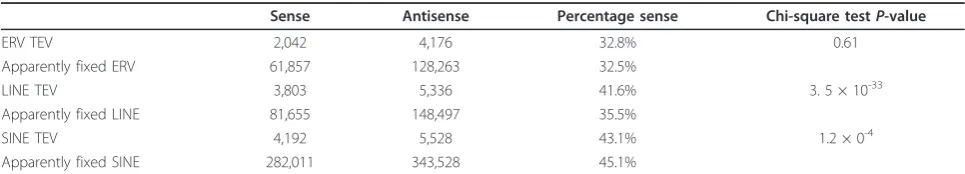
By comparing the orientation bias for TEVs, which were inserted relatively recently, with the corresponding bias for predominantly older monomorphic TEs, we were able to infer the rate by which each TEV class is purged. Orienta-tion bias was not significantly different between apparently fixed and variant ERV TEs (Table 1). By contrast, orienta-tion bias was significantly and substantially stronger for apparently fixed LINE TEs than for recently inserted LINE TEVs. There was also a small, yet significant, increase in the strength of this bias for SINE TEVs relative to appar-ently fixed SINE TEs.
Purifying selection on TE insertion depends on proximity to functional elements
Strong purifying selection of TEVs from all three classes, and in both transcriptional orientations, is evident in sequence near (< 0.5 kb) to the transcriptional start sites of genes (Figure 6a). Purifying selection of deleterious TEVs
appears less strong near the 3’of genes. We observed a
sig-nificant increase in SINE TEVs in the vicinity of genes (as previously observed [19]) and upstream and downstream
(1 to 10 kb) of genes (P< 10-16; Figure 6a).
A recent study of 161 mouse ERV TEVs identified their strongest intronic orientation bias to be in the close vici-nity of exon boundaries [22]. Using our larger set of 20,001 intronic TEVs, we confirmed this finding, and then extended it to include all TEVs (Figure 6b). SINE TEVs exhibit a reduced orientation bias near exons, thus appearing to be less deleterious; their depletion within the interiors of introns appears to reflect a G+C composi-tion bias [22].
Impact of TEVs on quantitative traits and expression levels
ER
V
LINE
SINE ER
V
LINE
SINE
Intergenic Intronic
DNA binding
RNA binding
Calcium ion binding Cell cycle Chromatin binding Chromosome
Extracellular region Extracellular space Growth
Intracellular
Ion channel activity Ion transport Mitochondrion Nucleic acid binding
Nucleolus Nucleoplasm
Nucleotide binding Nucleus
Plasma membrane Protein transport
Receptor activity SS DNAbTF activity*
Cytoplasm
Nuclear Chromosome
Cellular Embryogenesis
Hearing/Vestibular/Ear Behavior/Neurological > 1.75 Fold change
< 0.25 < 0.5 < 0.75 < 1 < 1.25 < 1.5 < 1.75 P-Values
< 10-8< 10-7 < 10-6 < 10-5 < 10-4
ER
V
LINE
SINE
Exon Intron Flank Intergenic
(a)
(b)
(c)
[image:8.595.57.540.87.632.2]KEY
Of the 12 variants that passed the genome-wide associa-tion with QTLs [26], two were found to be IAP TEVs.
To establish a set of TEVs that likely affect gene expression, we examined the dataset for previously pro-ven examples of ERV strain variants, of which there are about a dozen examples [6] (also see [45]), of which only some would show sufficient expression in brain to be detected in our study. Indeed, for ERV insertions in
Gria4 (IAP type I insertion specific to C3H/HeJ mice),
Myo5a(MuLV insertion specific to DBA/2J) and Zhx2
(ETn insertion specific to BALB/c), the expected expres-sion decreases associated with the ERV allele were all observed (data not shown). However, since many ERV insertion effects are often local, primarily affecting levels of a nearby exon [45], and/or are cell type-specific [46],
these and likely other novel TEV cis effects on gene
expression did not survive the stringent multiple testing correction required for genome-wide analysis.
We next considered whether TEVs, when considered together, were often causal variants of gene expression changes or quantitative traits. We compared expression levels among strains, acquired from RNA-Seq experi-ments of whole brain samples, for genes with or without an intronic TEV. Ascribing a gene expression difference to a specific TEV is confounded by the presence of other linked variants that may, instead, be causal. To account for this and to identify a conservative set of TEVs asso-ciated with gene expression differences, we calculated in each strain the expression for the constitutively expressed sequence and then normalized these mapped read levels between samples to allow for their comparison. By con-sidering the presence or absence of a TEV as an experi-mental condition, differential expression of genes was calculated (Materials and methods). In a previous publi-cation [26], we estimated that the proportion of expres-sion heritability attributable to TEVs is no more than
(a)
(b)
50%
45%
40%
35%
30%
25%
Divergence (%)
0-1 2-3 4-5 6-7 8-9
10-1
1
12-13 14-15
proportion in sense orientation (%)
SINE LINE ERV Expected
ERV LINE SINE
50%
40%
30%
20%
10%
0%
*** ***
[image:9.595.58.540.89.286.2]First Middle Last First Middle Last First Middle Last
Figure 5Densities and orientations of TEVs with respect to the transcriptional (sense) direction of mouse genes.(a)Orientation bias within first, middle and last introns of protein coding genes. All TEV types occur preferentially in the antisense orientation, with the ERV TEV bias being the strongest. ERV TEVs show a lower bias in the first introns of genes (P< 10-3by chi-square test). SINE TEVs show a significantly stronger orientation bias in the first introns of protein coding genes (P< 10-3).(b)Orientation biases are not significantly different between‘young’and
‘old’TEVs, categorized using percentage sequence divergence from the repeat consensus sequence (x-axis). *** indicatesP< 10-3.
Table 1 Orientation bias values of TEVs or apparently fixed TEs in the mouse genome
Sense Antisense Percentage sense Chi-square testP-value
ERV TEV 2,042 4,176 32.8% 0.61
Apparently fixed ERV 61,857 128,263 32.5%
LINE TEV 3,803 5,336 41.6% 3. 5 × 10-33
Apparently fixed LINE 81,655 148,497 35.5%
SINE TEV 4,192 5,528 43.1% 1.2 × 0-4
Apparently fixed SINE 282,011 343,528 45.1%
For each TE superfamily the number of intronic variants within mouse genes with human orthologs was counted. B6+
[image:9.595.56.539.616.703.2]144
233
377
610
987
1597
2584
4181
6765
10946
17711
28657
46368
2
1
0.5
0.25
0.125
)
ȡ
(
gol 2
distance (bp)
144 233 377 610 987 1597 2584 4181 6765
10946 17711 28657 46368
distance (bp)
144
233
377
610
987
1597
2584
4181
6765
10946
17711
28657
46368
2
1
0.5
0.25
0.125
)
ȡ
(
gol2
distance (bp)
144 233 377 610 987 1597 2584 4181 6765
10946 17711 28657 46368
distance (bp)
5’ 3’
5’ 3’
(a)
LINE genomic LINE TEV ERV genomic ERV TEV SINE genomic SINE TEV
144
233
377
610
987
1597
2584
4181
6765
10946
17711
28657
46368
2
1
0.5
0.25
0.125
)
ȡ
(
gol 2
distance (bp)
144 233 377 610 987 1597 2584 4181 6765
10946 17711 28657 46368
distance (bp)
144
233
377
610
987
1597
2584
4181
6765
10946
17711
28657
46368
2
1
0.5
0.25
0.125
)
ȡ
(
gol2
distance (bp)
144 233 377 610 987 1597 2584 4181 6765
10946 17711 28657 46368
distance (bp)
5’ 3’
5’ 3’
(b) Sense
Antisense
Sense
[image:10.595.59.538.89.617.2]Antisense
10% across all genes. Despite this, we identified 28 of 48 differentially expressed genes having one or more TEVs (Additional file 8). TEVs were thus found two-fold more frequently associated with differential expression of genes into which they have been inserted than expected by
chance (P< 0.01). We found no significant bias for the
direction of expression change between strains associated with these TEVs. This finding then allowed us to investi-gate whether a specific TEV class contributes greatly to these gene expression differences. We would expect that when we account for the different TEV densities in genes, ERV, LINEs and SINEs would be equally likely to be associated with differential gene expression. However, we found ten-fold fewer LINEs and LINE fragments
asso-ciated with differential gene expression than expected (P
< 0.01). This implies that LINE insertions that cause changes in gene expression are substantially more likely to be purged by purifying selection than are ERV and SINE TEVs.
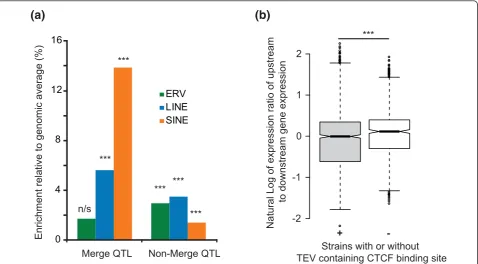
A recent publication showed that species-specific CTCF binding sites frequently occur in TEs [47]. To examine if variation in gene expression could be associated with the
presence or absence of such CTCF-associated TEVs, we
intersected the B6+
TEVs with these CTCF binding site region predictions. We observed an increased expression variation between genes that flank a CTCF-binding TEV. The likelihood for this change was smaller than that obtained for the expression variance increase for 10,000
random samples (that is, empiricalP< 10-4; Figure 7b).
Thus, the increase in expression variation is associated with CTCF-binding TEVs specifically, rather than with TEVs in general. In Figure 8 we present an example of a CTCF-binding TEV, an IAP-I element lying between
Slc36a1 andFat2 on chromosome 11 in all but three strains (DBA/2J, NZO/HiLtJ and SPRET/EiJ).
To provide our data to the research community as a resource, we provide in Additional file 9 a table listing
455 intronic TEVs, together with their associated genes’
brain RNA expression values, that are significantly asso-ciated with expression differences, after controlling for false discoveries (455 TEVs within 322 genes). A similar table (Additional file 10) lists 1,404 intergenic TEVs, and their significant associations with the expression of neighboring genes (1,404 TEVs, neighboring 776 genes).
(b)
0 1 2
-1
-2
Natural Log of expression ratio of upstream
to downstream gene expression
Strains with or without TEV containing CTCF binding site
-+
***
(a)
0 4 8 12 16
ERV LINE SINE ***
***
*** ***
***
Merge QTL Non-Merge QTL
Enrichment relative to genomic average (%)
[image:11.595.60.539.89.353.2]n/s
Discussion
Deep sequencing of 17 mouse genomes has allowed sub-stantial improvements in the numbers and accuracies of TEV calls. We present a near complete catalogue of 103,798 TEVs that have survived selection and drift over
the past 2 My ofMuslineage evolution. From an inferred
evolutionary history of TE family activity, ERVs and in particular the IAP subfamily, appear to be expanding rapidly in mouse genomes, as previously proposed [6].
Chromosomal distribution of TEVs
Our findings allow a genome-wide comparison between mostly fixed C57BL/6J TEs and TEs that are segregating among the strains. We found that, similarly to fixed TEs, LINE TEVs show a location preference for A+T-rich sequence, whilst SINE TEVs tend to reside in G+C-rich sequence (Figure 3). As was noted previously [10], these opposing tendencies are perplexing since LINEs and SINEs insert using the same endonuclease. One possible
resolu-tion to this puzzle is suggested by‘older’SINEs showing G
+C distributions that differ from those for more recently
inserted SINEs, perhaps because SINEs in A+T-rich sequence are more readily deleted [48]. If so, then we would expect G+C distributions for recent TEV insertions to differ from those for all TE insertions. Indeed, it has been proposed that observed genomic distributions will dif-fer substantially from the original insertion site predif-ferences, owing to a combination of selection and genetic drift [22]. However, we see no evidence of ongoing selection on SINE G+C bias, implying either that the selection is relatively rapid or that there is an unobserved bias at work.
MuLV TEVs show a higher G+C base composition pre-ference compared to other ERV TEVs. As a consequence, MuLV elements are more likely to be inserted in sequence that is rich in functional elements, and thus may have a greater propensity for modifying gene expres-sion levels. Indeed, MuLV insertions have already been observed to modulate the expression of several proto-oncogenes in tumors [16].
LINE, SINE and ERV TEVs are all depleted on the X chromosome, with observed densities approaching two-thirds of the autosome densities expected from an
20 kb
55045000 55050000 55055000 55060000 55065000 55070000
Scale chr11:
SIN
DNA
SINE LINE LTR Simple
Mammal Cons 2.1 _
-3.3 0
-Fat2
DNA
RepeatMasker
Slc36a1
gene expression (FPKM)
0 2 4 6
*
CTCF binding IAP-I B6+ insertion n.s.
[image:12.595.61.539.85.414.2]Strains with IAP-I TEV
Strains without TEV
insertion pattern that is exclusively male (in contrast to equal densities if there are no gender mutation biases). This has previously been observed to be the case for active
Aluelements in humans [49]. We propose that the vast
majority of all TE insertions in the Muslineage have
occurred in the male germline genome. While the degree of inter-chromosomal variation is decreased for apparently fixed ERV and SINE TEs in the genome, monomorphic LINE TEs are enriched on the X chromosome. We can conceive no alternative model other than strong positive selection for this apparent higher rate of fixation in excess of the rate of mutation.
Purifying selection on intronic TEVs
Variation in TEV densities in intergenic and genic regions compared with expected values indicate ongoing selective processes acting on TEVs. The significant deficits of ERV or LINE TEVs in introns indicate that many were
deleter-ious and thus were selectively purged over these strains’
evolutionary history. These observations agree with pre-vious findings that LINE TE insertions are less well toler-ated within gene-rich sequence [38]. While LINE and ERV TEVs are strongly depleted in genes associated with housekeeping functions, SINEs are enriched in such genes
(Figure 4).De novointronic insertion variants of LINEs or
ERVs but not SINEs are thus likely to often dysregulate such genes. Interestingly, it is exactly these classes of genes whose regulation depends on TE-derived sequence [50]. The enrichment of SINE TEVs, in contrast to the depletions of ERV and LINE TEVs, is consistent with a previous proposal that SINEs preferentially insert within genes that are expressed in the germ line [51], and is in agreement with the increased density of SINE TEVs in the vicinity of genes [19]. While all TEV classes are depleted in the immediate proximity of genes and splice donor and acceptor sites, SINEs are enriched within 10 kb of genes and have shorter exclusion zones near to functional sequence compared to ERV and LINE TEVs.
If it is assumed that TEVs that are inserted in the anti-sense orientation are not under selection, then orientation bias values imply that approximately 50% of all ERVs that inserted in the sense orientation into the introns of protein coding genes have been deleterious, as have been about one-third of LINE or SINE sense insertions. We might expect TEV orientation biases to be different between genes annotated with GO terms found either to be enriched or to be depleted in TEVs. However, no such dif-ferences were detected, which implies that antisense orien-tated TEVs may also commonly be deleterious (perhaps by affecting the expression of antisense transcripts), and that the ratio of sense-to-antisense deleterious TEVs is rela-tively constant among genes from different functional classes.
The observed orientation biases do not appear to be attributable to non-selective mutational or repair mechanisms. This is because we observe differences in orientation bias values for SINE and ERV TEVs depend-ing on intron position in a gene, which in turn make less likely alternative models that explain orientation bias as being due solely to a mutational preference for TE pre-servation in the antisense strand, perhaps as a conse-quence of transcription-coupled repair [52].
No substantial differences in orientation bias values between fixed and variant ERVs were observed. This implies that deleterious sense inserted ERV TEVs are not commonly segregating among these mice; rather, they have most often been purged very rapidly from the mouse population. Orientation bias was significantly and substan-tially stronger for apparently fixed LINE TEs than for recently inserted LINE TEVs, implying once more that purifying selection on sense inserted LINE TEVs tends to be less strong than on ERVs.
Effect of TEVs on gene expression and quantitative traits
Regions annotated with refined QTLs [44] are significantly enriched in LINE and SINE TEVs. This is evidence that TEVs contribute, albeit rarely, to at least some of the approximately hundred traits that were considered. Many of these effects are likely to act either on exons flanking the TEV site, or on downstream elements, as has been
observed for many known de novoERV insertions [6].
Although a small number of TEVs (132) were annotated as being in coding exons, due to breakpoint uncertainty some of these will instead be intronic. None of our ERV, LINE or SINE TEV sets was significantly associated with global expression level change measured using an RNA-Seq experiment of whole brain samples. This suggests that TEVs that survive purifying selection are only rarely
asso-ciated with gene expression changes. Althoughde novoTE
insertions frequently cause disruptions in genes’
expres-sion, such deleterious variants appear to be often purged by strong purifying selection and the genomic contribution of the remaining TEs to global gene expression variation thus appears minimal.
changes in gene expression, it appears that, inMus
muscu-lus, purifying selection has preferentially purged such
variants.
However, given that the proportion of expression her-itability attributable to TEVs generally is no more than 10% [26], many of the significant expression changes tabulated in Additional files 9 and 10 will not be due specifically to the TEV but rather, for example, to co-segregating variants. Nevertheless, these data, together with evidence that the insertion and selection on TE insertions vary considerably according to class, tran-scriptional orientation, inter- or intragenic location, and gene functional category should now assist in distin-guishing the minority of TEVs with a profound negative effect on organismal fitness from the majority of TEVs with little to no effect on fitness. There are a host of possible phenotypic consequences of TEVs outside the ones tested here, such as premature transcriptional ter-mination at a distance triggered by ERVs [18]. It is also likely that some TEVs have phenotypic effects that are restricted to specific tissues and/or developmental time points. Although determining the full extent of such effects is beyond the remit of this paper, the extensive catalogue of TEVs that we have presented provides a valuable resource that should greatly facilitate such studies.
Conclusions
We present a near complete catalogue of TE variation across 18 mouse strains, encompassing 2 My of
diver-gence within theMuslineage. We recaptured previously
reported variation in the relative activities of different mouse TE families and also report evidence that the vast majority of TE activity has occurred in the paternal germ line. Strong signals of purifying selection are evident with respect to TE family, genomic location, orientation and functional category of encompassing genes. Most TEVs that are not purged by rapid and strong negative selec-tion appear to have little, or no, effect on organismal fit-ness. Nevertheless, we found that a small fraction of TEVs are associated with relatively large effects on gene expression.
Materials and methods
Sequencing data
Raw sequencing data were generated from 13 classical laboratory (129P2/OlaHsd, 129S1/SvImJ, 129S5/SvEvBrd, A/J, AKR/J, BALB/cJ, C3H/HeJ, C57BL/6NJ, CBA/J, DBA/2J, LP/J, NOD/ShiLtJ and NZO/HiLtJ) and 4 wild-derived (CAST/EiJ, PWK/PhJ, WSB/EiJ and SPRET/EiJ) mouse inbred strains as part of the Mouse Genomes Pro-ject [25]. Briefly, 1,239 Gb of mapped sequence were gen-erated using the Illumina GAIIx platform [53] providing
omes. Paired-end reads were a mixture of 37 bp, 54 bp, 76 bp and 108 bp in length, with fragments being 150 to 600 bp in length. Accession numbers for the raw sequen-cing data are given in Additional file 1.
ERV probes
Differences in nomenclature and classification groupings between RepBase/Repeatmasker and colloquial descrip-tions used in the literature can be difficult to resolve. In this study, we classify TEs into DNA elements, SINEs, LINEs and ERVs. ERVs have been further classified into the following families: IAP, ETn, MuLV, VL30, MaLR, RLTR10, IS2, RLTR45 and RLTR1B. A complete listing of RepBase [54] classifications and conventional ERV super-classes corresponding to these families is provided in Additional file 2.
B6+calling algorithms
Structural variant (SV) deletions in all inbred strains were detected using three methods: split-read mapping (Pindel [55]), mate-pair analysis (BreakDancer, release-0.0.1r61 [56]), and read-depth (CND [57]). Following merger of these calls into a non-redundant set, computational vali-dation by local assembly and breakpoint refinement was performed. Details of the complete pipeline, SVMerge, are described elsewhere [28].
SV calls were intersected with the RepeatMasker [58] track of mm9 downloaded from UCSC on 20 July 2010
[59,60]. SVs were then classified as B6+TEV based on
the following criteria: they must contain TE sequence as annotated by RepeatMasker, must be a deletion with respect to the C57BL6/J reference assembly and sequence annotated as TE needed to be within 50 bp of the SV breakpoints. TEVs were then further classified into superfamilies and TE structure types: LINE, fragment of a LINE, SINE, DNA transposon, LTR bound element or
as more ‘complex’. The LTR bound elements were
further subdivided based on structure: solo-LTR (con-taining only a single LTR), LTR-int (the deleted sequence if comparing a provirus element to a solo-LTR), provirus (an intact ERV with two LTRs and internal sequence), pseudoelement (ERV with partial LTR on either end and/ or poly-A tail), hybrid provirus (multiple RepeatMasker subfamily annotations within one repeat) or hybrid pseu-doelement. A flowchart of the classification criteria can be found in Additional file 11.
Of 145,429 SVs that are absent from the C57BL/6J assembly, 11% did not appear to contain TE sequence, 21.2% TE sequences did not coincide with the SV break-points and 33.4% were denoted as being complex, mean-ing that they contained either simple repeats or multiple events of TE insertion. The categories DNA transposons
hybrid pseudoelement (n= 36) and complex (n= 48,521) were subsequently disregarded in further analyses. The remainder were classified into the TE repeat families
cor-responding to the probes used in the B6-calls (Additional
file 2). Although most TE families were classified based on their RepeatMasker annotations, LINE elements were classified as LINE fragments (hereafter referred to as LINE_frag) if the length of the element was less than 5 kb. The minimum cutoff was determined by the local minima between the frequency distribution curves of small fragments and the predominance of LINEs of lengths near the 6.4 kb canonical sizes (data not shown).
B6-calling algorithms
TE insertions that were present in any strain but absent from the C57BL/6J mm9 reference sequence (denoted as
B6-calls) were identified using RetroSeq [61]. RetroSeq
seeks inconsistently mapped read pairs where one end is mapped confidently (referred to as anchor reads) but the other end is either not mapped to the reference or mapped to a distant location on the reference with low mapping quality. The non-mapping or distantly mapped mates are then aligned to the ERV probes (Additional file 2). Retro-Seq requires the anchoring read to have a minimum map-ping quality of 30 and at least 10 independent read pairs to support a call. Alignments to Repbase were performed with SSAHA2 [62] with a minimum of 80% identity and hit length of 36 bp. RetroSeq clusters the supporting read anchors to produce variant calls to approximately 1 to 2 kb resolution. The initial seed call windows were subject to further checking as follows. To identify the putative breakpoints, we scanned the region for positions with cov-erage fewer than ten reads and positions with low cover-age mismatches (false alignments at the breakpoints can appear as false SNPs). For each putative breakpoint, we checked the ratio of forward/reverse orientated anchor reads at either side of the breakpoint. For the breakpoint to be accepted, we required at least 10 forward orientated anchors within 450 bp upstream and 10 reverse orientated anchors within 450 bp downstream. We also required that the ratio of forward-to-reverse anchors in the 450 bp upstream and 450 bp downstream to be less than 2-to-1. Furthermore, we required the distance from the final for-ward orientated upstream anchor to the first reverse orien-tated downstream anchor to be less than 120 bp. We then removed any calls that occurred within 50 bp of a region
annotated by Repeatmasker as a‘simple_repeat’or‘
low_-complexity’or a SINE, LINE or ERV element in the mm9
reference.
Due to the differences in sequencing depth across the strains, it was necessary to carry out a computational genotyping step in order to correct for false negatives in the strains with lower sequencing coverage. For each TEV call and each strain that the call was not made in,
we examined the reads 300 bp upstream and down-stream and counted the number of putative anchor reads. If there were at least five forward orientated anchor reads upstream and five reverse orientated anchor reads downstream, then we called the TEV as being present in the strain.
B6-orientation
To determine the sense or antisense orientation of the
B6- elements, we carried out local de novo assembly
with Velvet [63] of the reads that mapped within 600 bp upstream and downstream (including their mates) of the putative breakpoint. We realigned the contigs to the reference with SSAHA2 [62] and detected contigs that align incompletely at the breakpoints. We aligned the unmatched part of the contig to the ERV probe set in order to determine the orientation status of the element.
B6-size estimation
In order to obtain an accurate estimate of the sizes of the
B6- TEVs, we generated a single long range Illumina
‘jumping’library with an estimated fragment size of 3 kb
and sequenced the 50 bp of the ends of the fragments in a single HiSeq2000 lane per strain for 13 strains (129P2, 129S1/SvImJ, 129S5, A/J, BALB/cJ, C3H/HeJ, CAST/EiJ, CBA/J, DBA/2J, LP/J, NZO/SHiLtJ, PWK/PhJ, and WSB/ EiJ). These data have been submitted to the European Nucleotide Archive (ENA) under Sequence Read Archive (SRA) study ID ERP000255.
Briefly, mate pair (3 kb) libraries were prepared from
10μg mouse genomic DNA using a hybrid
SOLiD/Illu-mina library protocol developed by L Shirley and M Quail at the Wellcome Trust Sanger Institute. Mouse genomic DNA was sheared to approx 3 kb fragments using a Digilab Hydroshear and the 2 × 50 bp mate-paired library was constructed using the nick translation
protocol (SOLiD 3 Plus System Library Preparation
Guide 2009) as described elsewhere [64]. Immediately following the S1 nuclease/T7 exonuclease digest, the biotinylated mate-pair fragments were purified and ligated to appropriate adapters (Integrated DNA tech-nologies, Leuven, Belgium), enriched by PCR then
size-selected exactly as described in the Illumina Mate-pair
Library v2 Sample Preparation Guide.
We mapped these reads to the reference genome using SMALT [65] and estimated the physical coverage from these lanes to be between 30- and 40-fold per
strain. For each B6
An estimate of 2.6% was made for the false positive rate
in the B6+ calls from the percentage of TEVs from
families considered to be inactive in the mouse lineage.
For the B6+calls, an estimation of the true false negative
rate was performed against the high confidence manually validated sets for chromosome 19 in 8 of the strains and the 250 selected PCR-validated SVs described in [26] (Additional file 4). In these PCR sets no false positives were detected.
In order to estimate false negative rates, we made a conservative assumption that the three 129-derived sub-strains (129P2/OlaHsd, 129S1/SvImJ and 129S5/ SvEvBrd) are monomorphic for any TEV. Therefore, we counted the number of TEVs where there was a call made in two out of the three 129-derived substrains and
assumed the missing call to be a false negative. For B6+
calls, we obtained false negative estimates of 13.3%, 14.4%, and 9.5% for SINE, LINE, and ERV classes, respec-tively (Additional file 4).
B6-validation
To measure the false positive rates of the B6-TEV calls,
we performed 53, 34 and 47 random PCRs across SINE, LINE, and ERV superfamilies, respectively. Primers were designed using Primer3 [66] and purchased from MWG (Ebersberg, Germany). For each insertion call, several independent PCR reactions were carried out, including two reactions with Hotstar Taq (Qiagen, Hilden, Ger-many), and a reaction with LongRange PCR Kit (Qiagen). Reactions were performed as previously described [67]. PCR gel images were then taken to assess the performance of the PCR reaction (Additional file 6). PCR products were purified in a 96-well Millipore (Billerica, MA, USA)
purifi-cation plate, resuspended in 30μl of H2O and sequenced
as previously described [67]. All sequencing reactions were run out on an ABI3700 sequencer and assembled using PHRED/PHRAP [68]. Consed was used for editing and visualization of the assembly [69]. Strains with and without the insertion were aligned in one single contig. Breakpoint analysis was mostly based on visual inspection of the align-ment after a BLAT search. Breakpoints were identified in alignments between sequences from strains with and with-out the insertion. PCR results are listed in Additional file 5. From these data, we estimate false positive rates to be 22%, 11%, and 0% for the three superfamilies (SINE, LINE, ERV), respectively. From the strain distribution patterns of the PCR, we estimated the false negative rates of the calls to be 7%, 12%, 5%, for SINE, LINE and ERV, respectively. We also estimated an upper bound on the false negative rate from the 129-derived substrains to be 28%, 32% and 12%, respectively.
We compared the datasets from previous publications [18,21,23,24] to estimate the fraction recapitulated in the
and 84% of calls from [21]; 23% of the SV calls in [23] are overlapped by our TEV calls in DBA/2J; and, of the full-length intronic LINE1 elements in [24], we recapitulate 76%. The overlaps may reflect differences in filtering cri-teria, and the non-zero false negative and false positive rates in these and our own studies.
In a recent publication, Liet al.[18] compared the IAP
calls and validations to the SV calls presented in [26]. The TEVs presented here have been updated since publication
and so we repeated this comparison. Of 12 B6+TEVs that
were considered, 3 are false negatives in our calls, which is in line with the null hypothesis that they are annotated as
the C57BL6/J variant. One B6-TEV appears to have been
called in error in CAST/EiJ and SPRET/EiJ, which accords with expectations based on a low, but non-zero, false posi-tive rate.
Expression comparison methods
For 14 of the strains, RNA was extracted from the whole brain of the sequenced mouse and a female sib-ling at 8 weeks of age using Trizol (Invitrogen, Carlsbad, CA, USA). RNA (RNA integrity number (RIN) > 8) was then used to generate transcriptome libraries, which were sequenced on the Illumina platform. Each lane of transcriptome sequence was re-genotyped prior to downstream analysis. The raw sequencing data have been submitted to the SRA under accession number ERP000614 (links can be found at [70]).
TopHat v1.1.1 [71] was deployed to map reads passing
Illumina’s chastity filter from each library to the mouse
genome assembly (mm9), including splice sites annotated in Ensembl and UCSC gene structures, known mRNAs, and expressed sequence tags [60], and to search for novel splice sites with a minimum isoform fraction as 0.0. Insert size and standard deviation were estimated from the full width at half maximum of the internal insert dis-tance based on reads mapped uniquely with bwa [72]. Cufflinks v0.9.2 [73] was then used to quantify expression of all Ensembl transcripts across all libraries. Bias correc-tion [74] and quantile normalizacorrec-tion were both enabled, and annotated mitochondrial transcripts and ribosomal RNAs were masked when determining the denominator of the fragments per kilobase of exon per million frag-ments mapped (FPKM) quantification to provide maxi-mally robust expression values.
which we had two biologically replicated RNA-Seq data sets. Read counts from strains with the TEV and strains without the TEV were randomly sampled and compiled into tables representing four measures (two strains each with two replicates) of expression for each gene in strains with the TEV and four for the strains without the TEV. For each gene sampled, a corresponding set was gener-ated from genes that are without TEVs in any strain. The resulting tables were analyzed using the DESeq R package to test for differential expression between RNAseq data sets. A Benjamini-Hochberg FDR of 10% was used as a cutoff for each of 100 resampling tests. Differentially expressed genes called in at least one-third of the tests were defined as being significantly differently expressed. A schematic representation of the method is provided in Additional file 12.
CTCF-binding TEVs and variance in expression
We intersected the B6+calls with the CTCF binding peaks
provided in a recent publication [47]. Expression variance in strains with or without an intergenic TEV was esti-mated by taking the log natural of the ratio of expression of the immediately upstream and downstream genes where expression data were available. Orientation (that is, which was considered upstream and downstream) was randomly permuted per gene set. The null hypothesis was that there is no difference in expression variance with respect to the CTCF-binding TEV, and this was tested
with analysis of variance (ANOVA) and rejected (P <
0.001). To test if this was a characteristic of TEVs in gen-eral, 10,000 random samples of expression ratios for TEVs not annotated as CTCF-binding were generated and tested
in the same manner. TheP-value for the CTCF-binding
TEV ANOVA test was smaller than all 10,000 non-CTCF-binding TEV-associated gene expression variance samples.
Availability of calls
The full set of TEV calls has been submitted to the Data-base of Genomic Variants archive DGVa at the European Bioinformatics Institute (estd118) [75] and has also been provided in BED file format (Additional file 13).
Distribution of TEVs across a phylogeny representing a primary subspecies history of 18 mouse strains
Ignoring incomplete lineage sorting, we calculated an approximate phylogenetic tree of mouse strains that would allow us to infer the internal node whose ancestral species acquired a TEV insertion (Figure 1). Using Seq-boot, Mix and Consense from the Phylip package [76], we considered the TEVs to be discrete morphologies and per-formed 100 bootstraps. All nodes of the resulting consen-sus tree were established with 100% reliability. TEVs were
mapped parsimoniously to the last common ancestral node of all strains carrying the TEV.
Structure and activities of ERV families
From the RepeatMasker [58] track of mm9 the number of bases belonging to each ERV family was calculated as the total amount of sequence annotated as one of the RepBase identifiers (Additional file 2). The proportion of ERVs that are TEVs was estimated from the number of bases in the
B6+TEV calls (Figure 2b). From the B6+structure
classifi-cations of the ERV TEVs mapped to the primary phylo-geny (Figure 1a) within the C57BL6/J lineage (Figure 1c), percentages of proviral-LTRs were calculated (Figure 2c, d). The average autosomal densities (TEV/bp), and the individual chromosome density ratios across all strains were also calculated (chromosome density/autosome den-sity; Figure 3b) for the set of all TEVs. The time between nodes AB and GH was taken to be 2 My [27], which, together with the proportion of ERVs found as solo-LTRs, also allowed an approximate half-life of provirus LTR
recombination rate to be calculated (l= Y × log(1/2)/log
(Z), where Y is the years of divergence and Z is the frac-tion of proviruses observed).
Genome-wide nucleotide composition, gene structure and gene annotation biases for TEV occurrence
C57BL6/J genomic TEs were identified from the Repeat-Masker [58] track of mm9 by excluding consecutive anno-tations of TEs in the same subfamily and by concatenating LTR bound sequences of a proviral structure. The local GC content was calculated from the 20 kb of sequence surrounding the TE (Figure 3a).
To calculate TEV density in different exons, introns, 5 kb flanks of genes and intergenic regions we used the Genomic Association Tester (GAT) [77]. GAT calculates an expected count through randomized simulations of the input data taking into account the observed segment length distribution. Simulations are performed per chro-mosome and isochore and so provide unbiased measures of the null expectation. Multiple testing corrections were applied with the Benjamini-Hochberg method [78]. GAT was also used within the various genomic spaces to test for significant association of TEVs to GOslim terms [79] (Figure 4b) and Mouse Genome Informatics overarching phenotype annotations [80-82] (Figure 4c).
Densities of TEVs with respect to chromosome
To test the chromosomal densities of TEVs and fixed TEs, we applied a cross-genome GAT test (as opposed to the default by chromosome tests). The null hypothesis was that fixed TEs and TEVs are equally distributed across the genome when taking into account G+C biases. The null
replication timing we used data downloaded from [37,83] and classified genomic sequence as being either early or late replicating as previously applied to neutral substitu-tion rates [84]. To take into account genic region biases, the genome was divided into genic versus intergenic space
according to the releaseMus musculus63 from Ensembl
[85]. Since taking replication timing nor genic regions into account for the GAT tests did not influence the chromo-somal biases, these were not included in the final analysis.
We applied the McDonald-Kreitman test [41] to chro-mosomal densities of TEVs and fixed TEs. Chromo-somes with a higher proportion of fixed TEs compared to TEVs were significantly dissimilar as determined by a G-test based on the number of TEVs compared to the density expected from fixed TEs (FDR 0.1%) [86,87].
Densities and orientations of TEVs with respect to the transcriptional (sense) direction of mouse genes
Orientation bias was calculated as the percentage of intronic TEVs present in the sense orientation. Dividing introns into those that are first, intervening or last within genes showed skewed distributions of TEV orien-tations. In Figure 5a we performed chi-square tests that showed significant differences for the occurrences of SINE and ERV TEVs depending on intronic space.
From the RepeatMasker [58] track of mm9 the sequence divergence from the prototypical sequence of
each B6+ TEV was taken as a measure of age of the
insertion. The percent divergence was divided into bins and the trend plotted (Figure 5b).
Densities of TEVs in the proximity of gene and exon boundaries
TEV densities were calculated upstream and down-stream (Figure 6a), and in introns near exon boundaries (Figure 6b); only mouse genes with orthologs in humans were considered, since this effectively discriminates against inaccurate gene models and noncoding RNA loci. Sense and antisense orientations, relative to the direction of gene transcription, were considered sepa-rately and TEVs with unresolved orientation were
disre-garded in this analysis. To treat B6+ and B6- TEVs
equivalently with respect to placing them on the
refer-ence genome (in which B6+ TEVs have an identifiable
length whereas B6- TEVs do not), the 5’base of each
TEV was taken to be the TEV’s location on the
refer-ence genome, regardless of orientations for TEV or gene. This procedure assumes that TEV properties are identical on the forward and reverse strands of assembled chromosomes in the reference genome. For each genomic space, upstream, downstream or intronic sequence, the maximum distance (the half-way point to the next gene or exon) was recorded. Distance from the
using the maximum number of bases in each span pre-sent in the genome. Using these scaled bin sizes, we cal-culated the density of TEVs (Number of TEVs within the relevant distances/Average number of bases over those distances). The bin sizes used in Figure 6a, b were taken from the Fibonacci series to allow improved visua-lization of the data relative to linear or logarithmic scaling.
Additional material
Additional file 1: Supplementary Table 1. Identifiers for mice
sequenced in this study.
Additional file 2: Supplementary Table 2. RepBase sequences used as
probes for identification of TEVs.
Additional file 3: Supplementary Figure 1. Proportions of TEVs along
different lineages of the phylogeny shown in Figure 1.(a, b)Proportions of TEV classes in the TE superfamilies and ERV subfamilies, respectively, on the 129S1/SVImJ and 129P2/OlaHsd lineages.(c,d)Proportions of TEV classes in the TE superfamilies and ERV subfamilies, respectively, on the A/J and BALB/cJ lineages.(e,f)Proportions of TEV classes in the TE superfamilies and ERV subfamilies, respectively, on the NOD/ShiLtJ and AKR/J lineages. Total numbers of predicted TEVs occurring between neighboring branch nodes are indicated below the x-axis.(g,h) Proportions of TEV classes in the TE superfamilies and ERV subfamilies, respectively, that are private to each strain. Numbers of TEVs called as being private to strains are indicated above the plots.
Additional file 4: Supplementary Table 3. Summary of validation
results. Percentages in parentheses denote the false negative rate estimated from concordance between 129P2/OlaHsd, 129S1/SvImJ and 129S5/SvEvBrd strains.
Additional file 5: Supplementary Table 4. B6-PCR true positive
validation results.
Additional file 6: Supplementary Figure 2. We show a representative
PCR gel image for one ERV (located on chromosome 9: 98,366,615-98,366,616), one LINE (chr10:23,570,601-23,570,602), and one SINE (chr1:162,157,648-162,157,649). PCR was carried out across eight strains: A/J, AKR/J, BALB/cJ, C3H/HeJ, C57BL/6J, CBA/J, DBA/2J and LP/J. We used Hyperladder II as size marker.
Additional file 7: Supplementary Figure 3. Gene annotation biases for
TEV occurrence. Gene annotations that are significantly enriched (green shades) or depleted (red shades) in exons, or intronic, 5 kb flanking or intergenic regions for TEV insertions, having accounted for GC content, chromosome and lengths, and after correcting for multiple testing.(a, b) Gene annotations are from either the Gene Ontology (slim set) (a) or the Mouse Genome Informatics phenotypes associated with gene disruptions (b). SINE TEVs show a pattern of enrichments and depletions that is the complement of patterns observed for LINE and ERV TEVs.
Additional file 8: Supplementary Table 5. Intronic TEVs associated
with differential gene expression across strains. The TEVs found to be associated with differential expression against the background of all TEVs with associated expression data and equal sampling of genes with no TEV insertions.
Additional file 9: Supplementary Table 6. Intronic TEVs with
associated genes’brain RNA-Seq expression values. The expression differences between the associated Ensembl genes with and without TEVs are significantly different as determined by ANOVA of log expression values with an FDR < 0.05.
Additional file 10: Supplementary Table 7. Intergenic TEVs with
Additional file 11: Supplementary Figure 4. Flow chart outlining how structural variants and B6+TEV calls were classified according to various superfamily classes and whether they were full-length.
Additional file 12: Supplementary Figure 5. Schematic overview of
the bootstrapping sampling method used to generate the high confidence list of gene expression changes associated with TEVs.
Additional file 13: Supplementary file 1. Tab deliminated file with all
the TEVs with strain distribution pattern. B6+TEVs are denoted as the default‘1’if the same as the reference and‘DEL’if called as absent in a strain. B6-TEVs are denoted as the default‘0’if the same as the reference and‘INS’if called as inserted in a strain. We conservatively estimate there to be 103,798 TEVs, although 110,930 TEVs classified in these files are due to instances of TEVs being annotated as different subfamilies in different strains (for example, LINE versus LINE_frag).
Abbreviations
ANOVA: analysis of variance; bp: base pair; CI: confidence interval; ERV: endogenous retrovirus; ETn: early transposon; FDR: false discovery rate; GAT: Genomic Association Tester; GO: Gene Ontology; IAP: intra-cisternal A particle; LINE: long interspersed nuclear element; LTR: long terminal repeat; MuLV: murine leukemia virus-like; My: million years; QTL: quantitative trait locus; SINE: short interspersed nuclear element; SV: structural variant; TE: transposable element; TEV: transposable element variant.
Acknowledgements
This study was funded by the Medical Research Council, UK and the Wellcome Trust. WNF is funded by National Institutes of Health (NIH) grant R01 NS031348. DJA is funded by Cancer Research UK and the Wellcome Trust. TGB was funded by the Intramural Research Program of the National Human Genome Research Institute. CN is funded by a MRC Biomedical Informatics Training Fellowship.
Author details
1MRC Functional Genomics Unit, Department of Physiology, Anatomy and Genetics, University of Oxford, South Parks Road, Oxford, OX1 3PT, UK.2The Wellcome Trust Sanger Institute, Wellcome Trust Genome Campus, Hinxton, Cambridge, CB10 1HH, UK.3Wellcome Trust Centre for Human Genetics, University of Oxford, Roosevelt Drive, Oxford, OX3 7BN, UK.4University of California, Los Angeles, California, 90095, USA.5National Human Genome Research Institute, National Institutes of Health, Bethesda, Maryland 20892, USA.6The Jackson Laboratory, Bar Harbor, Maine 04609, USA.
Authors’contributions
KW and BY performed the SV calling from which CN performed B6+calling. TK performed the B6-calling. CN, TK and BY performed the validations. WF, DA, CP, JF, TK and CN conceived and designed the study. JF performed the QTL merge analyses, and AA contributed to their interpretation. TGB performed the calling of brain RNA-Seq expression levels. CN performed analyses and statistics. CN, TK and CP wrote the core of the paper. All authors read and approved the final manuscript.
Competing interests
The authors declare that they have no competing interests.
Received: 4 April 2012 Revised: 25 May 2012 Accepted: 15 June 2012 Published: 15 June 2012
References
1. Gogvadze E, Buzdin A:Retroelements and their impact on genome evolution and functioning.Cell Mol Life Sci2009,66:3727-3742. 2. Shapiro JA:Mobile DNA and evolution in the 21st century.Mob DNA
2010,1:4.
3. Belancio VP, Hedges DJ, Deininger P:Mammalian non-LTR
retrotransposons: for better or worse, in sickness and in health.Genome Res2008,18:343-358.
4. Cordaux R, Batzer MA:The impact of retrotransposons on human genome evolution.Nat Rev Genet2009,10:691-703.
5. Stocking C, Kozak CA:Murine endogenous retroviruses.Cell Mol Life Sci 2008,65:3383-3398.
6. Maksakova IA, Romanish MT, Gagnier L, Dunn CA, van de Lagemaat LN, Mager DL:Retroviral elements and their hosts: insertional mutagenesis in the mouse germ line.PLoS Genet2006,2:e2.
7. Hedges DJ, Deininger PL:Inviting instability: Transposable elements, double-strand breaks, and the maintenance of genome integrity.Mutat Res2007,616:46-59.
8. de Koning A, Gu W, Castoe T, Batzer M, Pollock D:Repetitive elements may comprise over two-thirds of the human genome.PLoS Genet2011, 7:e1002384.
9. Goodier JL, Kazazian HH Jr:Retrotransposons revisited: the restraint and rehabilitation of parasites.Cell2008,135:23-35.
10. Waterston RH, Lindblad-Toh K, Birney E, Rogers J, Abril JF, Agarwal P, Agarwala R, Ainscough R, Alexandersson M, An P, Antonarakis SE, Attwood J, Baertsch R, Bailey J, Barlow K, Beck S, Berry E, Birren B, Bloom T, Bork P, Botcherby M, Bray N, Brent MR, Brown DG, Brown SD, Bult C, Burton J, Butler J, Campbell RD, Carninci P,et al:Initial sequencing and comparative analysis of the mouse genome.Nature2002,420:520-562. 11. Boeke J, Stoye J:Endogenous retroviruses and other retrovirus-like
LTR-containing elements.InRetroviruses.Edited by: Coffin J, Hughes S, Varmus H. Cold Spring Harbor, NY: Cold Spring Harbor Laboratory Press; 1997:. 12. Copeland NG, Hutchison KW, Jenkins NA:Excision of the DBA ecotropic
provirus in dilute coat-color revertants of mice occurs by homologous recombination involving the viral LTRs.Cell1983,33:379-387. 13. Duhl DM, Vrieling H, Miller KA, Wolff GL, Barsh GS:Neomorphic agouti
mutations in obese yellow mice.Nat Genet1994,8:59-65.
14. Morgan HD, Sutherland HG, Martin DI, Whitelaw E:Epigenetic inheritance at the agouti locus in the mouse.Nat Genet1999,23:314-318.
15. Stoye JP, Fenner S, Greenoak GE, Moran C, Coffin JM:Role of endogenous retroviruses as mutagens: the hairless mutation of mice.Cell1988, 54:383-391.
16. Fan H, Johnson C:Insertional oncogenesis by non-acute retroviruses: implications for gene therapy.Viruses2011,3:398-422.
17. Smit AF:Interspersed repeats and other mementos of transposable elements in mammalian genomes.Curr Opin Genet Dev1999,9:657-663. 18. Li J, Akagi K, Hu Y, Trivett AL, Hlynialuk CJ, Swing DA, Volfovsky N,
Morgan TC, Golubeva Y, Stephens RM, Smith DE, Symer DE:Mouse endogenous retroviruses can trigger premature transcriptional termination at a distance.Genome Res2012,22:870-884.
19. Medstrand P, van de Lagemaat LN, Mager DL:Retroelement distributions in the human genome: variations associated with age and proximity to genes.Genome Res2002,12:1483-1495.
20. van de Lagemaat LN, Medstrand P, Mager DL:Multiple effects govern endogenous retrovirus survival patterns in human gene introns.Genome Biol2006,7:R86.
21. Zhang Y, Maksakova IA, Gagnier L, van de Lagemaat LN, Mager DL: Genome-wide assessments reveal extremely high levels of polymorphism of two active families of mouse endogenous retroviral elements.PLoS Genet2008,4:e1000007.
22. Zhang Y, Romanish MT, Mager DL:Distributions of transposable elements reveal hazardous zones in Mammalian introns.PLoS Comput Biol2011,7: e1002046.
23. Quinlan AR, Clark RA, Sokolova S, Leibowitz ML, Zhang Y, Hurles ME, Mell JC, Hall IM:Genome-wide mapping and assembly of structural variant breakpoints in the mouse genome.Genome Res2010,20:623-635. 24. Akagi K, Li J, Stephens RM, Volfovsky N, Symer DE:Extensive variation
between inbred mouse strains due to endogenous L1 retrotransposition.
Genome Res2008,18:869-880.
25. Keane TM, Goodstadt L, Danecek P, White MA, Wong K, Yalcin B, Heger A, Agam A, Slater G, Goodson M, Furlotte NA, Eskin E, Nellaker C, Whitley H, Cleak J, Janowitz D, Hernandez-Pliego P, Edwards A, Belgard TG, Oliver PL, McIntyre RE, Bhomra A, Nicod J, Gan X, Yuan W, van der Weyden L, Steward CA, Bala S, Stalker J, Mott R,et al:Mouse genomic variation and its effect on phenotypes and gene regulation.Nature2011,477:289-294. 26. Yalcin B, Wong K, Agam A, Goodson M, Keane TM, Gan X, Nellaker C,