International Journal of Emerging Technology and Advanced Engineering
Website: www.ijetae.com (ISSN 2250-2459,ISO 9001:2008 Certified Journal, Volume 4, Issue 2, February 2014)
653
Intrusion Detection System using K- means, PSO with SVM
Classifier: A Survey
Harshit Saxena
1,
Dr. Vineet Richariya
21M.Tech. Scholar, 2Prof, Computer Science Engineering, LNCT Bhopal, Bhopal, India
Abstract--Intrusion detection is a process of identifying the Attacks. The main aim of IDS is to identify the Normal and Intrusive activities. In recent years, many researchers are using data mining techniques for building IDS. Here we propose a new approach using data mining technique such as SVM and Particle swarm optimization for attaining higher detection rate. The propose technique has major steps: Preprocessing, Training using PSO, clustering using K-means to generate different training subsets. Then based on the subsequent training subsets a vector for SVM classification is formed and in the end, classification using PSO is performed to detect Intrusion has happened or not. This paper contains summarization study and identification of the drawbacks of formerly surveyed works.
Keywords-- Intrusion detection system; Neuro-fuzzy; Support Vector Machine (SVM); PSO; K-means
I. INTRODUCTION
The purpose of the Intrusion detection system (IDS) is to prevent the computer system from attack. The IDS is the most essential part of the security infrastructure for the networks connected to the internet because various ways to compromise the stability and security of network. IDS can be classified into two types: Anomaly and Misuse detection. Anomaly detection system creates a database of normal behavior and any deviations from the normal behavior are occurred an alert is triggered regarding the occurrence of intrusions. Misuse Detection system stores the Predefined attack patterns in the database if a similar data and if similar situations occur it is classified as attack. Based on the source of data the intrusion detection system are classified to Host based IDS and Network based IDS. In network based IDS the individual packet flowing through the network are analyzed. The host based IDS analyzes the activities on the single computer or host. The main disadvantage of the misuse detection (signature detection) method is that it cannot detect novel attacks and variation of known attacks. To avoid these drawbacks we go for anomaly based detection methods. With this approach, known and novel attacks can be detected. The problem is that it will generate more false alarms [1].
The intrusion detection method based on unsupervised learning has a high detection rate but also a high False positive rate. The remaining part of this paper is organized as follows: Section 2 Describes IDS in general. Section 3 presents an overview of frequently occurring network attacks, and section 4 discusses related research done so far. Section 5 describes our proposed Method. Section 6 describes the future work.
II.INTRUSION DETECTION SYSTEM
IDS are system software that detects attack on a network or computer system. IDS are normally classified as Misuse detection and Anomaly detection [2]. In Misuse system the signature of known attacks are stored in database. Any data similar to that data is classified as attacks. Anomaly detection refers to statistical knowledge about normal activity. Intrusions correspond to deviations from the normal activity of system. The anomaly detection system has high false positive/ negative alarm rate compared to misuse detection systems [3].
III. NETWORKING ATTACK
Attacks were classified, according to the goal of attacker. Each attack type falls into one of the following four categories [4]:
Denials-of Service (DoS) attacks have the goal of limiting or denying services provided to the user, computer or network. (e.g. apache, smurf, Neptune, Ping of death, back, mail bomb, udpstorm, SYNflood, etc.).
Probing or Surveillance attacks have the goal of gaining knowledge of the existence or configuration of a computer system or network. Port Scans or sweeping of a given IPaddress range typically fall in this category. (e.g. saint, portsweep, mscan, nmap, etc.).
International Journal of Emerging Technology and Advanced Engineering
Website: www.ijetae.com (ISSN 2250-2459,ISO 9001:2008 Certified Journal, Volume 4, Issue 2, February 2014)
654 Remote-to-Local(R2L) attack is an attack in which a user sends packets to a machine over the internet, which the user does not have access to in order to expose the machine vulnerabilities and exploit privileges which a local user would have on the computer (e.g. xclock, dictionary, guest_password, phf, sendmail, xsnoop, etc.).
IV. RELATED RESEARCH WORK ON IDS
In the last decade various approaches have been developed in order to detect the Intrusion. Earlier there are two approaches, rule based expert system and statistical approaches. A rule based expert system can select well known intrusion with high detection rate but it is difficult to detect new Intrusion and its signature database need to be updated manually and frequently. Statistical based IDS employ various statistical method including Principal component analysis, Cluster and Multivariate Analysis, Bayesian Analysis etc.
To overcome the drawback of rule based expert system and statistical approaches, a number of data mining technique have been introduced. ANN (Artificial Neural Network) is one the most widely used and work successfully on Intrusion detection. Different types of ANN are used in IDS like Supervised, Unsupervised and Hybrid ANN [5].
Jirapummin et al.[6] proposed employing a hybrid ANN for both visualizing intrusions using Kohenen‟s SOM and classifying intrusions using resilient propagation neural networks. Horeis [7] used a combination of SOM and radial basis function (RBF) networks. The system offers generally better results than IDS based on RBF networks alone. Han and Cho [8] proposed an intrusion detection technique based on evolutionary neural networks in order to determine the structure and weights of the call sequences. Chen, Abraham, and Yang [9] proposed hybrid flexible neural-tree –based IDS based on flexible neural neural-tree, evolutionary algorithm and particle swarm optimization (PSO). Empirical results indicated that the proposed method is efficient. For ANN based intrusion detection, hybrid ANN has been the trend. But, different ways to construct hybrid ANN will highly influence the performance of intrusion detection. In [10], Axellson wrote a well-known paper that uses the Bayesian rule of conditional probability to point out that implication of the base-rate fallacy for intrusion detection. In [11], a behavior model is introduced that uses Bayesian techniques to obtain model parameters with maximal a posteriori probabilities.
Following this torrent, we propose an approach for intrusion detection, which is a combination of k-means, PSO and SVM techniques to enhance detection precision.
V.PROPOSED METHOD
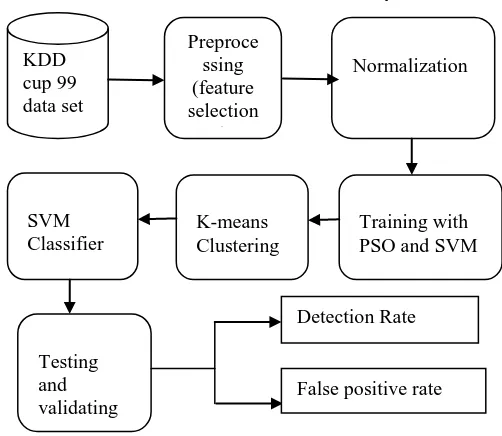
In this section, we elaborate our new proposed approach. Our approach shown in figure 1.
A.KDD cup 1999 Dataset
The data set provided for the 1999 KDD Cup was originally prepared by MIT Lincoln labs for the 1998 Defense Advanced Research Projects Agency (DARPA) Intrusion Detection Evaluation Program, with the objective of evaluating research in intrusion detection, and it has become a benchmark data set for the evaluation of IDSs.It Contains approximately 49, 00,000 data instances. Attacks fell in one of the following categories: DOS-Denial of Service (e.g. a mail bomb), R2L- Unauthorized access from a remote machine (e.g. sendmail), U2R-Unauthorized access to super user or root functions (e.g. a buffer overflow attack), Probing-surveillance and other probing for vulnerabilities (e.g. port scanning)[12]. In this paper we will use the subset of the original dataset which consist the distinct records.
B.Feature Selection
Data Preprocessing is the important task for reducing the attribute of KDD cup 1999 dataset. This process is carried out in two steps. The first step involves mapping symbolic-valued attributes to numeric valued attributes. In second step attributes are reduced by using Information gain. The KDD dataset has 41 attributes and after applying information gain approx 21 attributes remain.
C.Normalization
Since our algorithm is designed to be general, it must be able to create clusters given a dataset from an arbitrary distribution. A problem with typical data is that different features are on different scales. This cause bias toward some features over other features. To solve this problem, we convert the data instances to a standard form based on the training dataset's Distribution. That is, we make the assumption that the training dataset accurately reflects the range and deviation of feature values of the entire distribution. Then, we can normalize all data instances to a fixed range of our choosing, and hard code the cluster width based on this fixed range [13].
D.Particle Swarm Optimization
International Journal of Emerging Technology and Advanced Engineering
Website: www.ijetae.com (ISSN 2250-2459,ISO 9001:2008 Certified Journal, Volume 4, Issue 2, February 2014)
655 Particle Swarm has two primary operators: Velocity update and Position update. During each generation each particle is accelerated toward the particles previous best position and the global best position. At each iteration a new velocity value for each particle is calculated based on its current velocity, the distance from its previous best position, and the distance from the global best position. The new velocity value is then used to calculate the next position of the particle in the search space. This process is then iterated a set number of times or until a minimum error is achieved [14]. The PSO algorithm proceeds as follows :
1: procedure PSO 2: repeat
3: for i = 1 to number of individuals do 4: if G(~xi) > G(~pi) then . G() evaluates goodness 5: for d = 1 to dimensions do
6: pid = xid . pid is the best state found so far
7: end for 8: end if
9: g = i . arbitrary
10: for j = indexes of neighbors do 11: if G(~pj) > G(~pg) then
12: g = j . g is the index of the best performer in the
Neighborhood 13: end if
14: end for
15: for d = 1 to number of dimensions do 16: vid(t) = f(xid(t − 1), vid(t − 1), pid, pgd) .
update velocity 17: vid 2 (−Vmax,+Vmax)
18: xid(t) = f(vid(t), xid(t − 1)) . update position 19: end for
20: end for
21: until stopping criteria 22: end procedure
E.K-means Clustering
K-means clustering [15] is one of the simplest unsupervised clustering algorithms. The algorithm takes input parameter „k‟ and partition the „n‟ dataset into k cluster so that the intra-cluster similarity is high and inter-cluster similarity is low. „K‟ is a positive integer number given in advance. K means clustering takes less time as compared to the hierarchical clustering and yields better results.
With the help of clustering training dataset is clustered into 5 dataset wherein 4 dataset will be a type of intrusion called attack dataset and one with normal data type called normal dataset. Here are the four steps of the clustering algorithms:
1)Define the number of clusters K.
2)Initialize the K cluster centroids. This can be done by arbitrarily dividing all objects into K clusters, computing their centroids, and verifying that all centroids are different from each other. Alternatively, the centroids can be initialized to K arbitrarily chosen, different objects.
3)Iterate over all objects and compute the distances to the centroids of all clusters. Assign each object to the cluster with the nearest centroid.
4)Recalculate the centroids of both modified clusters. 5)Repeat step 3 until the centroids do not change any
more.
A distance function is required in order to compute the distance (i.e. similarity) between two objects. The most commonly used distance function is the Euclidean one which is defined as:
d(x,y) = √∑
Where x = (x1 . . . xm) and y = (y1…ym) are two input vectors with m quantitative features. In the Euclidean distance function, all features contribute equally to the function value. However, since different features are usually measured with different metrics or at different scales, they must be normalized before applying the distance function.
F.SVM Classifier
SVM classifier [16] is used to produce better result for binary classification when compared to other classifier. In our proposed technique non linear kernel function are used and resulting maximum margin hyper-plane fits in a transformed feature space is a Hilbert space of infinite dimensions. The Gaussian Radial Basics function is given by the equation below.
The x‟ defines the center of radial basis function, the vector „x‟ is the pattern applied to the input. is a measure of width of “ x‟ ” Gaussian function with center x‟.
International Journal of Emerging Technology and Advanced Engineering
Website: www.ijetae.com (ISSN 2250-2459,ISO 9001:2008 Certified Journal, Volume 4, Issue 2, February 2014)
656 G.Testing and Validation
For our experiments we are using KDD CUP 99 dataset. KDD CUP 1999 contains 41 fields as an attributes and 42nd field as a label. In our algorithm we have taken selected features. The 42nd field can be generalized as Normal, DoS, Probing, U2R, and R2L. The description of KDD CUP 99 used for our method shown in table 1[17]. The performances of each method are measured according to the Accuracy, Detection Rate and False Positive Rate using the following expressions:
Accuracy =
Detection Rate =
False Alarm =
Where
FN is False Negative TN is True Negative TP is True Positive FP is False Positive
[image:4.612.322.573.130.348.2]The detection rate is the number of attacks detected by the system divided by the number of attacks in the data set. The false positive rate is the number of normal connections that are misclassified as attacks divided by the number of normal connections in the data set.
Table 1:
shows the number of examples in 10% training and testing data of KDD 99.
Attack Types Training example Testing example
Normal 97277 60592
Denial of Service 391458 237594
Remote to user 1126 8606
User to Root 52 70
Probing 4107 4166
Total Attack 494020 311029
Figure 1. Block Diagram of our proposed technique.
VI. CONCLUSION AND FUTURE WORK
Intrusion Detection is a process of detection Intrusion in a computer system in order to increase the security. Intrusion detection is an area in which more and more sensitive data are stored and processed in networked system. After reading several research works, we come with several advantage and disadvantage. We analyze that there are several technique which provide good detection rate in case of Denial of Service (DoS) attack. But fail to achieve good detection rate in case of U2R and R2L attack.
REFERENCES
[1] Feng Guorui, Zou Xinguo, Wu Jian,” Intrusion detection based on
the semi supervised Fuzzy C- Means clustering algorithm”, Department of Information Science Technology, Shandong University, China,pp. 2667-2670,2012.
[2] R.Durst, T.champion, B.witten, E.Miller, and L.Spagnuolo,
"Testing and valuating computer intrusion detection system" communications of ACM, Vo1.42, no.7, pp 53-61, 1999. KDD
cup 99 data set Dataset with attribute and class labels
Preproce ssing (feature selection
using informati
on gain)
Normalization
Training with PSO and SVM K-means
Clustering SVM
Classifier
Testing and validating the performanc e
Detection Rate
International Journal of Emerging Technology and Advanced Engineering
Website: www.ijetae.com (ISSN 2250-2459,ISO 9001:2008 Certified Journal, Volume 4, Issue 2, February 2014)
657
[3] Neethu B, “Classification of Intrusion Detection Dataset using
machine learning approaches” proceeding of IJECSE, pp 1044-1051, 2013.
[4] A.Sung & S.Mukkamala, "Identifying important features for
intrusion detection using SVM and neural networks," in symposium on application and the Internet, pp 209-216, 2003.
[5] A.M Chandrasekhar, K.Raghuveer,”Intrusion detection technique
by using K-means, Fuzzy Neural Network and SVM classifiers”, proceedings of ICCCI,pp1-7,2013.
[6] Jirapummin,C.,Wattanapongsakorn, N., & Kanthamanon,
P.”Hybrid neural networks for intrusion detection system”. Proceedings of ITCCSCC,pp 928-931,2002.
[7] Horeis, T “Intrusion detection with neural network – Combination
of self organization maps and radial basis function networks for human expert integration”, a Research report 2003.
[8] Han, S J & Cho, S. B. “Evolutionary neural networks for anomaly
detection based on the behavior of a program”, IEEE Transaction on System,Man and Cybernetics,pp 559-570,2005.
[9] Chen, Y. H., Abraham, A., & Yang, B, “Hybrid flexible neural-tree-based intrusion detection systems”, International Journal of Intelligent Systems,pp. 337-352,2007.
[10] S. Axelsson, "The base rate fallacy and its implications for the difficulty of Intrusion detection" , Proc. Of 6th.ACM conference on computer and communication security 1999.
[11] R.Puttini, Z.marrakchi, and L. Me, "Bayesian classification model
for Real time intrusion detection" , Proc. of 22nd. International workshop on Bayesian inference and maximum entropy methods in science and engineering, 2002.
[12] A.M Chandrasekhar, K.Raghuveer,”Performance evaluation of
data clustering techniques using KDD cup 99 intrusion data set”,International journal of information and network security, Vol1(4),pp. 294-305,2012.
[13] Sanjay Kumar Sharma, Pankaj Pandey , Susheel Kumar Tiwari
and Mahendra Singh Sisodiya,” An Improved Intrusion Detection Based on K-means Clustering via Naïve Bayes Classification”, proceedings of ICAESM, pp. 417-422,2012.
[14] Matthew Settles,” An Introduction to Particles Swarm
Optimization”, department of Computer Science, Idaho University.
[15] Pankaj Pandey , Sanjay Kumar Sharma, Mahendra Singh Sisodiya
and Susheel Kumar Tiwari” An Improved Intrusion Detection Based on K-means Clustering via Naïve Bayes Classification”, proceedings of ICAESM, pp. 417-422,2012.
[16] MacQueen, Some methods for classification and analysis of
multivariate observations in Proceedings of 5th Berkeley Symposium on Mathematical Statistics and Probability. University of California Press,1967,pp. 281-297.
[17] A.M Chandrasekhar, K.Raghuveer,”Intrusion detection technique