International Journal of Emerging Technology and Advanced Engineering
Website: www.ijetae.com (ISSN 2250-2459, Volume 2, Issue 7, July 2012)433
Iris Recognition Using Independent Component Analysis
Kshamaraj Gulmire
1, Sanjay Ganorkar
21 Department of ETC Engineering, Sinhgad College of Engineering, M.S.,Pune. 2 Department of ETC Engineering, Sinhgad College of Engineering, M.S.,Pune.
Abstract— The iris recognition is a kind of the biometrics technologies based on the physiological characteristics of human body, compared with the feature recognition based on the fingerprint, palm-print, face and sound etc, the iris has some advantages such as uniqueness, stability, high recognition rate, and non-infringing etc. The iris recognition is using independent component analysis can produce spatially global features. In this paper we use the feature extraction algorithm based on ICA for a compact iris code. And for segmentation of iris image is based on Daugman’s method using integrodifferential operator. We use independent component analysis to generate optimal basis elements which could represent iris signals efficiently. In practice the coefficient of this method are used as feature vectors. Then iris feature vectors are encoded into the iris code for storing and comparing individual's iris patterns.
Keywords— Biometric recognition, ICA, image segmentation, iris localization, iris recognition.
I. INTRODUCTION
Iris recognition is a biometric-based method of identification. This method has many advantages, such as unique, stability, can be collected, nonaggressive, etc. The iris recognition's error rate is the lowest in most biometric identification method. Now many research organizations at home and abroad spend a lot of time and energy to do research of iris recognition [13].
Biometric recognition refers to the process of matching an input biometric to stored biometric information. In particular, biometric verification refers to matching the live biometric input from an individual to the stored biometric template about that individual [1]. Examples of biometrics include face images, fingerprint images, iris images, retinal scans, etc. Thus, image processing techniques prove useful in the biometric recognition. The field of biometrics utilizes computer models of the physical and behavioral characteristics of human beings with a view to reliable personal identification. The human characteristics of interest include visual images, speech, and indeed anything which might help to uniquely identify the individual.
Most current authentication systems are password based making them susceptible to problems such as forgetting the password and passwords being stolen. One way to overcome these problems is to employ biometrics (e.g., fingerprints, face, iris pattern, etc.) for authentication. Another important application is to match an individual’s biometrics against a database of biometrics. An example application of biometric identification is the matching of fingerprints found at a crime scene to a set of fingerprints in a database [11]. Authentication problem has narrower scope, but the matching technologies are applicable to both verification and identification problems [10]. Many biometric sensors output images and thus image processing plays an important role in biometric authentication. Image preprocessing is important since the quality of a biometric input can vary significantly. For example, the quality of a face image depends very much on illumination type, illumination level, detector array resolution, noise levels, etc [3]. Preprocessing methods that take into account sensor characteristics must be employed prior to attempting any matching of the biometric images. The use of biometric systems has been increasingly encouraged by both government and private entities in order to replace or increase traditional security systems.
International Journal of Emerging Technology and Advanced Engineering
Website: www.ijetae.com (ISSN 2250-2459, Volume 2, Issue 7, July 2012)434
Boles and Boashash [2] proposed a novel iris recognition algorithm based on zero crossing detection of the wavelet transform, this method has only obtained the limited results in the small samples, and this algorithm is sensitive to the grey value changes, thus recognition rate is lower. In another method followed by Jie Wang [7] the iris texture extraction is performed by applying wavelet packet transform (WPT) using Haar wavelet. The iris image is decomposed in to sub images by applying WPT and suitable sub images are selected and WPT coefficients are encoded.One more technique to extract the feature is Haar wavelet decomposition. Tze Weng Ng, Thein Lang Tay, Siak Wang Khor [8], has proposed Haar wavelet decomposition method for feature extraction. It acquires an accuracy using complex neural network matching method. Coefficients obtained from the decomposition of are then converted to binary codes to be used on calculation of hamming distance for matching purpose. Zhonghua Lin, Bibo Lu [9], has proposed iris recognition based on the optimized gabor filters. The recognition rate is high, the recognition speed is guaranteed. Iris recognition will need in future for security.
II. CASIA DATABASE
The data samples used in our experiments were taken from the Chinese academy of Sciences (CAS) [13]. Iris recognition has been an active research topic in recent years due to its high accuracy. There is not any public iris database while there are many face and fingerprint databases. Lack of iris data for algorithm testing is a main obstacle to research on iris recognition. To promote the research, National Laboratory of Pattern Recognition (NLPR), Institute of Automation(IA), Chinese Academy of Sciences(CAS) will provide iris database freely for iris recognition researches.
CASIA Iris Image Database (ver 1.0) includes 756 iris images from 108 eyes (hence 108 classes). For each eye, 7 images are captured in two sessions, where three samples are collected in the first session and four in the second session. CASIA Iris Image Database (CASIA-Iris) developed by our research group has been released to the international biometrics community and updated from IrisV1 to IrisV3 since 2002. CASIA-IrisV4 is an extension of CASIA-IrisV3 and contains six subsets. The three subsets from IrisV3 are CASIA-Iris-Interval, CASIA-Iris-Lamp, and CASIA-Iris-Twins respectively. The three new subsets are CASIA-Iris-Distance, CASIA-Iris-Thousand, and CASIA-Iris-Syn.
CASIA-IrisV4 contains a total of 54,601 iris images from more than 1,800 genuine subjects and 1,000 virtual subjects. All iris images are 8 bit gray-level JPEG files, collected under near infrared illumination or synthesized. The six data sets were collected or synthesized at different times and Iris-Interval, Iris-Lamp, CASIA-Iris-Distance, CASIA-Iris-Thousand may have a small inter-subset overlap in subjects. More than 3,000 users from 70 countries or regions have downloaded CASIA-Iris and much excellent work on iris recognition has been done based on these iris image databases. Although great progress of iris recognition has been achieved since 1990s, the rapid growth of iris recognition applications has clearly highlighted two challenges, i.e. usability and scalability. Most current iris recognition methods have been typically evaluated on medium sized iris image databases with a few hundreds of subjects. However, more and more large-scale iris recognition systems are deployed in real-world applications. Many new problems are met in classification and indexing of large-scale iris image databases. So scalability is another challenging issue in iris recognition.
III. PRE-PROCESSING
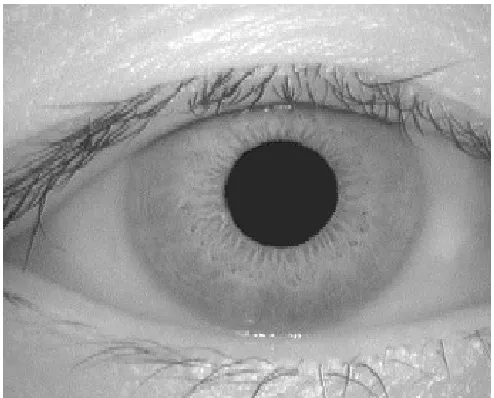
[image:2.612.328.575.470.669.2]Here consider iris pictures from CASIA database to preprocess & ICA use for feature extraction. And for segmentation Duagman’s method is used. As shown in figure 1 is specimen image from database.
International Journal of Emerging Technology and Advanced Engineering
Website: www.ijetae.com (ISSN 2250-2459, Volume 2, Issue 7, July 2012)435
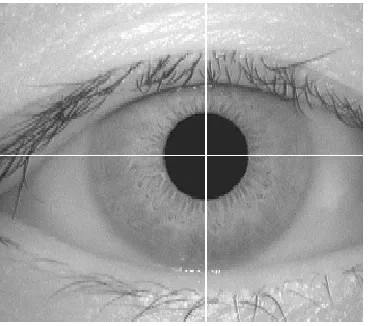
For segmentation purpose Daugman method is used, first consider histogram of specimen image for pupil centre, we get pupil localization in figure 2.
Figure 2. Pupil Localization
The result of segmentation of iris image by Daugman’s method using integrodifferential operator is shown in figure 3.
[image:3.612.90.275.204.367.2]Figure 3. Segmented Image
IV. NDEPENDENT COMPONENT ANALYSIS
Independent component analysis (ICA) is a statistical and computational technique for revealing hidden factors that underlie sets of random variables, measurements, or signals.
ICA defines a generative model for the observed multivariate data, which is typically given as a large database of samples. In the model, the data variables are assumed to be linear mixtures of some unknown latent variables, and the mixing system is also unknown. The latent variables are assumed nongaussian and mutually independent, and they are called the independent components of the observed data. These independent components, also called sources or factors, can be found by ICA.
ICA is superficially related to principal component analysis and factor analysis. ICA is a much more powerful technique, however, capable of finding the underlying factors or sources when these classic methods fail completely. The data analyzed by ICA could originate from many different kinds of application fields, including digital images, document databases, economic indicators and psychometric measurements. In many cases, the measurements are given as a set of parallel signals or time series; the term blind source separation is used to characterize this problem. Typical examples are mixtures of simultaneous speech signals that have been picked up by several microphones, brain waves recorded by multiple sensors, interfering radio signals arriving at a mobile phone, or parallel time series obtained from some industrial process.
When the independence assumption is correct, blind ICA separation of a mixed signal gives very good results. It is also used for signals that are not supposed to be generated by a mixing for analysis purposes. A simple application of ICA is the ―cocktail party problem‖, where the underlying speech signals are separated from a sample data consisting of people talking simultaneously in a room. Usually the problem is simplified by assuming no time delays or echoes. An important note to consider is that if N sources are present, at least N observations (e.g. microphones) are needed to get the original signals. This constitutes the square (J = D, where D is the input dimension of the data and J is the dimension of the model).
Other cases of underdetermined (J < D) and
overdetermined (J > D) have been investigated.
ICA finds the independent components (aka factors, latent variables or sources) by maximizing the statistical independence of the estimated components. We may choose one of many ways to define independence, and this choice governs the form of the ICA algorithms. The two broadest definitions of independence for ICA are
International Journal of Emerging Technology and Advanced Engineering
Website: www.ijetae.com (ISSN 2250-2459, Volume 2, Issue 7, July 2012)436
The Non-Gaussianity family of ICA algorithms, motivated by the central limit theorem, uses kurtosis and negentropy. The Minimization-of-Mutual information (MMI) family of ICA algorithms uses measures like Kullback-Leibler Divergence and maximum-entropy. Typical algorithms for ICA use centering, whitening (usually with the eigenvalue decomposition), and dimensionality reduction as preprocessing steps in order to simplify and reduce the complexity of the problem for the actual iterative algorithm. Whitening and dimension reduction can be achieved with principal component analysis or singular value decomposition. Whitening ensures that all dimensions are treated equally a priori before the algorithm is run. Algorithms for ICA include infomax, FastICA, and JADE, but there are many others also. In general, ICA cannot identify the actual number of source signals, a uniquely correct ordering of the source signals, nor the proper scaling (including sign) of the source signals. ICA is important to blind signal separation and has many practical applications. It is closely related to (or even a special case of) the search for a factorial code of the data, i.e., a new vector-valued representation of each data vector such that it gets uniquely encoded by the resulting code vector (loss-free coding), but the code components are statistically independent.
Imagine that in a room where two people are speaking simultaneously. There are two microphones, which you hold in different locations. The microphones give you two recorded time signals, which we could denote by x1(t) and x2(t), with x1 and x2 the amplitudes, and t the time index. Each of these recorded signals is a weighted sum of the speech signals emitted by the two speakers, which we denote by s1(t) and s2(t). We could express this as a linear equation,
x1(t) = a11 s1 + a12 s2 (3) x2(t) = a21 s1 + a22 s2 (4)
where, a11, a12, a21 and a22 are some parameters that depend on the distances of the microphones from the speakers. It would be very useful if you could now estimate the two original speech signals s1(t) and s2(t), using only the recorded signals x1(t) and x2(t). This is called the cocktail-party problem. To this problem, the usually method is independent component analysis.
As we know, there is much information in higher order statistics that can't be omitted, to non-Gaussian signal. Therefore we also use ICA to extract features of the iris regions.
As mentioned above, we can think the iris regions like this:
X = as (5)
where X are column vectors that have mx1 dimensions;
a = (a1 ,a2 … …an ) is a m×n matrix that is a basis function;
n is the number of basis functions;
s = (s1 ,s2 … …sn ) are column vectors that have n×1 dimensions.
Each of is a feature coefficient. Therefore a X is equal to linear superposition of
a = (a1 ,a2 … …an ) and s = (s1 ,s2 … …sn )′
To all pictures, the basis functions are the same. The difference is the coefficient vector s = (s1 ,s2 … …sn )′. Therefore every picture can be denoted by its feature coefficient vector.
Without loss of generality, we suppose
a = (a1 ,a2 … …an ) is a invertible matrix. So based function (4), we can get this:
S = wX (6) where, s = is coefficient vector of this picture; w =(w1 ,w2 … …wn )′ is the inverse function of a, w = a-1, we call it transition matrix. Every coefficient vector si can be expressed the forms that w multiply X.
The most important supposing of ICA is that is independent, and meet the super-Gaussian distribution. Therefore, the problem of ICA is inducted to how to get the basis function a and its transition matrix w and make the feature coefficient s to meet the super-Gaussian distribution and independent, from the training samples
I = {xk, k = 1,2,……,N} where N is the number of the training samples.
I = as (7)
There are many statistical methods that measure whether variable meets the super Gaussian distribution. We use FastICA algorithm to make s to meet super-Gaussian distribution. As we know, in all random variables, variables of Gaussian distribution have the maximum entropy. Therefore, in FastICA, we use the measuring function
J(y) ≈ c [E{G(y)} – E{G(ν)}]2 (8)
where v is a Gaussian random variable that mean is 0, and variance is 1; and G is non quadratic function; we usually take:
(9)
(10)
International Journal of Emerging Technology and Advanced Engineering
Website: www.ijetae.com (ISSN 2250-2459, Volume 2, Issue 7, July 2012)437
We put the problem mentioned above to change into an optimization problem. We can use the fixed-point iteration method to solve the optimization problem.
To simplify the calculation, we need two following preprocessing:
1) Centering. We take the original training samples to minus the mean, and make the mean of the training samples after centering is zero.
2) Whitening. We have to make the training samples variance is one and independent. Therefore, we can get the aim of dimension reduction, and reduce the computational effort.
After feature extraction of figure 1, get figure 5.
Figure 4. Normalized Unwrapped Iris
Figure 5. Centered Component
V. EXPERIMENTAL RESULTS
We use images of eyes from 10 persons, and every person has six images of eyes. The top three images are used as test images and the next three images are used for training purpose. We use the Daugman’s methods to iris regions segmentation and use Independent Component Analysis for feature extraction. At last, in the identification stage we calculate Euclidean distance between a test image & a training image. The smallest distance among them is expressed, that test image belongs to this class.
[image:5.612.322.566.337.698.2]The recognition rate is showed in table I.
TABLE I. EXPERIMENTAL RESULTS
Independent Component Analysis 89.5%
VI. CONCLUSION
The Independent Component Analysis is one of the most successful techniques used in image recognition. The
Independent Component Analysis reduces the
dimensionality of the training set, leaving only those features that are critical for iris recognition. Iris recognition is a fast developing art. It is a classic biometric application.
ACKNOWLEDGMENT
The research in this paper was carried out at Sinhgad College of Engineering, Pune. So, special thanks to Guide,
PG Co-ordinator, Head of Electronics and
Telecommunication Department, Principal and
Management of Sinhgad College of Engineering.
REFERENCES
[1] J. G. Daugman, "High Confidence Visual Recognition of Persons by a Test of Statistical Independence", IEEE Trans. Pattern Analysis and Machine Intelligence, vol. 15, pp. 1148-1161, Nov. 1993.
[2] W. Boles, B. Boashash. A human identification technique using images of the iris and wavelet transform. IEEE Transaction on Signal Processing, 1998, 46(4), pp.1185–1188
[3] Lye Wil Liam, Ali Chekima, Liau Chung Fan, “Iris recognition
using self-organizing neural network”, IEEE 2002.
[4] Daugman G. , "How Iris Recognition Works" , IEEE Transaction on Circuits and System for Video Technology , vol . 14, no. I, pp . 21-30,2004.
[5] U.M. Chaskar, M.S. Suataone, “A Novel Approach for Iris
Recognition”, IEEE 2010
[6] Lin Zhonghua, Lu Bibo, “Iris Recognition Method Based on the
Coefficients of Morlet Wavelet Transform”, IEEE 2010
[7] Jie Wang, Xie Mei, “Iris Feature extraction based on wavelet
packet analysis”, IEEE 2006.
[8] Tze Weng Ng, Thien Lang Tay, Siak Wang Khor, “Iris
Recognition using Rapid Haar Wavelet Decomposition”, IEEE
2010.
[9] Zhonghua Lin, Bibo Lu, “Iris Recognition Method Based on the
Optimized Gabor Filters”, IEEE 2010.
[10] L.Masek.(2003). "Recognition of human iris patterns for biometricidentification"
[Online].Available:http://www.csse.uwa.edu.au/~pk/studentproject s/libor/LiborMasekThesis.pdf
[11] R. P. Wildes, "Iris recognition: an emerging biometric technology," Proc IEEE, vol. 85, pp. 1348- 1363, 1997.
[12] Pearson, K. (1901). "On Lines and Planes of Closest Fit to Systems of Points in Space" (PDF). Philosophical Magazine 2 (6): 559-572. http://stat.smmu.edu.cnihistory/pearsonI90 l.pdf.