MEASURING MISALIGNMENT OF VALVE SEATS USING EDDY CURRENT INSPECTION METHOD
FIRDAUS BIN ALI
A project report submitted in partial
fulfillment of the requirement for the award of the Degree of Master of Electrical and Electronic Engineering
Faculty of Electrical and Electronic Engineering Universiti Tun Hussein Onn Malaysia
ABSTRACT
vi
ABSTRAK
CONTENTS
TITLE i
DECLARATION ii
DEDICATION iii
ACKNOWLEDGEMENT iv
ABSTRACT v
CONTENTS vii
LIST OF TABLES x
LIST OF FIGURES xi
LIST OF APPENDICES xiv
CHAPTER 1 INTRODUCTION
1.1 Introduction 1
1.2 Problem statement 3
1.3 Objectives 3
1.4 Scopes 4
1.5 Significance of the study 4
1.6 Thesis arrangement 4
CHAPTER 2 LITERATURE REVIEW
viii
2.2 Valve seats 6
2.2.1 Valve seats failure 8
2.2.2 Valve seats gap measurement 10
2.3 COMSOL Multiphysics 14
2.3.1 Modeling and simulating eddy current 15
2.4 Eddy current testing 20
2.4.1 Eddy current testing principles 21 2.4.1.1 Electromagnetic induction and 21
eddy current inspection
2.4.1.2 Complex impedance plane 23
2.4.1.3 Non-ferromagnetic material approach 24 2.4.1.4 Ferromagnetic material approach 25 2.4.1.5 Eddy current transformer model 26 2.4.1.6 Magnetic field sensors for eddy 28
current testing
2.5 Summary 29
CHAPTER 3 METHODOLOGY
3.1 Introduction 30
3.2 Information collection 30
3.2.1 PROTON engine block machining 31
3.3 Elements of eddy current inspection system 32
3.3.1 Proposed instrument setup 33
3.3.2 Material selection 34
3.4.1 Eddy current on parts 38
3.5 Eddy current flaw detection probe 42
3.5.1 Single coil probe 42
3.5.2 Bridge type probe 43
3.5.3 Reflection type probe 43
3.5.4 Oscillator circuit simulation 44
3.6 Summary 45
CHAPTER 4 RESULTS AND DISCUSSION
4.1 Introduction 46
4.2 Simulation setup 46
4.3 Simulation results 47
4.4 Oscillator circuit simulation 55
4.4 Summary 56
CHAPTER 5 CONCLUSION AND RECOMMENDATION
5.1 Justification of the objectives 58
5.2 Recommendation 60
REFERENCES 61
x
LIST OF TABLES
3.1 Material properties 35
LIST OF FIGURES
2.1 Valve seats. (Digital images, Valency Parts) 7 <www.valencypart.com>
2.2 Valve recession [7]. 8
2.3 Gap measurement method using camera [9]. 11
2.4 Gap measurement device [9]. 12
2.5 IR thermal image system [10]. 13
2.6 Front view of a solved 3D finite element 15
half-model simulating the x component of the current density for the CDDP probe used in the experiment [11].
2.7 Design of the modular eddy current sensor [12]. 17
2.8 Simulation result for the sensor is placed 18
exact on surface of the sample when 400 A/m [12].
2.9 Simulation result for half of the sensor is placed 18 on the surface of the sample when 600 A/m [12].
2.10 COMSOL model of eddy currents around 19
a crack [13].
2.11 Primary and secondary magnetic field. 23
Eddy current on the test piece [18].
2.12 Normalized impedance plane. Lift-off 24
curves and crack displacement at impedance plane for 2 values of conducticity P1 and P2 [16].
2.13 Altered eddy current flow by a crack on 25
the surface [15].
2.14 Impedance plane for ferromagnetic and 25
non-ferromagnetic materials [15].
2.15 Model of coil-target interaction based 26
on a transformer [16].
xii
3.2 Fully automated engine block machining line. 31
3.3 Block diagram of eddy current system [15]. 32
3.4 (a) Typical loop of a complex impedance plane 33 of a differential probe inside a tube affected
by a flaw [17].
(b) Real and imaginary part of impedance change vs. time [17].
3.5 Inspection method. 34
3.6 Geometry of cylinder head and valve seat. 39
3.7 Test piece geometry dimensions. 40
3.8 Geometry of the boundary shape of the domain. 40
3.9 Single coil probe [23]. 42
3.10 Bridge type probe [23]. 43
3.11 (a) Reflection type probe (single coil) [23]. 43 (b) Reflection type probe (double coil) [23].
3.12 Oscillator circuit [24]. 44
3.13 LC oscillator [24]. 45
4.1 (a) 3D view of the current density contours. 47 (b) X-Plane view of the current density contours.
4.2 Surface induced current density (A/m2) contours with 48 coil set at 100Hz.
4.3 Surface induced current density (A/m2) contours with 49 coil set at 1000Hz.
4.4 Region of interest. 50
4.5 Surface induced current density graph plot at 51 cylinder head.
4.6 Surface induced current density graph polt at 52 valve seat.
4.7 Magnetic density at cylinder head. 53
4.8 Magnetic flux density at valve seats. 54
LIST OF APPENDICES
A PROTON CFE +IAFM Drawing
B PROTON CFE +IAFM Work Cycle
C UNS S32750 Datasheet
CHAPTER 1
INTRODUCTION
1.1 Introduction
The Perusahaan Otomobil Nasional which is widely known as PROTON is Malaysia’s first and largest automobile manufacturer. It was established in 1983 and
launched their first car, the Proton Saga in July 1985. Since then, PROTON had produce various types of cars, from compact to sedan, luxury, MPV, and MUV. Their manufacturing and assembly plants are located at Shah Alam, Selangor and Tanjung Malim, Perak.
One of the crutial part in a car manufacturing is the engine. The engine requires a large investment of development and manufacturing. To be competitive in the local market and targeted plan of aggressive competition in global market, PROTON has to increase the total cost by reducing the cost of manufacturing, especially in eliminating waste.
Defect part is one of the wastes that need to be eliminated or reduced in manufacturing. This can be achieved through good practice and proper root cause analysis, including the proper improvement plan. In order to obtain a good result, a manufacturing plant needs to do as per plan, check or analyze any possibility and action based on the given feedback.
electromagnetic techniques used for the inspection of conductive materials , for example, copper, aluminum or steel is eddy current non-destructive inspection [1].
Electromagnetic systems, for example, eddy current, magnetic particle or radiographic and ultrasonic methods, all bring electromagnetic or sound waves into the inspected material to concentrate its properties. Penetrant liquid methods can detect cracks in the test material by utilizing either fluorescent or non-fluorescent colors. In addition to these systems, researchers have researched non-destructive testing based on a combination of electromagnetic and sound waves utilizing electromagnetic acoustic transducers, best known as Emats [2, 3].
The standard of the eddy current method is based on the interaction between a magnetic field source and the test material. This interaction induces eddy currents in the test piece [1]. Researchers can detect the presence of very small cracks by monitoring changes in the eddy current flow [4].
This project proposes non-destructive eddy current techniques systems that could be utilized in detecting the air gap between valve seat and cylinder head and detect any misalignment occured. The results of eddy current testing are practically instantaneous, whereas other techniques such as liquid penetrant testing or optical inspection require time-consuming procedures that make it impossible, even if desired, to comply with the cycle time located [5].
Eddy current testing permits crack detection in a large variety of conductive materials, either ferromagnetic or non-ferromagnetic, though other non-destructive methods, for example, the magnetic particle methods are constrained to ferromagnetic metals. Another advantage of the eddy current method over other methods is that inspection can be executed without any immediate physical contact between the sensor and the inspected piece.
Furthermore, a wide variety of inspections and measurements may be performed with the eddy current method that are beyond the scope of other methods. The measurements of non-conductive coating thickness and conductivity could be possible [6]. Conductivity is identified with the composition and heat treatment of the test material. In this manner, the eddy current system can likewise be utilized to recognize the different between pure materials and alloy composition and to determine the hardness of test pieces after heat treatments [5].
3 extensive research and development in highly sensitive eddy current sensors and instruments throughout the most recent sixty years demonstrates that eddy current testing is at present a generally utilized inspection method.
This project presents the basis of non-destructive eddy current testing and provides an overview of the reasearc conducted by many authors who continue to develop this technique. The fundamentals of eddy current techniques simulation and the main variables of this technique are presented in Chapter 2 and Chapter 3.
1.2 Problem statement
The most critical sealing surface in the valve train assembly is between the face of the valve and the valve seat in the cylinder head when the valve is closed. Leakage between these surfaces reduces the engine’s compression and power and can lead to
valve burning. To ensure proper seating of the valve, the gap between the valve seat and cylinder head must be not more than 30 micron.
In the manufacturing process, the valve seat was press-fitted into the bore at the cylinder head with certain pressure, and there is feedback (sensor) to ensure that the pressure is comply and assuming by this, that the valve seat is properly fitted. However, misalignment still occurring due to the misalignment of the press-fitted machine after long working hours. Therefore, an inspection is needed to ensure that the valve seat was properly fitted to avoid problems when the engine completed and running.
1.3 Objectives
The aim of this project is to instrumentally detection of valve seat misalignment. The objectives are to:
(i) Identify the the problem occuring in the engine assembly line.
(ii) Design an instrumental detection system based on the eddy current detection method.
1.4 Scopes
The project began with a study conducted on the engine assemblying line in Engine and Transmission Manufacturing Department (ETM), PROTON Shah Alam. Limitations for the project are:
(i) Design and simulate the measuring concept without hardware development.
(ii) Measuring system designed only applicable to PROTON CFE engine block with 4-cylinders and 16-valves.
1.5 Significance of the study
Valve seats plays an important role in automobile engine especially in terms of valve cooling. Misalignment in press-fitted seats during manufacturing could cause a major problem, for example, valve recession, uneven in valve wear, or even break the valve which may caused the engine to totally breakdown. Due to this matter, a measurement method to ensure the valve seats properly fitted into the cylinder head based on the effect of the eddy currents to determine the gap width between valve seats and cylinder head were simulated in this project. Results and analysis of this project could possibly contribute in the development of the measuring method proposed to be used in the manufacturing process.
1.6 Thesis arrangement
The project thesis is arranged in five chapters as listed below:
(i) Chapter 1–Introduction.
5 (ii) Chapter 2–Literature review.
Literature on the problems and the reason why it need to be solved were described here. Past research papers were refered in order to provide the knowledge and information related to the project. Finally, the basic principles of method used in the project were described in this chapter as the preliminary and overview to ensure the capability of the method in providing a technique to solve the problem.
(iii) Chapter 3–Methodology.
Started with the factory visited, in gaining information and determined the problem and its caused. The chapter continues with the mathematical and geometrical development in providing the preliminary data for the simulation. Finally the chapter ended with the methodology in the modeling and simulating in COMSOL Multiphysics.
(iv) Chapter 4–Results and discussions.
Results obtained from the simulation were analyzed in this chapter. Based on the analyzed data, it is clearly shows that the gap width between valve seats and cylinder head will influence the output result.
(v) Chapter 5–Conclusions and recommendations.
LITERATURE REVIEW
2.1 Introduction
The aim of this chapter is to provide reader with basic knowledge in pursuing the objectives stated in Chapter 1. These include the main subject, engine valve seats and its purposes in an automobile engine, the effect and impact of valve seat misaligned and the gap measurement methods available commercially. Basic principle of eddy currents as the technique used in the inspection of the valve seats and cylinder head gap width were also described in this chapter. Literature on relevant research papers, especially on the simulation of eddy current testing method using COMSOL Multiphysics were made to strengthen the ability of the FEM software in terms of real case simulation.
2.2 Valve seats
Engine valves control the flow of gasses in and out of engine cylinders. At the point when intake valves open, air and fuel (air just if the fuel is directly injected to the cylinder) flow into the cylinder. After the intake valves close, combustion happens and the exhaust valves open and smoldered gasses flow out of the cylinder.
7
happen which will antagonistically influence the engine compression ratio and along these lines the engine efficiency, performance, exhaust emissions, and engine life.
[image:17.595.215.431.348.494.2]Valve seats, as shown in Figure 2.1, are frequently formed by first press-fitting an approximately cylindrical piece of a hardened metal alloy, for example, Stellite, into a cast dejection in a cylinder head over every possible valve stem position, and after that machining a tapered area surface into the valve seat that will mate with a relating conelike segment of the corresponding valve. Generally two tapered area surfaces, one with a more extensive cone angle and one with a narrower cone angle, are machined above and underneath the actual mating surface, to form the mating surface to the best possible width (called "narrowing" the seat), and to enable it to be appropriately placed regarding the (wider) mating surface of the valve, in order to give great fixing and heat transfer, when the valve is closed, and to give great gas-flow characteristics through the valve, when it is opened.
Figure 2.1: Valve seats. (Digital images, Valency Parts <www.valencypart.com>
2.2.1 Valve seats failure
[image:18.595.202.436.230.476.2]Valve recession happens when wear of the valve or seat inserts in an automotive engine has caused the valve to sink or subside into the seat insert as shown in Figure 2.2. Extreme recession leads to valves not seating accurately and cylinder pressure loss. Leaking hot combustion gasses can likewise cause valve guttering or burning, which will accelerate valve failure [7].
Figure 2.2: Valve recession [7].
9 implied on restarting the valves were not able to seat appropriately and cylinder pressure loss resulted [7].
Azadi [8] presented a failure analysis on a failed intake valve in a gasoline engine. During an endurance test, an intake valve was broken and caused on a few damages on the piston [8]. Material examinations (by a light microscope and also a scanning electron microscope) were directed on the break surface of the intake valve shaft. Results demonstrated that no pores or imperfections could be observed and the microstructure and the hardness of the material were complied with the specification (the standard guide extracted by the manufacture). Yet a mechanical element caused the damage which comprised of a reversal bending load because of the misalignment of the valve shaft. The misalignment was caused by the thermal deformation in the valve shaft. The engine was working in a hot condition. Likewise, it was a reversal condition (with zero mean stress) because of the turn of the valve shaft during engine working. Additionally, the break surface showed beach marks because of cyclic loadings. In the case study, it was observed that cracks initiated from the external surface of the valve shaft and propagated through within the crack surface [8].
For the failure analysis of the intake valve, two sorts of root causes were considered which incorporate mechanical and material phenomena. Mechanical issues include [8]:
(i) Non-conformance of the geometric measurement and the tolerance of the intake valve in comparison to the specification (the standard guide). (ii) An issue in the oil lubrication of the valve system.
(iii) Increasing in the clearance of the valve shaft and guide. (iv) Misalignment of the valve seat with the valve guide.
(v) Non-planar of the valve guide on the combustion cylinder (of the cylinder head).
(vi) Other mechanical issues due to piston crashing, valve opening according to incorrect timing and etc. causes.
Material issues include [8]:
(i) Non-conformance of the chemical composition with the specification (the standard guide).
To explore these variables, examples were taken from the failed intake valve and prepared by standard strategies for metallurgical examinations.
2.2.2 Valve seats gap measurement
Generally there are two main method of measuring the gap between valve seats and cylinder head that had been patented that will be described here. Measurement method with patented number of US 20090123032 A1 was invented by Mitsuhiro Kanisawa and Mitsuo Tsuborai from Honda Engine Company Limited. They invented the method and patented it in 2007 and were published in 2009. The other measurement method was invented by Lee B. Moonen, John S. Agapiou and Daniel L. Simon from GM Global Technology Operations with patented number of US 8274053 B2. The method was invented and patented in 2010. Both methods were described below.
Particularly, seat-accommodating attachment parts are formed by cutting in the cylinder heads, and valve seats are press-fitted into the attachment parts. In the event that the press-fitting is inadequate, gaps form between the valve seats and the attachment parts. It is best that these holes do not form, however they are reasonable to an allowance (10 μm, for instance) in view of nonuniformities in machining. After press-fitting is complete, it is important to measure the gaps that have formed between the valve seats and the attachment parts, and to confirm that the gaps are within an allowable limit [9].
11
[image:21.595.235.420.194.438.2]As shown in Figure 2.3, an inspection apparatus is composed of a triangular prism mirror; an imaging device for capturing images of a long, thin inspected part; a binarization device for binarizing the gray images captured by the imaging device; a substitution device for substituting the binarized images with equivalent ellipsoids; and a calculation device for calculating the minor axis lengths of the obtained equivalent ellipsoids.
Figure 2.3: Gap measurement method using camera [9].
After a valve seat is press-fitted into an attachment part provided to a cylinder head, a triangular prism mirror is made to face a gap between the attachment part and the valve seat, and an image is taken and binarized.
The illumination axis is orthogonal to the imaged surface, as shown in Figure 2.4. Accordingly, there are not likely to be dark areas in the cut-out parts, and the microscopic burrs are not likely to cause dark areas. Moreover, white light-emitting diodes are utilized for illumination. These white light-emitting diodes have the preference of less occurrence of dark areas noise in comparison with red, blue, or green light-emitting diodes. The material can be significantly recognized by evaluating hue, the gap can be separated from other portions by assessing chroma, and the accuracy of binarization based on shading is increased by evaluating brightness [9].
Figure 2.4: Gap measurement device [9].
As a result of the above, a method can be accommodated precisely measuring gaps even in cases of inspecting the proximity of a valve seat containing cut-out parts or microscopic burrs. Mounting the cylinder, the white light-emitting diodes, the mirror, and the CCD camera on a robot arm eliminates the need to manually insert cylinders and other components into the exhaust ports. As a result, the measurement operation can easily be automated and carried out faster.
13
housing the valve seat insert. The thermal image may be assessed to determine the magnitude of a gap between the valve seat insert and the cylinder head based on a temperature at the interface between the valve seat insert and the cylinder head. This method was patented in US Patent No. US 8274053 B2.
An engine valve seat gap assessment system may include a thermal camera assembly, an apparatus having a first end coupled to the thermal camera assembly, and a mirror coupled to a second end of the fixture opposite the first end. The thermal camera assembly may incorporate an infrared sensor. The mirror may be adjusted to be located within an engine port to direct infrared radiation from a gap between a cylinder head and a valve seat insert to the infrared sensor [10].
[image:23.595.188.447.448.738.2]A technique for detecting a gap between a valve seat insert and a port in a cylinder head may incorporate heating the valve seat insert and the cylinder head and generating a thermal image of the valve seat insert and the cylinder head at an interface between the valve seat insert and corresponding port in the cylinder head housing the valve seat insert. The thermal image may be assessed to determine the magnitude of a gap between the valve seat insert and the cylinder head based on the thermal image at the interface between the valve seat insert and the cylinder head, as shown in Figure 2.5.
The thermal image may be created by located a mirror coupled to a first end of a fixture within the port at the interface and reflecting infrared radiation at the interface to an infrared sensor of a thermal camera assembly coupled to a second end of the apparatus. The infrared radiation reflected by the mirror may give a 360o image of the interface to the thermal camera assembly.
The IR thermal imaging system may include an IR transparent fixture coupled to a thermal camera. The fixture may incorporate a first end fixed to the thermal camera and second end having a mirror fixed thereto. The mirror may be located within the intake port. An external prism mirror may be used in place of the internal prism mirror. The present disclosure applies equally to both internal and external prism mirror. The internal prism mirror may be made transparent to IR by using materials including, but not limited to, sapphire, quartz, NaCl, PtSi, or Ge depending on the IR detector wavelength selection [10].
2.3 COMSOL Multiphysics
Computer simulation has turned into a fundamental standard of science and engineering. Digital analysis of components, is important when creating new items or optimizing designs. Today a huge range of alternatives for simulation is accessible; researchers use everything from fundamental programming languages to a numbers of high-level packages implementing advanced methods.
It would be perfect, then, to have a simulation environment that incorporated the possibility to add any physical effect to the simulated model. That is the thing that COMSOL is about. It's an adaptable stage that permits even beginners to model all important physical parts of their designs. Advanced userd can go deeper and utilize their knowledge to develop customized solutions, applicable to their unique circumstances.
15
chemical applications. Additional interfacing products coonect COMSOL Multiphysics simulations with technical computing, CAD and ECAD software.
2.3.1 Modeling and simulating eddy current
[image:25.595.229.407.393.645.2]Babbar utilized pulsed eddy current technology to detect inner layer defects in multilayered conductive structures [11]. The finite element modeling was done using COMSOL Multiphysics 4.3 software. The two-fold symmetry in the model geometry was utilized to produce a half-model instead of a full-model in order to save computer resources and reduce computation time. For the same reason, sample plates of reduced size and circular geometry were used. The numeric type driving and pickup coils were modeled [11]. A solved 3D half-model of a central-driver-differential-pickup (CDDP) probe on a sample of aluminium plates is shown in Figure 2.6. The sample consists of an upper plate of thickness 1.6 mm, a middle plate of thickness 2.0 mm and a lower plate of thickness 0.4 mm.
Figure 2.6: Front view of a solved 3D finite element half-model simulating the x component of the current density for the CDDP probe used in the experiment [11].
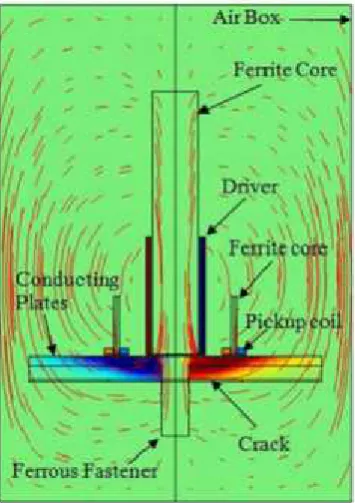
amplitude of the differential pick-up signal was found to decrease non-linearly with increase in crack depth [11]. The time-to-peak of the differential signal increased linearly with crack depth up to the maximum modeled depth of 4.8 mm. The variations of peak amplitude and peak position as a function of time are in good agreement with the experimental observations. These observations indicate that finite element modeling can be used to test new probe designs and predict probe response to cracks in the vicinity of ferrous fasteners.
Naveen [12] presented a contacless measurement technique to examine products during the process by designing a modular eddy current sensor, developed using various materials. The sensor consists of two parts, a single-turn excitation coil and an anistropic-magneto-resistance (AMR) sensor. The sensor is intended to be applied for the detection of cracks in ferrous and non-ferrous metals. The AMR sensor detects the change of the magnetic field induced in a sample by the excitation coil. Initial investigations were conducted to prove the capability of the completed eddy current micro sensor [12].
17
Figure 2.7: Design of the modular eddy current sensor [12].
The results were compared to the simulated magnetic field in the surface area. The sensor is simulated with ferum, Fe, and aluminium, Al, materials. The sensor is simulated when the position of the sensor is exact on the surface of the sample and half of the sensor placed on the surface of the sample. The measurements were conducted for a variation of the magnetic field strength of 400 A/m to 600 A/m [12].
Figure 2.8: Simulation result for the sensor is placed exact on surface of the sample when 400 A/m [12].
Figure 2.9: Simulation result for half of the sensor is placed on the surface of the sample when 600 A/m [12].
Alternating current flow through a wire placed just above a conducting material induces eddy currents at the surface of the conductor. Any surface cracks in the conductor modify the eddy current distribution, creating a magnetic field signature unique to the crack. The magnitude of the signal depends on the amplitudeof the current in the wire, the proximity and relative alignment of the sensor to the crack, and the position of the crack relative to the “no-crack” eddy
[image:28.595.190.445.284.451.2]19
[image:29.595.136.504.493.642.2]He developed a COMSOL model of the basic geometry. The drive coil and the eddy currents in the substrate were modeled in 3D. The work utilized the AC/DC module in COMSOL 3.5a and 4.0. The skin depth of the eddy currents and the physical size of the crack are very small, on the scale of tens micrometers, while the coil is meso scale, up to several mm in diameter, and the air space around the system and the substrate are large enough to allow the fields to decay smoothly to zero. The multi-turn drive coil was modeled as a square cross section button with a uniform current distribution. Swept mesh for the coil was chosen to obtain best field uniformity. The substrate was divided into several domains to provide additional control over the mesh size while managing memory and CPU load. The crack was meshed first with a suitably fine element size to provide adequate mesh resolution at the surface. The top surfac of the substrate was then meshed with the element size allowed to grow rapidly from the crack to the edge of the substrate. This surface mesh was then swept through the substrate to allow fine layers near the surface and coarser ones at the bottom [13].
Figure 2.10 shows the modeled and the results obtained from the COMSOL simulation. As expected, the flow of the eddy currents is generally tangential except within a few skin depths of the crack, where the current flows around it. This deviation in the current direction creates in-plane components of the magnetic field.
(a) (b)
Figure 2.10: COMSOL model of eddy currents around a crack. (a) Mesh used for calculations [13].
2.4 Eddy current testing
Eddy current testing is based on the principles of electromagnetic induction and is utilized to identify or differentiate a wide variety of physical, structural, and metallurgical conditions in electrically conductive ferromagnetic and non-ferromagnetic metals. The part to be tested is put inside or adjacent to an electric coil in which an alternating current (AC) is flowing. This will causes eddy current to flow in the part as a result of electromagnetic induction.
Eddy current testing could be used to: (i) Surface crack detection.
Normally carried out with pencil probes or pancake type probes on ferrous or non-ferrous metals. Frequncies from 100kHz to a few MHz are commonly used. Depending on surface consition it is usually possible to find cracks as small as 0.1 mm [14].
(ii) Non-ferrous metal sorting.
This is essentially conductivity testing. From the impedance plane diagram, it will be seen that the indication from a conductivity change is essentially the same as from a crack, and both meter and impedance plane type crack detectors can be successfully used to sort similar metals using a suitable absolute probe [14].
(iii) Sub-surface crack and corrosion detection.
Primarily used in airframe inspection. By using a low frequency and a suitable probe, eddy currents can penetrate aluminium or similar structures to a depth of 10 mm, allowing the detection of second and third layer cracking, which is invisible from the surface, or thinning of any of the different layers making up the structure [14].
(iv) Heat exchanger tube testing.
21 decide on appropriate action such as tube plugging, tube replacement or replacement of the complete heat exchanger [14].
(v) In-line inspection of steel tubing.
Almost all high quality steel tubing is eddy current inspected using encircling coils [14].
(vi) Ferrous weld inspection.
The geometry and heat induced material variations around welds in steel would normally prevent inspection with a conventional eddy current probe, however aspecial purpose ‘WeldScan’ probe has been developed which allows inspection of welded steel structures for fatigue-induced cracking, the technique is particularly useful as it may be used in adverse conditions, or even underwater, and will operate through paint and other corrosion-prevention coatings [14].
Due to eddy current testing is an electromagnetic induction technique, no direct electrical contact with the part being inspected is required. Eddy current is adaptable to high speed inspection, and because it is non-destructive, it can be used to inspect an entire production output if desired. The method is based on indirect measurement, and the correlation between instrument readings and the structural characteristics and serviceability of parts being inspected must be carefully and repeatedly established.
2.4.1 Eddy current testing principles
Eddy current testing principles were made up from several basic electrical and electromagnetic properties. To elaborate those properties, a transformer model is used to demonstrate the fundamentals of eddy current induction and the impedance changes that occur in coil sensors [15].
2.4.1.1 Electromagnetic induction and eddy current inspection
Equation (2.1) below defined the complex number of impedance parameter Z0which
ratio (V0/I0) for a single frequency sinusoidal excitation, f [15]. Impedance Z0 has a
magnitude |Z| and a phase, φ:
= = + = + 2 = + ( )= | | (2.1)
When a coil energized with an alternating current (AC), it creates a time-varying magnetic field. The magnetic lines of flux tend to be concentrated at the center of the coil. Eddy current testing is based on Faraday’s electromagnetic induction law as shown in Equation (2.2) [15]. Faraday discovered that a time-varying magnetic induction flux density induces currents in an electrical conductor. The electromotive force, ε is proportional to the time-rate change of the magnetic
induction flux densityΦB.
= − (2.2)
When an alternating current (AC) energized coil of impedance Z0approaches
an electrically conductive non-ferromagnetic material, the primary alternating magnetic field penetrates the material and generates continuous and circular eddy currents. The induced currents flowing within the test piece generate a secondary magnetic field that tends to oppose the primary magnetic field, as shown in Figure 2.11. This opposing magnetic field, coming from the conductive material, has a weakening effect on the primary magnetic field. Thus, the new imaginary part of the coil impedance decreases proportionally when the eddy current intensity in the test piece increases [16]. Eddy currents also contribute to the increasing of the power dissipation of energy that changes the real part of coil impedance. Measuring this coil impedance variation from Z0 to ZC, by montoring either the voltage or the
23
Figure 2.11: Primary and secondary magnetic field. Eddy current on the test piece [18].
2.4.1.2 Complex impedance plane
The coil impedance changes when a coil probe interats with materials. When there is no test piece close to the coil sensor, its impedance Z0 is a complex value, as shown
in Equation (2.3) below:
= + (2.3)
where R0and jX0are the real and the imaginary part of Z0. The component X0=2πfL0
is proportional to frequency f and the induction coefficient, L0.
When a conductive test material approaches the energized coil probe, eddy currents appear on the test piece. Eddy currents create a secondary field that interacts with the primary field. As a result, the new impedance is Zc as shown in Equation
(2.4):
= + (2.4)
where Rc and jXc represent the real and imaginary parts of Zc, then Xc=2πfLc is
proportional to frequency f and the induction coefficient Lc when a test piece is close
to the coil.
Coil impedance is a 2-Dimensional variable, and the real part of impedance, and the Y-axis represents the imaginary part. Real and imaginary impedance parts of Zc can be redefined as Rcn and Xcn to obtain the normalized impedance as shown in
= ; = (2.5)
Figure 2.12: Normalized impedance plane. Lift-off curves and crack displacement at impedance plane for 2 values of conducticity P1 and P2 [16].
2.4.1.3 Non-ferromagnetic material approach
Encircling eddy currents will appear when a non-ferromagnetic material of conductivity σ1 approaches the coil probe. The displacement of the normalized
impedance plane is the line from the air point, P0to P1. This is the lift-off line for this
material, in which conductivity is σ1. At P1Rcn1> 0 as eddy currents create additional
power dissipation on the test piece. However, Xcn1 < 1, which means that Xc < X0.
This is the effect of weakening the total field inside the coil core due to the secondary magnetic field from eddy currents [15].
If less conductive material (σ2) is approached, σ1 > σ2, the displacement is
along another lift-off line from air point P0 to P2. Eddy current flow decreases with
respect to P1[15]. Thus, the change of resistivity of the coil is smaller than P1as 0 <
Rcn2< Rcn1. The secondary magnetic field, due to eddy currents, is not as strong as P1
so that Xcn1< Xcn2< 1.
When a flaw is present in the test piece, it obstructs the eddy current flow, as shown in Figure 2.13. There is a displacement from P1 to P2. This causes the eddy
current path to become longer, and the secondary magnetic field from the eddy currents is reduced [15]. As a conclusion, the real part of impedance Rcn+crack, which
62
REFERENCES
[1] L. Janousek, K. Capova, N. Yusa, K. Miya, “Multiprobe Inspection for Enhancing Sizing Ability in Eddy Current Non-Destructive Testing,” in IEEE Trans. Magn. 2008. Vol. 44, p.p 1618-1621.
[2] F. Noorian, A. Sadr “Computation of Transient Eddy Currents in EMATs using Discrete Picard Method,” in Proceesings of the 18th Iranian Conference on the Electrical Engineering (ICEE 2010), Isfahan, Iran, May 2010, p.p 727-731.
[3] S. Aliouane, M. Hassam, A.B. Bouda, A. Benchaala “Electromagnetic Acoustic Transducers (EMATs) Design Evaluation of their Performances,” in
Proceedings of the 15th World Conference on NDT (WCNDT 2000), Rome, Italy, October 2000.
[4] H. Hashizume, Y. Yamada, K. Miya, S. Toda, K. Morimoto, Y. Araki, K. Satake, N. Shimizu “Numerical and Experimental Analysis of Eddy Current
Testing for a Tube with Cracks,” in IEEE Trans. Magn. 1992, Vol. 28, p.p
1469-1472.
[5] D. Mercier, J. Lesage, X. Decoopman, D. Chicot “Eddy Currents and Hardness Testing for Evaluation of Steel Decarbudizing,” in NDT E Int.
2006, Vol. 39, p.p 652-660.
[6] L.B. Pedersen, K.A. Magnusson, Y. Zhensheng “Eddy Current Testing of Thin Layers Using Co-Planar Coils,” in Res. Nondestruc. Eval. 2000, Vol. 12, p.p 53-64.
[7] L. Lewis & R.S.J Dwyer “Combating Automotive Engine Valve Recession.” Department of Mechanical Engineering, Sheffield University, United Kingdom.
[8] M. Azadi, M. Roozban & A. Mafi “Failure Analysis of an Intake Valve in a Gasoline Engine” in The Journal of Engine Research, Vol. 26 (Spring 2012),
[9] Kanisawa, M. & Tsuborai, M. “Measurement of Gaps between Valve Seats and Attachment Parts,” in United States Patent Application Publication, US 2009/0123032 A1, May 14th, 2009.
[10] Moonen, L.B., Agapiou, J.S. & Simon, D.L. “System and Method for Valve Seat Gap Evaluation,” in Unite States Patent Application Publication, US
8,274,053 B2, Sept. 25th, 2012.
[11] V.K. Babbar, P.P. Whalen & T.W. Krause “Pulsed Eddy Current Probe Development to Detect Inner Layer Cracks near Ferrous Fasteners Using COMSOL Modeling Software,” Department of Physics, Royal Military
College of Canada.
[12] M.K.R. Naveen & B. Hemalatha “Design of Modular Eddy Current Microsensor,” in International Journal of Advanced Research in Electrical,
Electronics and Instrumentation Engineering, Vol. 3, Issue 4, pp. 8740-8747. [13] E. Weststrate, M. Steinback, N.M. Rensing and T. Tiernan “COMSOL
Multiphysics Modeling for Design Optimization of Eddy Current Crack Detectors,” in Proceedings of the COMSOL Conference 2010, Boston,.
[14] Buckley, J.M. “An introduction to Eddy Current Testing theory and technology,” in Hocking NDT.
[15] Martin, J.G., Gil, J.G. & Sanchez, E.V. “Non-Destructive Techniques based on Eddy Current Testing,” in MDPI Open Access Journal, Sensors 2011, 11,
2525-2565.
[16] D. Placko, I. Dufour “Eddy Current Sensors for Non-Destructive Inspection of Graphite Composite Materials” in Proceedings of the IEEE Conference of the Industry Applications Society (IAS ’92), Houston, TX, USA, October
1992, p.p 1676-1682.
[17] Q.H. Nguyen, L.D. Philipp, D.J. Lynch, A.F. Pardini “Steam Tube Defect Characterization using Eddy Current Z-Parameters,” in Res. Non-destruct. Eval. 1998, Vol. 10, p.p 227-252.
[18] R. Pohl, A. Erhard, H.J. Montag, H.M. Thomas, H. Wustenberg “NDT Techniques for Railroad Wheel and Gauge Corner Inspection,” in NDT E Int.
2004, Vol. 37, p.p 89-94.
64 Proceedings of the IEEE Sensors Applications Symposium (SAS 2010), Limerick, Ireland, February 2010, p.p 59-63.
[20] J. Rasson, T. Delipetrov “Progress and Limitations in Magnetic Field measurements,” in Geomagnetics for Aeronautical Safety, 1stEd., Novkovski, N E. Ed, Springer, Dordrecht, The Nederlands, 2006, Vol. 13, p.p 201-212. [21] Bennoud, S. & Zergoug, M. “Modeling and Simulation for 3D Eddy Current
Testing in Conducting Materials,” in International Journal of Mechanical, Aerospace, Industrial and Mechatronics Engineering, Vol: 8 No. 4, 2014. [22] “Multi-Turn Coil Above an Asymmetric Conductor Plate,” COMSOL
Multiphysics 4.4 Model Libraries.
[23] Olympus Corporation,www.olympus-ims.com/en/ec-flaw.

![Figure 2.2: Valve recession [7].](https://thumb-us.123doks.com/thumbv2/123dok_us/8762600.894724/18.595.202.436.230.476/figure-valve-recession.webp)
![Figure 2.3: Gap measurement method using camera [9].](https://thumb-us.123doks.com/thumbv2/123dok_us/8762600.894724/21.595.235.420.194.438/figure-gap-measurement-method-using-camera.webp)
![Figure 2.4: Gap measurement device [9].](https://thumb-us.123doks.com/thumbv2/123dok_us/8762600.894724/22.595.186.438.260.526/figure-gap-measurement-device.webp)
![Figure 2.5: IR thermal image system [10].](https://thumb-us.123doks.com/thumbv2/123dok_us/8762600.894724/23.595.188.447.448.738/figure-ir-thermal-image-system.webp)
![Figure 2.7: Design of the modular eddy current sensor [12].](https://thumb-us.123doks.com/thumbv2/123dok_us/8762600.894724/27.595.218.422.81.314/figure-design-modular-eddy-current-sensor.webp)