International Journal of Emerging Technology and Advanced Engineering
Website: www.ijetae.com (ISSN 2250-2459, Volume 2, Issue 11, November 2012)703
Modelling And Simulation Of Automatic Generation Control In
A Deregulated Environment And Its OptimizationU LQR Based
Integral Controller
Aprajita Salgotra
1,
Sumit Verma
21, 2
Assistant Professor, Department of Electrical & Electronics, Shivalik College of Engineering (Dehradun)
Abstract- Automatic generation control is a significant control process that operates constantly to balance the generation and load in power systems at a minimum cost. The AGC system is responsible for frequency control, power interchange and economic dispatch. This paper reviews the main structures, configurations, modeling and characteristics of Automatic Generation Control systems in a deregulated environment and addresses the control area concept in restructured Power Systems. The concept of DISCO participation matrix is introduced and reflected in the two-area diagram to make the visualization of contract easier. The modification by superimposition of information flow on the Traditional AGC two-area system is done to take into account the effect of bilateral contracts on the dynamics and the simulations reveal some interesting patterns. The Linear Quadratic Regulator (LQR) with Integral action (LQRI) is designed and implemented to solve the Load Frequency Control problem in a restructured power system that operates under deregulation based on bilateral policy. To validate the effectiveness of LQR robust controller, the simulation has been performed using proposed controller and comparison has been done with conventional Integral type controller.
Keywords— Automatic generation control, bilateral contracts, deregulation, frequency control, optimization, Linear Quadratic Regulator.
I. INTRODUCTION
In a restructured power system, the engineering aspects of planning and operation have to be reformulated although essential ideas remain the same. With the emergence of the distinct identities of Generating Companies (GENCOs), Transmission Companies (TRANSCOs), Distribution Companies (DISCOs) and the Independent System Operator (ISO), many of the ancillary services of a vertically integrated utility will have a different role to play and hence have to be modeled differently. Among these ancillary services is the automatic generation control (AGC).
Large scale power systems are normally managed by viewing them as being made up of control areas with interconnections between them.
Each control area must meet its own demand and its scheduled interchange power. Any mismatch between the generation and load can be observed by means of a deviation in frequency.
This balancing between load and generation can be achieved by using Automatic Generation Control (AGC). The objective of this paper is the modification of the traditional two area system to take into account the effect of Bilateral Contracts. The concept of DISCO participation matrix is used that helps the visualization and implementation of contracts. Simulation of the bilateral contracts is done and reflected in the two-area block diagram..Formulation and Implementation of Linear Quadratic Regulator robust controller is done by optimizing the parameters.
II. AUTOMATIC GENERATION CONTROL
In an interconnected power system, as the load varies, the frequency and tie-line power interchange also vary. To accomplish the objective of regulating system electrical frequency error and tie-line power flow deviation to zero, a supplementary control action, that adjusts the load reference set points of selected generating units, is utilized. This control process is referred to as Automatic Generation Control (AGC).
A. Significance of Automatic Generation Control In Deregulated Environment
The Significance of AGC in deregulated environment is three-fold;
(i) to achieve zero static frequency;
(ii) to distribute generation among areas so that
International Journal of Emerging Technology and Advanced Engineering
Website: www.ijetae.com (ISSN 2250-2459, Volume 2, Issue 11, November 2012)704
(iii) to balance the total generation against the total load and tie line power exchanges.
B.Power System Frequency Control
Frequency deviation is a direct result of the imbalance between the electrical load and the active power supplied by the connected generators. A permanent off-normal frequency deviation directly affects power system operation, security, reliability, and efficiency by damaging equipment, degrading load performance, overloading transmission lines, and triggering the protection devices. The primary control performs a local automatic control that
delivers reserve power in opposition to any frequency
change. The supplementary loop gives feedback via the frequency deviation and adds it to the primary control loop through a dynamic controller. The resulting signal is used to regulate the system frequency. Load shedding is an emergency control action to ensure system stability, by curtailing system load. The load shedding will only be used if the frequency (or voltage) falls below a specified frequency (voltage) threshold.
C.Automatic Generation Control in a Two Area System
A power system comprising of two control areas interconnected by a weak lossless tie-line is considered.
Each control area is represented by an equivalent generating unit interconnected by a Tie-line with reactance
X12. Under steady state operation, the transfer of power
over the Tie-line P12 can be written as
Where E1 and E2 are the magnitudes of the end voltages of control areas 1 and 2 respectively, and δ1 and δ2 are the voltage angles of E1 and E2, respectively.
For a small change ∆δ1 and ∆δ2 in voltage angles, the
change in Tie-line power, ∆P12 is shown as
Where T12 is defined as the synchronizing coefficient
and is given as
Expressing in term of ∆f, gives
∫ ∫
Taking Laplace Transform of above Equation
The transfer of power over the Tie-line is expressed as
International Journal of Emerging Technology and Advanced Engineering
Website: www.ijetae.com (ISSN 2250-2459, Volume 2, Issue 11, November 2012) [image:3.612.99.535.169.569.2]705
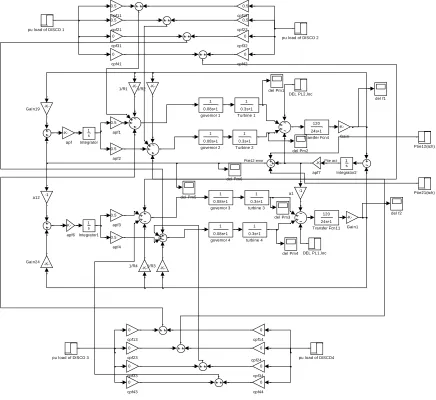
Figure 1: Two-Area AGC System Block Diagram in Restructured Scenario.
III. AGCIN DEREGULATED ENVIRONMENT
For the electric industry, deregulation means the generation portion of electricity service will be open to competition.
However, the transmission and distribution of the electricity will remain regulated and our local utility company will continue to distribute electricity to us and provide customer services to us. [19]
cpf24 1 0.3s+1 turbine 4 1 0.3s+1 turbine 3
pu load of DISCO4 pu load of DISCO 3
pu load of DISCO 2 pu load of DISCO 1
1 0.08s+1 governor 4 1 0.08s+1 governor 3 1 0.08s+1 governor 2 1 0.08s+1 governor 1 del f2 del f1 del Pm6 del Pm5 del Pm4 del Pm3 del Pm2 del Pm1 0 cpf44 0 cpf43 0 cpf42 0 cpf41 0 cpf34 0 cpf33 0 cpf32 0 cpf31 0 cpf23 0.5 cpf22 0.5 cpf21 0 cpf14 0 cpf13 0.5 cpf12 0.5 cpf11 -K-apf7 -K-apf6 0.5 apf4 0.5 apf3 0.5 apf2 0.5 apf1 -K-apf -1 a12 -1 a1 1 0.3s+1 Turbine 2 1 0.3s+1 Turbine 1 120 24s+1 Transfer Fcn4 120 24s+1 Transfer Fcn11 Ptie21(sch) Ptie12(sch) 1 s Integrator2 1 s Integrator1 1 s Integrator -K-Gain24 -K-Gain19 0 -K-Gain1 -K-Gain DEL PL2,loc DEL PL1,loc -K-1/R4 1/R3
International Journal of Emerging Technology and Advanced Engineering
Website: www.ijetae.com (ISSN 2250-2459, Volume 2, Issue 11, November 2012)706 A.Formulation of State Model
The formulation of the block diagram for a two-area AGC system in the deregulated scenario is shown in Figure 1. The demands are specified by Contract Participation
Factor (elements of DPM) and the puMW load of a
DISCO. These signals carry information as to which
GENCO has to follow a load demanded by whichDISCO.
The scheduled steady state power flow on the tie line is
given as
∆Ptie1-2,scheduled = (demand of DISCOs in area II from
GENCOs in area I) - (demand of DISCOs in area I from GENCOs in area II)
At any given time, the tie line power error, ∆Ptie1-2,error is
defined as
This error signal is used to generate the respective ACE signals as in the traditional scenario
Where
Pr1 and Pr2 are the rated powers of areas I and II,
respectively.
B. State Space Characterization of Two-Area System in Deregulated Environment
A two-area system is used to illustrate the behavior of the proposed AGC scheme. The same data as in [3], [4] is used for simulations. Both the areas are assumed to be identical. Considering the state space vectors;
International Journal of Emerging Technology and Advanced Engineering
Website: www.ijetae.com (ISSN 2250-2459, Volume 2, Issue 11, November 2012)707
̇
̇
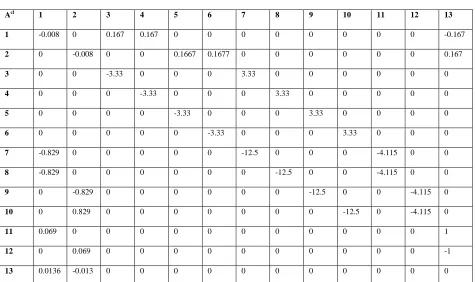
The thirteen equations from can be organized in the following vector matrix form and substituting the values from the Table 3.
The closed loop system in Fig. 1 is characterized in state space form as
[image:5.612.70.545.233.515.2]
Table 1 Matrix Acl
Acl 1 2 3 4 5 6 7 8 9 10 11 12 13
1 -0.008 0 0.167 0.167 0 0 0 0 0 0 0 0 -0.167
2 0 -0.008 0 0 0.1667 0.1677 0 0 0 0 0 0 0.167
3 0 0 -3.33 0 0 0 3.33 0 0 0 0 0 0
4 0 0 0 -3.33 0 0 0 3.33 0 0 0 0 0
5 0 0 0 0 -3.33 0 0 0 3.33 0 0 0 0
6 0 0 0 0 0 -3.33 0 0 0 3.33 0 0 0
7 -0.829 0 0 0 0 0 -12.5 0 0 0 -4.115 0 0
8 -0.829 0 0 0 0 0 0 -12.5 0 0 -4.115 0 0
9 0 -0.829 0 0 0 0 0 0 -12.5 0 0 -4.115 0
10 0 0.829 0 0 0 0 0 0 0 -12.5 0 -4.115 0
11 0.069 0 0 0 0 0 0 0 0 0 0 0 1
12 0 0.069 0 0 0 0 0 0 0 0 0 0 -1
International Journal of Emerging Technology and Advanced Engineering
Website: www.ijetae.com (ISSN 2250-2459, Volume 2, Issue 11, November 2012)708 Table 2
Matrix Bcl
Bcl 1 2 3 4
1 -0.1667 -0.1667 0 0
2 0 0 -0.1667 -0.1667
3 0 0 0 0
4 0 0 0 0
5 0 0 0 0
6 0 0 0 0
7 6.25 3.125 0 3.75
8 2.5 3.125 0 0
9 0 3.125 12.5 0
10 0 3.125 0 17.857
11 0.3 0.5 0 -0.3
12 -0.3 -0.5 0 0.3
International Journal of Emerging Technology and Advanced Engineering
Website: www.ijetae.com (ISSN 2250-2459, Volume 2, Issue 11, November 2012)709 C. Simulation Results of a Two- Area System in a
Deregulated Environment
Scenario I
Consider a case where the GENCOs in each area participate equally in AGC; i.e., ACE participation factors are
apf1=0.5, apf2=1-apf1= 0.5,
apf3= 0.5, apf4=1-apf3=0.5.
It is assumed that the load change occurs only in area I.
Thus, the load is demanded only by DISCO1 and DISCO2.
Let the value of this load demand be 0.1 pu MW for each of them.
DPM = [
]
The corresponding Disco Participation Matrix will become
[
]
DISCO3 and DISCO4 do not demand power from any
GENCOs, and hence the corresponding participation factors (columns 3 and 4) are zero.
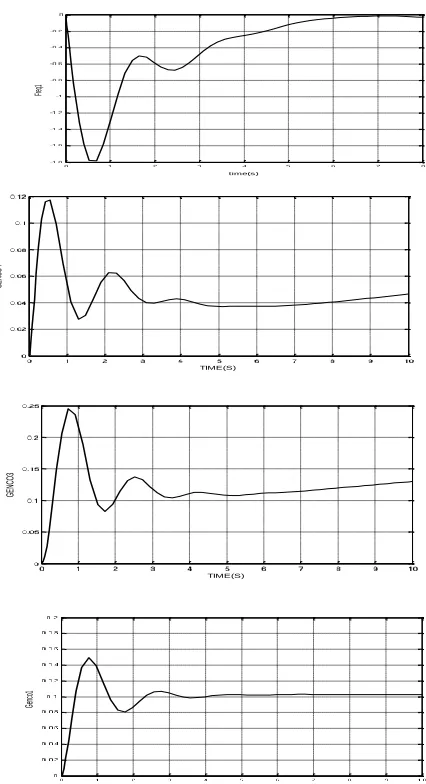
Fig. 2 shows the results of this load change: area frequency deviations, actual power flow on the tie line, and the generated powers of various GENCOs, following a step
change in the load demands of DISCO1 and DISCO2. The
frequency deviation in each area goes to zero in the steady
state. As only the DISCOs in area I, viz. DISCO1 and
DISCO2, have nonzero load demands, the transient dip in
frequency of area I is larger than that of area II.
The desired generation of a GENCO in pu MW can be expressed in terms of Contract Participation Factor (cpf‟s) and the total demand of DISCOs as
M1
∑
Where∆PLj is the total demand of DISCO j and cpfs are
given by DPM.
∆PM1 = 0.5 * ∆PL1 + 0.5 * ∆PL2
= 0.1puMW
∆PM2 = 0.1 pu MW; ∆PM3 = 0 pu MW;
∆PM4 = 0 pu MW
GENCO3 and GENCO4 are not contracted by any
DISCO for a transaction of power.
time(s)
Fr
eq
2
time(t)
Ge
nc
o1
time(s)
Ge
nc
o2
time(s)
Ge
nc
International Journal of Emerging Technology and Advanced Engineering
Website: www.ijetae.com (ISSN 2250-2459, Volume 2, Issue 11, November 2012) [image:8.612.331.544.134.526.2]710 Figure 2: Frequency Deviations (rad/s) and Generated Power
(pu MW)
Scenario II
Consider a case where all the DISCOs contract with the GENCOs for power as per the following DPM:
[
]
It is assumed that each DISCO demands 0.1 pu MW power from GENCOs as defined by Contract Participation Factor in DPM matrix and each GENCO participates in AGC as defined by following ACE Participation Factors (apfs) are
apf1=0.75; apf2=1-apf1= 0.25;
apf3= 0.5; apf4=1-apf3=0.5
The scheduled power on the tie line in the direction from area I to area II is
Hence, = -0.05pu MW
In the steady state, the GENCOs must Generate
∆PM1 = 0.5 (0.1) + 0.25(0.1) + 0 + 0.3(0.1)
= 0.105puMW
∆PM2 = 0.045 pu MW; ∆PM3 = 0.195 pu MW;
∆PM4 = 0.055 pu MW.
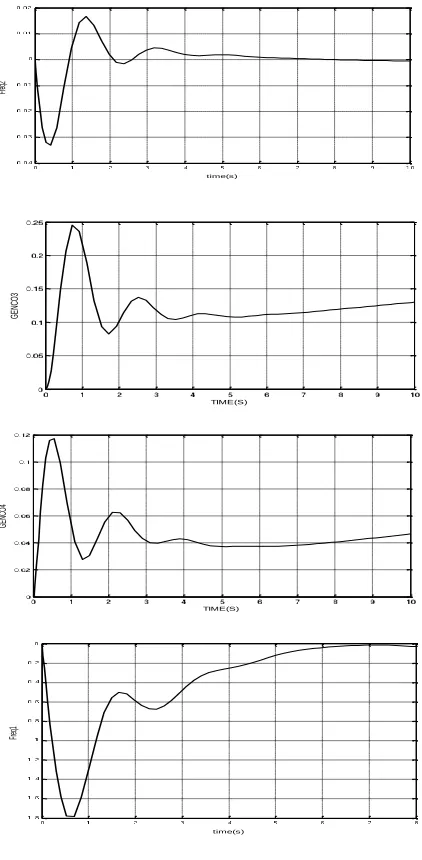
Figure 3: Frequency Deviations (rad/s) and Generated Power (pu MW)
Scenario III (Contract Violation)
If a DISCO violates a contract by demanding more power than that specified in the contract, the excess power is not contracted out to any GENCO. This subcontracted power must be supplied by the GENCOs in the same area as the DISCO.
The total local load in area I ∆PL1,Loc = Load of DISCO1
+ Load of DISCO2 = (0.1 + 0.1) + 0.1 pu MW = 0.3 pu
MW
time(s)
Fr
eq
1
time(s)
Tie
Li
ne
time(s)
Fre
q1
TIME(S)
GE
NC
O4
TIME(S)
GE
NC
O3
time(s)
Ge
nc
[image:8.612.60.277.142.380.2]International Journal of Emerging Technology and Advanced Engineering
Website: www.ijetae.com (ISSN 2250-2459, Volume 2, Issue 11, November 2012)711
The total local load in area II ∆PL2,Loc = Load of DISCO3
+ Load of DISCO4 = 0.2 pu MW
The frequency deviations vanish in the steady state [Fig. 4]. The generation of GENCOs 3 and 4 is not affected
[image:9.612.53.264.202.632.2]by the excess load of DISCO.
Figure 4: Frequency Deviations (rad/s) and Generated Power (pu MW)
IV. OPTIMIZATION OF INTEGRAL CONTROLLER GAIN
SETTING A.Linear Quadratic Regulators
For the design of an optimal quadratic regulator the Algebraic Riccati Equations (ARE) are used to calculate the state feedback gains for a chosen set of weighting matrices. The closed loop system is characterized in state space form as:
(x) = A
cl
+ Bcl
Where „x‟ is the state vector and „u‟ is the vector of
power demands of the DISCOs. Acl and Bcl matrices are
constructed.
In order to have a LQR formulation with the system, the following Quadratic cost function (J) is minimized-
∫ Where „Q‟ and „R‟ are the state and control weighting
matrices, respectively which are square and symmetric.
A convenient PI has the quadratic form
∫
K is obtained from solution of the reduced matrix Riccati equation given below
The acceptable solution of K is that for which the system remains stable. Considering the system parameters shown in Table 3, the computer solution using MATLAB R2009a for the feedback matrix is presented.
time(s)
Fr
eq
2
TIME(S)
G
EN
CO
3
TIME(S)
GE
NC
O4
time(s)
Fr
eq
1
time(s)
Ge
nc
International Journal of Emerging Technology and Advanced Engineering
Website: www.ijetae.com (ISSN 2250-2459, Volume 2, Issue 11, November 2012)712
Performance index = 6.7306
Matrix k obtained is [4*14] and then divided into two parts Kp[4*13] which represents proportional matrix and Ki[4*1] is the integral action.[21]
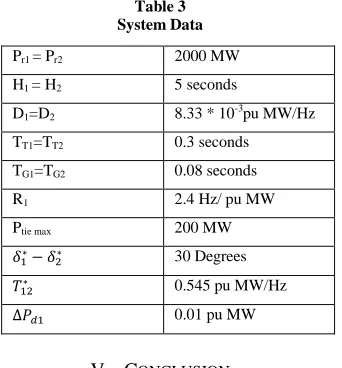
[image:10.612.88.259.205.389.2]For this study, following system data is used:
Table 3 System Data
Pr1 = Pr2 2000 MW
H1 = H2 5 seconds
D1=D2 8.33 * 10-3pu MW/Hz
TT1=TT2 0.3 seconds
TG1=TG2 0.08 seconds
R1 2.4 Hz/ pu MW
Ptie max 200 MW
30 Degrees
0.545 pu MW/Hz
0.01 pu MW
V. CONCLUSION
This thesis work gives an overview of AGC in deregulated environment which acquires a fundamental role to enable power exchanges and to provide better conditions for the electricity trading. The important role of AGC will continue in restructured electricity markets, but with modifications. Bilateral contracts can exist between DISCOs in one control area and GENCOs in other control areas. The use of a “DISCO Participation Matrix” facilitates the simulation of bilateral contracts. It is emphasized that the new challenges will require some adaptations of the current AGC strategies to satisfy the general needs of the different market organizations and the specific characteristics of each power system.
VI. FUTURE SCOPE
In this research, a scheme for automatic generation control indulges the effect of voltages and market structure has been developed. This approach is the real solution for power system problem. It is expected that the research will add the world of AGC structure on demand side management.
The new framework will be required for AGC scheme based on market structure with intelligence controller to solve complex problem and need another technical issues to be solved.
In general, a variety of technical scrutiny will be needed to ensure secure system operation and a fair market place. Optimization of linear controller gain setting can be done by using Genetic Algorithm techniques.
REFERENCES
[1 ] J. Kumar, K. Ng, and G. Sheble, “AGC simulator for price-based operation: Part I,” IEEE Trans. Power Systems, vol. 12, no. 2, May 1997.
[2 ] J. Kumar, K. Ng, and G. Sheble, “AGC simulator for price-based operation: Part II,” IEEE Trans. Power Systems, vol. 12, no. 2, May 1997.
[3 ] O. I. Elgerd and C. Fosha, “Optimum megawatt-frequency control of multi area electric energy systems,” IEEE Trans. Power Apparatus & Systems, vol. PAS-89, no. 4, pp. 556–563, Apr. 1970.
[4 ] C. Fosha and O. I. Elgerd, “The megawatt-frequency control problem: A new approach via optimal control theory,” IEEE Trans. Power Apparatus & Systems, vol. PAS-89, no. 4, pp. 563–577, Apr. 1970.
[5 ] R. Christie and A. Bose, “Load-frequency control issues in power systems operations after deregulation,” IEEE Trans. Power Systems, vol. 11, pp. 1191–1200, Aug. 1996.
[6 ] Christie, B. F. Wollenberg, and I. Wangensteen, “Transmission management in the deregulated environment,” Proc. IEEE Special Issue on the Technology of Power System Competition, vol. 88, no. 2, pp. 170–195, Feb. 2000.
[7 ] J.L.Willems, “Sensitivity analysis of the optimum performance of conventional load-frequency control,” Trans. Power Apparatus & Systems, vol. 93, no. 6, pp. 1287–1291, Sept./Oct. 1974.
[8 ] G. Quazza, “Non interacting controls of interconnected electric power systems,” IEEE Trans. Power App. Syst., vol. PAS-85, no. 7, pp. 727–741, Jul. 1.
[9 ] Ibraheem, Prabhat Kumar, and Dwarka P. Kothari, “Recent Philosophies of Automatic Generation Control Strategies in Power Systems”, IEEE Trans. Power App. Syst., vol. 20, no. 1, Feb. 2005. [10 ]Ignacio Egido, Fidel Fernández-Bernal, Luis Rouco, Eloisa Porras,
and Ángel Sáiz-Chicharro, “Modeling of Thermal Generating Units for Automatic Generation Control Purposes”, IEEE Trans. control systems technology, vol. 12, no. 1, Jan. 2004.
[11 ]I. J. Nagrath, D. P. Kothari, Power System Engineering, TATA McGraw Hill, New York, 1994.
[12 ]P. Kundur, Power System Stability and Control, TATA McGraw-Hill, New Delhi, 1994.
[13 ]N. Cohn, “Some aspects of tie-line bias control on interconnected power systems,” Amer. Inst. Elect. Eng. Trans., vol. 75, pp. 1415– 1436, Feb. 1957.
[14 ]H. G. Kwatny, K. C. Kalnitsky, and A. Bhatt, “An optimal tracking approach to load frequency control,” IEEE Trans. Power App. Syst., vol. PAS-94, no. 5, pp. 1635–1643, Sep./Oct. 1975.
[15 ]Hadi Sadaat, Power System Analysis, TATA McGraw Hill, New Delhi, 2002.
International Journal of Emerging Technology and Advanced Engineering
Website: www.ijetae.com (ISSN 2250-2459, Volume 2, Issue 11, November 2012)713 [17 ]N. Jaleeli, L.S. VanSlyck et al, “Understanding Automatic
Generation Control”, IEEE Trans. on Power Systems, Vol. 7, No. 3, August 1992.
[18 ]G. V. Hicks, B Jeyasurya, P. Eng; “An Investigation of Automatic Generation Control For An Isolated Transmission System”, 1997. Pages: 31- 34.
[19 ]J. M. Arroyo, A. J. Conejo, "Optimal response of a power generator to energy, AGC, and reserve pool-based markets. IEEE Trans. Power System,2002.