Evidence for Recent Polygenic Selection on Educational Attainment and Underlying Cognitive Abilities Inferred from GWAS Hits: A Monte Carlo Simulation Using Random SNPs
Davide Piffer 1*,
1 Ben Gurion University of the Negev; [email protected]
* Correspondence: [email protected]; Tel.: +972-52-581-1001
Abstract:
Background: The genetic variants identified by three large genome-wide association studies (GWAS) of educational attainment were used to test a polygenic selection model.
Methods: Average frequencies of alleles with positive effect (polygenic scores or PS) were compared across populations (N=26) using data from 1000 Genomes. A null model was created using frequencies of random SNPs.
Results: Polygenic selection signal of educational attainment GWAS hits is high among a handful of SNPs within genomic regions replicated across GWAS publications. A polygenic score comprising 9 SNPs predicts population IQ (r=0.88), outperforming 99% of the polygenic scores obtained from sets of random SNPs (Monte Carlo p= 0.011). Its predictive power remains unaffected after controlling for spatial autocorrelation (Beta= 0.83).The largest polygenic score (161 SNPs) exhibits similar predictive power (Beta=0.8). Random polygenic scores are moderate predictors of population IQ (thanks to spatial autocorrelation), and their predictive power increases logarithmically with the number of SNPs, indicating an exponential reduction in noise.
Conclusion: This study provides guidance for using GWAS hits together with random SNPs for testing polygenic selection using Monte Carlo simulations.
Keywords: educational attainment; polygenes; polygenic selection; IQ; GWAS
1. Introduction
Over the last decade, population geneticists have recognized that most traits are highly polygenic, and hence have moved away from the study of genetic evolution using the single-gene, Mendelian approach, towards models that examine many genes together (i.e. polygenic models).
Signals of polygenic selection can be identified by various methods, such as correlation of allele frequencies [1-4] and the regression of population average of trait values on polygenic scores (PS) [2,5-7], which have been successfully applied to human stature [5-7] and cognitive abilities [2]. This paper has several aims: to test the presence of correlated frequencies among GWAS hits and the predictive power of polygenic scores (average frequencies of GWAS alleles with positive effect), independently of spatial autocorrelation. A null model will be built using a large set of random SNPs and the polygenic selection model will be tested against it. A prediction is that the polygenic selection model provides a better fit to the data (i.e. average population IQ).
Piffer [8] identified 9 genomic loci (table S1) that were replicated across the three largest GWAS of educational attainment published to date [9-11]. The 9 loci contain GWAS significant alleles that were found to be in strong LD (r>0.8). One locus was replicated across three GWAS [9-11] and the same SNP (rs9320913) was found in two of them[9,11]. The population frequencies of the 9 pairs (one member belonging to each GWAS publication) of alleles were highly correlated (r=0.919), hence the SNPs published in [4] were used. Thus, this set of 9 SNPs was considered the best candidate for analysis of natural selection on educational attainment and related phenotypes (e.g. general cognitive ability or gca). Another set of 7 SNPs that reached significance in the UK Biobank and another database was identified by [11]. In addition, the full sets of 74 and 162 SNPs (respectively, the new hits and those found after pooling together different datasets) from the latest GWAS of educational attainment [11] will be employed. Average estimated population IQ will be used as the phenotype of interest and main dependent variable in the analyses. This choice can be justified by its privileged status in psychometric research and its robust genetic correlation (r= around 0.7) with educational performance [12] and attainment [13]. Moreover, the GWAS hits identified by the three educational GWAS also predict general cognitive ability in their samples [9-11]. A re-analysis of the Okbay et al. dataset revealed that the polygenic score also predicts general intelligence (3.6%) compared to 2% for the 2013 polygenic score [12].
2. Materials and Methods
Rietveld et al. [9] produced 3 SNPs reaching GWAS significance for educational attainment. Davies et al. [10] reported 1115 SNPs reaching GWAS significance, of which 15 were independent signals for educational attainment. 942 SNPs were found on 1000 Genomes. Among the 15 independent signals, one (2:48696432_G_A) was missing.
Okbay et al. [11] reported 74 SNPs associated with years of education. 70 were found in 1000 Genomes (the other 4 variants were flagged because they had more than 3 different alleles). An additional 162 SNPs were reported in the pooled meta-analysis (161 were found in 1000 Genomes).
A Monte Carlo simulation was performed using a random dataset, consisting of a large sample (N=7369) of matched random unlinked SNPs (downloaded from 1000 Genomes, phase 3). The empirical value p= (r+1)/(n+1) was calculated, where r is the number of runs whose Pearson’s correlation coefficient ( r x population IQ) was higher than the one found using the actual (GWAS-derived) polygenic score; n= total number of runs. The correct formula was provided by Davison & Hinkley [14].
3. Results
A correlation between all the variables (i.e. SNPs frequencies) was run on the entire random dataset (Suppl. File 1). This produced a very large correlation matrix (N=27,147,396 for the lower triangle).
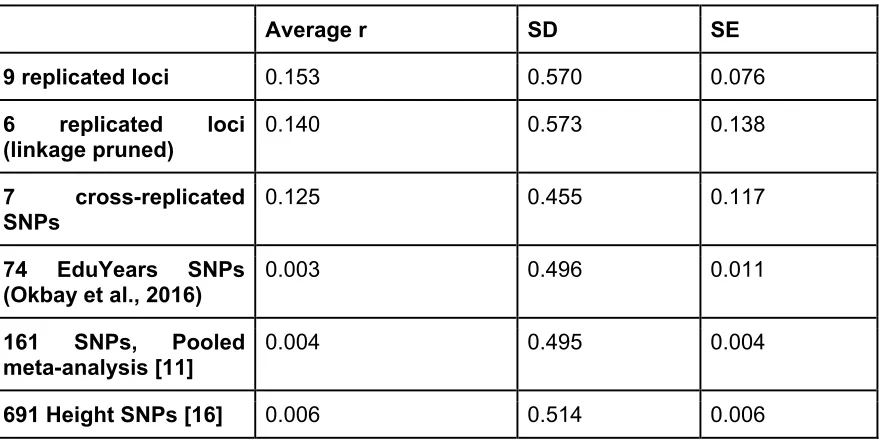
The average correlation coefficient was 0.058 (SD=0.537). The slightly positive value is likely due to the differential representation of minor alleles among populations. The same analysis was applied to the educational attainment GWAS hits (table 1).
The signal in the GWAS hits seems to be concentrated within a small subset of SNPs, possibly the 9 replicated loci and the 7 cross-replicated hits (r=0.153 and 0.125, respectively). Null results (table 1) were obtained for the 600+ SNPs from the largest GWAS of human height [17].
Since there was some LD between the 9 quasi-replicated SNPs, only one SNP per chromosome was retained, yielding 6 unlinked SNPs. This gave a “pure” (LD-free) measure of correlation. The average correlation was slightly higher than for the 9 SNPs (r=0.140), implying that LD did not produce the correlation among the full set of 9 hits.
Table 1. Average intercorrelation between allele frequencies.
Average r SD SE
9 replicated loci 0.153 0.570 0.076
6 replicated loci (linkage pruned)
0.140 0.573 0.138
7 cross-replicated SNPs
0.125 0.455 0.117
74 EduYears SNPs (Okbay et al., 2016)
0.003 0.496 0.011
161 SNPs, Pooled meta-analysis [11]
0.004 0.495 0.004
691 Height SNPs [16] 0.006 0.514 0.006
Correlation between polygenic scores and population IQ
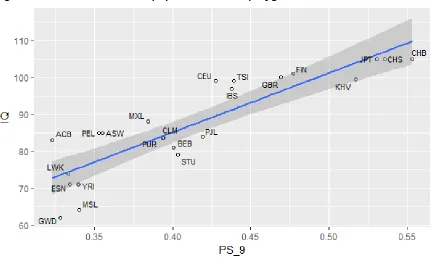
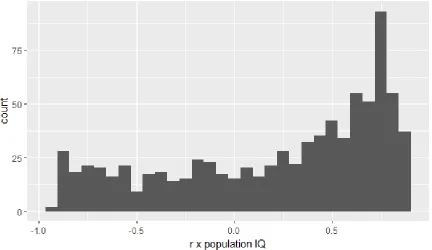
associated with each SNP. Because the correlation coefficients were not normally distributed (fig. 2), z-score computation was not appropriate. Hence, a Monte Carlo approach was used: the percentile corresponding to a correlation coefficient r=0.88 was found to be 99% (using the 818 random polygenic scores), implying that the result is highly significant (produced only 1 out of 100 times using random sets of SNPs). This procedure is equivalent to the traditional estimation of Monte Carlo p value, where p= r+1/n+1 (see Methods). That is, over a total of 819 runs, a correlation coefficient equal to or higher than 0.88 occurred 8 times, producing p= 0.011.
Figure 1. Correlation between population IQ and polygenic score.
The correlation between the 7 SNPs PS and population IQ was r=0.832. The correlation between the 161 SNPs polygenic score and population IQ was high (r=0.854), corresponding to the 98th percentile in the simulation (using PS comprising 161 random SNPs each). The 161 SNPs and the 9 SNPs polygenic scores were strongly correlated (r= 0.949).
Figure 2. Distribution of correlation coefficients (r population IQ x sets of nine random SNPs).
Controlling for spatial autocorrelation
The presence of spatial autocorrelation in a dataset means that the cases are not independent leading to an overestimation of degrees of freedom and, in the case of positive autocorrelation, an inflation in the correlation between two or more variables. The source of spatial autocorrelation in population genetics datasets is the similarity caused by admixture among neighbouring populations, and the differences caused by random drift. Demonstrating that the alleles predict population-level differences in average phenotypic values above and beyond that predicted on the basis of migration, drift etc, provides evidence for a model of polygenic selection.
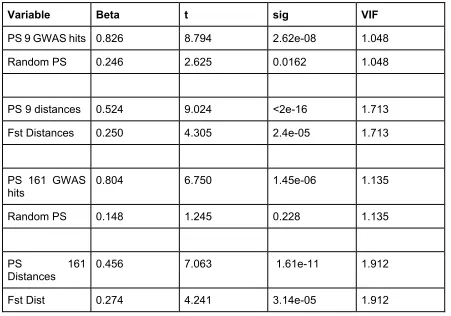
Population IQ was regressed on the “random PS” (computed using the 7k+ random SNPs) and the 9 GWAS hits PS. The model was significant (Adjusted R-squared: 0.815;
F-statistic: 49.4 on 2 and 20 DF, p= 1.829e-08).The random PS had low predictive power (B=0.247),whereas the 9 GWAS hits PS had strong predictive power (Beta=0.826). Similar results were obtained for the 161 SNPs PS (table 2) (Adjusted R-squared: 0.7251
F-statistic: 30.01 on 2 and 20 DF, p: 9.514e-07).
Table 2. Multiple regression with random SNPs and GWAS hits
Variable Beta t sig VIF
PS 9 GWAS hits 0.826 8.794 2.62e-08 1.048
Random PS 0.246 2.625 0.0162 1.048
PS 9 distances 0.524 9.024 <2e-16 1.713
Fst Distances 0.250 4.305 2.4e-05 1.713
PS 161 GWAS hits
0.804 6.750 1.45e-06 1.135
Random PS 0.148 1.245 0.228 1.135
PS 161 Distances
0.456 7.063 1.61e-11 1.912
Fst Dist 0.274 4.241 3.14e-05 1.912
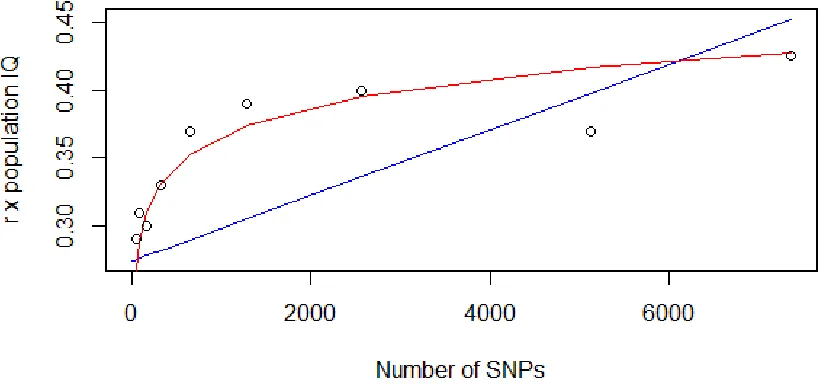
How does the number of SNPs affect the correlation between average population phenotypic value (i.e. IQ) and polygenic score?
Figure 3. Relationship between number of SNPs and predictive power.
4. Discussion
The method of correlating allele frequencies seems to have low power to detect signals of polygenic selection and picks up the signal only for the most powerful genetic loci. Simply computing polygenic scores (average of allele frequencies with positive GWAS beta) seems a more powerful method to detect polygenic adaptation. The polygenic score obtained from 9 quasi-replicated SNPs is a good candidate for estimating selection strength on educational attainment: it outperforms 99% of the polygenic scores obtained from random SNPs (Monte Carlo p= 0.011) , it has high predictive power (Beta= 0.88), being robust to tests controlling for spatial autocorrelation (table 2). Despite the lack of internal covariance (table 1) in the larger polygenic score (161 SNPs), its predictive power was strong (Beta= 0.8, after partialling out autocorrelation), outperforming 98% of the random polygenic scores.
The reliability of random polygenic scores increases as a logarithmic function of the number of SNPs, even with random SNPs, hence independently of selection signal and instead due to the reduction in noise. The correlation with population IQ asymptotically approaches a value around 0.45 (which can be interpreted as the degree of spatial autocorrelation in the dataset). Thus, the predictive power of polygenic scores should be scaled in proportion to the number of SNPs composing them (i.e. simulations with random SNPs need to be performed using the same number of SNPs as those of the GWAS hits polygenic scores).
A limitation of this study is the reliance on GWAS hits for a complex phenotype such as educational attainment, which shares the majority of additive genetic variation with general intelligence, but also other personality and health-related traits [12,19]. It is possible that there are other SNPs affecting cognitive variables unrelated to educational attainment and these may not necessarily be subject to the same selection pressures. Future studies should carry out “deep phenotyping” with SNPs from each chromosomal region that has produced hits in the educational attainment studies, to find out which of them are related to IQ (and its components, such as long-term memory, working memory, and abstract reasoning), and which are related to non-cognitive traits such as ambition, self-control, preference for abstract thinking, or incompetence in practical pursuits. There are reports indicating that school success is as much related to preferences and personality as to intelligence, and that these non-cognitive traits, if properly measured, are as heritable as IQ [20].
Another limitation is the reliance on estimates of population IQ as the phenotypic variable, which are not perfectly accurate, besides reflecting environmental and economic differences between populations.
Acknowledgments: No fundings were received to carry out this work.
Conflicts of Interest: “The authors declare no conflict of interest."
References
1. Piffer, D. (2013). Factor analysis of population allele frequencies as a simple, novel method of detecting signals of recent polygenic selection: The example of educational attainment and IQ. Mankind Quarterly, 54, 168–200.
2. Piffer, D. (2015). A review of intelligence GWAS hits: Their relationship to country IQ and the issue of spatial autocorrelation. Intelligence, 53, 43-50.
3. Pritchard, J. K., Pickrell, J. K., & Coop, G. (2010). The genetics of human adaptation: hard sweeps, soft sweeps, and polygenic adaptation. Current biology, 20, 208–21
4. Berg, J. J., & Coop, G. (2014). A population genetic signal of polygenic adaptation. PLoS Genetics, 10, e1004412.
5. Turchin, M. C., Chiang, C. W., Palmer, C. D., Sankararaman, S., Reich, D., Genetic Investigation of, A.T.C, et al. (2012). Evidence of widespread selection on standing variation in Europe at height-associated SNPs. Nature Genetics, 44, 1015–101
6. Zoledwieska et al., 2015. Height-reducing variants and selection for short stature in Sardinia. Nature Genetics 47, 1352–1356
7. Robinson et al. 2015.Population genetic differentiation of height and body mass index across Europe. Nature Genetics, 47,1357-62. doi: 10.1038/ng.3401
10. Davies, G., Armstrong, N., Bis, J. C., Bressler, J., Chourake, V., Giddaluru, S., et al. (2015). Genetic contributions to variation in general cognitive function: a meta-analysis of genome-wide association studies in the CHARGE consortium (N = 53949). Molecular Psychiatry, 20, 183–192. http://dx.doi.org/10.1038/mp.2014.188.
11. Okbay, A., Beauchamp, J.P., Fontana, M.A., Lee, J., Pers, T.H., et al. (2016). Genome-wide association study identifies 74 loci associated with educational attainment. Nature, doi:10.1038/nature17671
12. Krapohl, E., Rimfeld, K., Shakeshaft, N.G., Trzaskowski, M., McMillan, A., Pingault, J.-B., Asbury, K., Harlaar, N., Kovas, Y., Dale, P.S. & Plomin, R. (2014).The high heritability of educational achievement reflects many genetically influenced traits, not just intelligence. PNAS, 111, 15273–15278, doi: 10.1073/pnas.1408777111
13. Bulik-Sullivan, B., Finucane, H. K., Anttila, V., Gusev, A., Day, F. R., Loh, P.-R., … Neale. (2015). An atlas of genetic correlations across human diseases and traits. Nature Genetics, 47(11), 1236–1241. https://doi.org/10.1038/ng.3406
14. Davison, A.C., Hinkley, D.V. (1997) Bootstrap methods and their application. Cambridge University Press, Cambridge, United Kingdom
15. Tune H. Pers, Pascal Timshel, Joel N. Hirschhorn; SNPsnap: a Web-based tool for identification and annotation of matched SNPs. Bioinformatics 2014; 31 (3): 418-420. doi: 10.1093/bioinformatics/btu655
16. R Core Team (2016). R: A language and environment for statistical computing. R Foundation for Statistical Computing, Vienna, Austria. URL: https://www.R-project.org/. 17. Wood AR, Esko T, Yang J, et al.: Defining the role of common variation in the genomic
and biological architecture of adult human height. Nat Genet. 2014; 46(11): 1173–86 18. Mantel, N. (1967). The detection of disease clustering and a generalized regression
approach. Cancer Research. 27, 209–220.
19. Krapohl, E., Euesden, J., Zabaneh, D., Pingault, J.B., Rimfeld, K., von Stumm, S., Dale, P.S., Breen, G., O’Reilly, P.F., and Plomin, R. (2015). Phenome-wide analysis of genome-wide polygenic scores. Molecular Psychiatry, 1-6. doi:10.1038/mp.2015.126
20. Kovas, Y., Garon-Carrier, G., Boivin, M., Petrill, S.A. et al. (2015). Why children differ in motivation to learn: Insights from over 13,000 twins from 6 countries. Personality and
Individual Differences 80: 51-63