Journal of Chemical and Pharmaceutical Research, 2014, 6(11):334-340
Research Article
ISSN : 0975-7384
CODEN(USA) : JCPRC5
Analysis of Torsemide in bulk, dosage forms and dissolution samples using
RP-HPLC-PDA method
K. Vasantha, M. Sai Sree, G. Lakshmi Suneetha and Buchi N. Nalluri*
Department of Pharmaceutics, KVSR Siddhartha College of Pharmaceutical Sciences, Vijayawada, AP, India
_____________________________________________________________________________________________
ABSTRACT
The aim of the present work was to develop and validate a simple, effective and economical HPLC method for the analysis of Torsemide in bulk, dosage forms and in dissolution samples. A Zorbax C18 reverse phase column (150 ×
3.0mm, 3.5µm) and mobile phase containing 5mM ammonium acetate: acetonitrile (75:25 v/v) were used in isocratic mode. Quantification was achieved at 287nm. The retention time of Torsemide was 2.37 min and showed a good linearity in the concentration range of 10-50µg/mL with a correlation coefficient of 0.998. The validation parameters included specificity, linearity, and limit of detection, limit of quantification, precision, robustness and stability which fulfilled regulatory requirements in all the cases. The percent recoveries were in between 98-102 (RSD < 2). The method was successfully applied for the analysis of Torsemide in bulk, pharmaceutical dosage forms and in dissolution samples.
Keywords: Torsemide, Zorbax C18 column, PDA Detection, Method Validation, Dissolution Studies.
_____________________________________________________________________________________________
INTRODUCTION
Torsemide (TOR) is a diuretic belonging to the pyridine sulphonylurea class. Chemically it is 1-isopropyl-3-[(4-m-toludino-3-pyridyl)sulphonyl] urea. It is mainly used for the management of edema associated with congestive heart failure. It is also used at low doses for the treatment of hypertension[1]. Various analytical methods have been reported in the literature for quantitative determination of TOR individually using spectrophotometric method [2,3] and in combination with spironolactone by UV [4] HPLC [5] and in human plasma by HPLC [6,7]. TOR was estimated individually using few RP-HPLC methods [8,9]. However, the reported HPLC methods were for the analysis of TOR in combination with other diuretics and used non-volatile buffers in mobile phase which were not LC-MS compatible. The literature survey reveals that there were no validated RP-HPLC-PDA methods reported for the estimation of TOR individually in bulk, tablet dosage forms and in dissolution samples. Hence, the present investigation was aimed at developing a validated RP-HPLC-PDA method for the analysis of TOR in bulk, dosage forms and in vitro dissolution samples of TOR tablets which is LC-MS compatible and economical.
EXPERIMENTAL SECTION
Chemicals
TOR was obtained as a gift sample from Hetero Drugs Ltd., India. Ammonium acetate, water and methanol were purchased from E. Merck, Mumbai, India. All the solvents and reagents were of HPLC grade. Dytor 40
Equipment
A Shimadzu Prominence HPLC system provided with DGU-20 A3 degasser, LC-20AD binary pumps, SIL-20AHT auto sampler, and SPD-M20A PDA detector was used. Data acquisition was carried out using LC solutions software. The chromatographic analysis was performed on Zorbax C18 RP column (150 × 3.0mm, 3.5µm).
Chromatographic Conditions
Mobile phase consisting of 5mM ammonium acetate: acetonitrile (75:25 v/v) was used in isocratic mode and the mobile phase was filtered through Nylon disc filter of 0.45µm (Millipore) and sonicated for 3 min before use. The flow rate was 1 mL/min and the injection volume was 10µL. PDA detection was performed at 287nm and the separation was achieved at ambient temperature.
Preparation of stock and standard solutions
The stock solution of TOR (1mg/mL) was prepared by dissolving 10 mg of drug in methanol and the volume was adjusted to the mark with methanol. An appropriate volume of the stock solution was then further diluted with water to get the required concentrations of standard solutions in a concentration range of 10-50µg/mL.
Validation of the HPLC method
The proposed method was validated as per ICH guidelines [10].
Linearity
A linear relationship was evaluated across the range of the analytical procedure with a minimum of five concentrations. A series of standard dilutions of TOR were prepared over a concentration range of 10-50µg/mL (10, 20, 30, 40, 50µg/mL) from the stock solution and injected in triplicate. Linearity is evaluated with a plot of peak areas against concentration of the standard and the test results were evaluated by appropriate statistical methods. Slope, intercept, and regression coefficient (R2) and correlation coefficient (R) were calculated and the data was given in Table-1.
Precision
Precision is the measure of closeness of the data values to each other for a number of measurements under the same analytical conditions. Repeatability was assessed by using a minimum of six determinations at 100% of the test concentration. The standard deviation and the relative standard deviation were reported for precision. Less than 2% RSD for peak areas indicates the precision of the developed method and the data was presented in Table-1.
Specificity
The specificity of the method was determined by comparing the chromatograms obtained from the drug substance with that obtained from the tablet solution. The overlay of diluent, placebo, standard and sample were presented in Figure-2. The retention times of drug substance and the drug product were observed. Absence of interference of excipients in the tablet indicates the specificity of the proposed method.
Accuracy
Accuracy was established across the specified range of the analytical procedure. To ascertain the accuracy of the proposed method recovery studies were performed by the standard addition method by spiking 80%, 100%, 120% of the known quantities of standard within the range of linearity to the synthetic solution of drug product (20µg/mL) and these solutions were analyzed by developed method in triplicate. The percent recovery and RSD (%) were calculated at each level of addition and the data was given in Table-1.
Limit of Detection (LOD) and Limit of Quantification (LOQ)
LOD and LOQ were calculated based on calibration curves. They were expressed as LOD = (3.3 ×σ)/m; LOQ = (10.0×σ)/m (where, σ is the standard deviation of the y-intercepts of the three regression lines and m is mean of the slopes of the three calibration curves).
Robustness
______________________________________________________________________________
by changing wavelength by ±2nm and the effect of mobile phase composition was studied by changing the organic phase ratio by ±2% v/v. The data was given in Table-2.
System suitability
System suitability was carried out by injecting a standard concentration at different injection volumes in the range of 5-40µL. The system suitability test parameters were noted and RSD (%) was calculated.
Assay
Twenty tablets were weighed and finely powdered. The powder blend equivalent to 10mg of TOR was accurately weighed and transferred into a 5mL volumetric flask, dissolved in methanol and vortexed for 5min. The volume was adjusted up to the mark with methanol. The above solution was centrifuged and then filtered using Nylon disposable syringe filter (13 mm, 0.45µm). An aliquot of filtrate was diluted with water and analyzed in triplicate. The amount present in the each tablet was quantified by comparing the peak area of the standard R with that of the sample.
Filter compatibility study
Filter compatibility study was carried out using nylon disc filter (0.45µm) and PVDF (0.45µm) filter. Sample solution was prepared and the solution was filtered through 0.45µm nylon filter and PVDF (0.45µm) filter. Filtered samples were injected and chromatograms were observed. The data was given in Table-3.
Dissolution Analysis
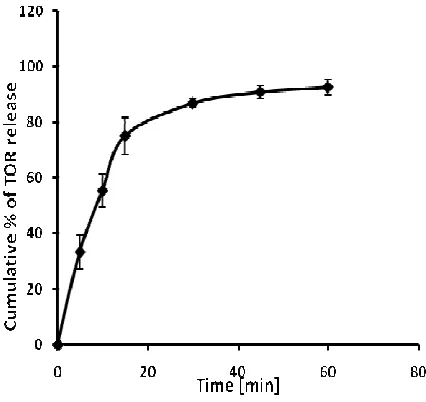
A calibrated dissolution apparatus (USP-II) was used with the paddle rotating at 50 rpm and bath temperature maintained at 37 ± 0.5°C. 900mL of freshly prepared and degassed 0.1N HCl was used as the dissolution medium. Dissolution samples were collected manually at 5, 10, 15, 30, 45, 60 min. At each time point, 5mL of sample was removed and filtered through a Nylon filter (0.45µm). An aliquot of filtrate was suitably diluted and analyzed by HPLC. The percent release of TOR in the test samples was calculated by comparing test area with the peak area of the standard. The results were tabulated in Table-4 and shown in Figure-3.
RESULTS AND DISCUSSION
Method Development
With water and methanol as mobile phase combination at various combinations and with different columns (Phenomenex C18 column, 150 x 3.0 mm, and Develosil RP aqueous column (250 × 4.6 mm, 5.0 µm) the TOR was
eluted as a broad peak. Finally, a mobile phase of 5mM ammonium acetate:acetonitrile was selected at a ratio of 75:25 v/v and a flow rate of 1.0 mL/min using a C18 column (Zorbax; 150 × 3.0mm, 3.5µm) and ammonium acetate
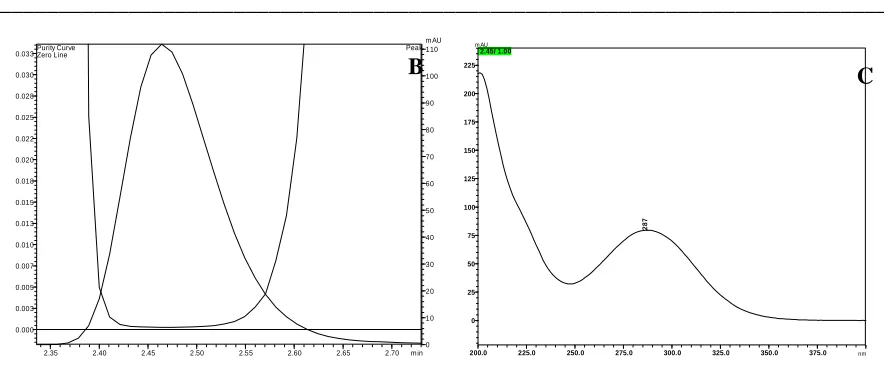
[5mM] as diluent. Under these conditions a sharp TOR peak with good symmetry was eluted at 2.37 min. For quantitative analytical purpose wavelength was set at 287nm, which provided better reproducibility without interference. The method was validated according to ICH guidelines. The peak purity index was found to be greater than 0.9999 and this indicating peak purity of the drug sample used in the analysis and shown in Figure-1 along with UV spectra.
0.0 0.5 1.0 1.5 2.0 2.5 3.0 3.5 4.0 4.5 m in
-10 0 10 20 30 40 50 60 70 80
m AU
287nm,4n m (1.00)
2
.3
7
0
2.35 2.40 2.45 2.50 2.55 2.60 2.65 2.70 m in 0.000 0.003 0.005 0.007 0.010 0.013 0.015 0.018 0.020 0.022 0.025 0.028 0.030 0.033 0 10 20 30 40 50 60 70 80 90 100 110 m AU Peak Zero Line Purity Curve
200.0 225.0 250.0 275.0 300.0 325.0 350.0 375.0 nm
0 25 50 75 100 125 150 175 200 225 m AU 2.45/ 1.00 2 8 7
Figure. 1: A - Chromatogram of TOR (20 µg/mL) B - Peak purity index of TOR and C - UV spectrum of TOR
Method validation
The method has been validated as per ICH-guidelines for following parameters.
Linearity
The range of reliable quantification was set at the concentrations of 10-50µg/mL of TOR. This range was selected based on 80-120% of the standard concentration used for accuracy and were analyzed in triplicate. Peak areas and concentrations were subjected to least square regression analysis to calculate regression equation. The correlation coefficient (R) was found to be 0.998 indicating a linear response over the range used. The data from the calibration curve was given in Table-1.
Precision
Precision studies were carried out in terms of repeatability. Repeatability was assessed by using six replicates of standard concentration of 20µg/mL and the data was given in Table-1. The RSD (%) was found to be below 2 for peak areas, indicating the precision of the method.
Accuracy
[image:4.595.76.518.90.274.2]Accuracy of the proposed method was ascertained by performing recovery studies using standard addition method. This was performed by spiking the synthetic solution of drug product (20µg/mL) with known quantities of standard at 80%, 100%, 120% of test solution and these solutions were analyzed in triplicate. The RSD (%) and the percent recovery were within the acceptable limits. It is evident from the results of accuracy study given in Table-1, that the proposed method enables very accurate quantitative estimation of TOR.
Table. 1: Linearity, Precision and Accuracy data of TOR
Validation data of TOR
Linearity(n=3)
Parameters TOR
Range
Regression equation Regression coefficient (R2) Correlation coefficient (R)
10-50µg/mL Y = 24270x -51010 0.998
0.996
Accuracy(n=3) Percent level of addition Mean Recovery(RSD)
80 100 120 102.99(0.11) 101.51(0.85) 105.40(0.01)
Precision(n=6) TOR
System Precision Method Precision
Average Peak area of the standard sample(RSD) 402489.30(1.91) Average peak area of the Assay sample(RSD) 351307.80(0.07)
Assay (mg) (n=3) Mean ± SD 102.47(1.76)
______________________________________________________________________________
Specificity
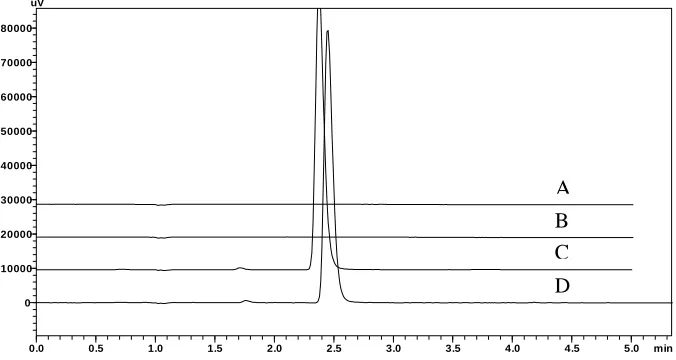
The specificity of the method was established by injecting the solutions of diluent, placebo, standard, sample (formulation) individually to examine any interference. From the overlay of chromatograms as shown in Figure-2 it can be inferred that there were no co-eluting peaks at the retention time of TOR, this shows that peak of analyte was pure and the excipients in the formulation did not interfere with the analysis and the peak purity indices for sample and standard was found to be greater than 0.999 and this confirms specificity of the method.
0.0 0.5 1.0 1.5 2.0 2.5 3.0 3.5 4.0 4.5 5.0 min
0 10000 20000 30000 40000 50000 60000 70000 80000 uV
Figure. 2: Overlay of chromatograms of Diluent (A), Placebo (B), Standard (C) and Sample (D)
Limit of Detection (LOD) and Limit of Quantification (LOQ)
LOD and LOQ were determined based on statistical calculation from the calibration curves, where LOD = (3.3 ×σ)/m; LOQ = (10.0×σ)/m (σ is the standard deviation of the y-intercepts of the three regression lines and m is mean of the slopes of the three calibration curves). The limit of detection for TOR was found to be 0.168 µg/mL; the drug peak could be detected without any base line disturbances at this concentration. The limit of quantification for TOR was found to be 0.511 µg/mL.
Robustness
[image:5.595.131.469.189.369.2]As part of the robustness, a deliberate change in the flow rate, wavelength and mobile phase composition was made to evaluate the impact on the method. Retention times were significantly changed with flow rate and no change in the retention time was observed in wavelength change. Percent assay values were also estimated under these changed conditions and the results were given in Table-2. The parameters like capacity factor, theoretical plate number and assay were not changed and were within the limits. These results indicated that the method is robust in terms of changed flow rate, wavelength and mobile phase composition.
Table. 2: Robustness data
Mobile phase composition
Drug Composition Retention time
(min) Theoretical plates (N) Tailing factor(Tf) Percent assay
TOR 24:76 2.62 3989.57 1.49 101.04
25:75 2.37 4003.43 1.49 101.55
26:74 2.65 4482.37 1.48 99.92
Wavelength (nm)
TOR 285 2.37 4003.43 1.04 99.03
287 2.37 4003.43 1.04 101.55
289 2.37 4003.43 1.04 99.54
Flow rate (mL/min)
TOR 0.9 2.62 4140.43 1.50 102.40
1.0 2.37 4003.02 1.49 101.55
1.1 2.15 3708.75 1.49 100.12
A
B
C
System suitability
System suitability testing is an integral part of the analytical procedure. System suitability studies were carried out by injecting five times a 20µg/mL standard concentration of TOR at different injection volumes ranging from 5µL to 40µL. The RSD (%) values for system suitability test parameters like retention time [Rt = 2.41 min], tailing factor
[Tf =1.57] and theoretical plate number [3135.678] were less than 2 indicating the present conditions were suitable
for the analysis of TOR in samples.
Assay
Assay of TOR tablets was performed by the proposed method and the percent assay of the formulation was calculated as mean of the three determinations, which was about 102.41 ± 0.18. These results indicate that the present HPLC method can be successfully used for the assay of TOR in bulk and dosage forms.
Stability of the stock solution
The stability of the stock solution was determined by analyzing the samples under refrigeration (8 ± 1°C) at different time intervals up to 48hrs. The percent variation in assay values at different time intervals were found to be less than 2 of the initial zero time interval solution, thus indicating that the solutions were stable for a period of 48hrs when stored at 8°C.
Filter compatibility study
[image:6.595.190.403.498.699.2]Filter compatibility study was carried out using nylon disc filter (0.45µm) and PVDF (0.45µm) filter. Sample solution was prepared and the solution was filtered through 0.45µm nylon filter and PVDF (0.45µm) filter. Filtered samples were injected and chromatograms were observed. The data was given in Table-3.
Table 3: Filter compatibility study
Sample name Peak area of TOR % Difference
Standard sample 400782 -
Samples filtered through 0.45µm nylon filter 400442 0.084
Samples filtered through PVDF filter 398754 0.005
Dissolution analysis of marketed product
The validated method was also used for the analysis of the TOR in in vitro dissolution samples. The percent drug release was found to meet the specifications as per ICH guidelines. NLT 85% (Q) of the labeled amount of TOR was dissolved in 30min, proving that the developed method can be successfully applied for the routine in-vitro dissolution sample analysis of TOR. The dissolution profile was shown in Figure 3.
______________________________________________________________________________
CONCLUSION
In this work, a simple, efficient and rapid RP-HPLC-PDA method was developed for the analysis of TOR in bulk, dosage forms and in in vitro dissolution samples of TOR tablets. The method was validated and found to be applicable for routine quality control analysis for the estimation of TOR in tablets and in dissolution samples using isocratic elution mode. The method provides selective quantification of TOR without interference from diluents and placebo. Therefore, this method can be employed in quality control to estimate the amount of TOR in bulk, dosage forms and in analysis of dissolution samples of marketed TOR tablets.
Acknowledgements
The authors are thankful to Hetero Drugs Ltd, India for providing gift sample and also to the Siddhartha Academy of General and Technical Education, Vijayawada, for providing necessary facilities to carry out this research work.
REFERENCES
[1]Goodman and Gilman’s the pharmacological basis of therapeutics, 9th Edition, MC Graw Hill, Health Professions Division, United States of America, 1996; 697.
[2]SB Bagade; SK Patil. Int. J. Pharm. QA, 2010, 2(1), 52-5.
[3]N Jain; R Jain; N Thakur; BK Gupta; J Banweer; S Jain. Der Pharmacia Lettre, 2010, 2(3), 249-254. [4]KG Hiresh; K Kavita; KS Sachin. Int. J. Pharm. Tech. Res., 2010, 2(4), 2246-2250.
[5]S Sharma; MC Sharma; SC Chaturvedi. Rapid Comms., 2010, 4(3), 427-430.
[6]AB Gamboa; JA Navoni; CM Contartese; AR Villagra; CM Lopez; EC Villaamil. Rev. Mex. Patol Clin., 2011, 54(4), 195-200.
[7]IJ Khan; P Loya; MN Saraf. Indian J. Pharm. Sci., 2008, 7(4), 519-522.
[8]S Rajesh; B Nidhi; P Vikas; G Dilip; PJ Alok. Asian J. Biomed. Phar. Sci., 2012, 2(15), 45-48. [9] KA Reddy. Int. J. Pharm. Sci., 2011, 3(3), 1462-1465.