Journal of Chemical and Pharmaceutical Research, 2014, 6(6):164-169
Research Article
ISSN : 0975-7384
CODEN(USA) : JCPRC5
The construction of college student’s satisfaction model based on
structural equation model
Shuxin Guo*
1, Fei Teng
1, Jiannan Guo
2and Yang Sun
31Management Science and Information Engineering College, Jilin University of Finance and Economics,
Changchun, P.R. China
2
Changchun School of Anda, Chanchun, P.R. China
3Industrial and Commercial Bank of China branch of Jilin Province, Chanchun, P.R. China
_____________________________________________________________________________________________
ABSTRACT
Structural equation model integrate factor analysis and path analysis of two mainstream model. Relationship has reserved variables for information complete and the processing of direct effect and indirect effect. Reflect more accurately of the real situation. In view of the student satisfaction important meaning for promoting higher education in china,this article carries on the questionnaire survey of 300 college students. According to the
structural equation model about customer satisfaction evaluation model is established for the college student satisfaction model and the potential effects of factors on student satisfaction change was analyzed. The experiment data obtained shows that the data of satisfaction model presented in this paper is the same as what gotten from people software testing center. Therefore, college student satisfaction model based on structural equation model has a strong practical value.,which has a broad prospect.
Keywords: Structural equation model; higher education; student satisfaction; influencing factors
_____________________________________________________________________________________________
INTRODUCTION
With the popularization of higher education in our country the deepening of the process, the improvement of college enrollment rate. To enter a university, is no longer remote. And from elite education to mass education. Dispersion tend to form the power of teachers. Insufficient hardware devices. With the ideal university life in stark contrast. The pessimistic atmosphere. The school life is "teacher oriented" to "student self-learning" model. Studies of not smooth also brings to university life sense of loss. College students as the country force. To improve university student satisfaction not only can improve the quality of teaching is also related to the hope of the nation. So the study of college students satisfaction is important.
______________________________________________________________________________
Based on the collected 300 college students about the satisfaction questionnaire analysis. The students' expectation, perceived quality, student satisfaction, structural equation model student loyalty four latent variables. On the factors affecting the students' satisfaction and loyalty are analyzed.
Structural equation model and its principle
Structural equation modeling,Also known as covariance matrix model. Joreskog put forward the concept model of
LISRET, the integration of the factor analysis and path analysis of two mainstream model[4]. As compared with the traditional statistics, with structural equation model to complete the information retained variables. Can deal with the relationship between the direct effect and indirect effect. Therefore, to tackle the same problem. Structural equation model can more accurately reflect the real situation. In recent years, structural equation model because of its special advantages are widely used in education, management, economic and other fields.
1.The concept of structural equation model
Structural equation model according to whether the variables can be observed directly. The variables are divided into two categories: latent variable and measurable variables. Latent variable is not directly observable variables. Such as satisfaction, work pressure, attitude. Measurable variables can be directly observed variables. Such as student achievement, income, price. According to whether the other variables. Variables are divided into endogenous and exogenous variables. The endogenous variable is affected by other factors in the model. The exogenous variables are not affected by other factors.
2.Structural equation model assumptions
That is a structural equation model of the null hypothesis, hidden variables model covariance matrix and the covariance matrix. But in practice, the general difference between the covariance matrix to measure the sample covariance matrix estimation and estimation of model fitting degree[5].
3.The model form of structural equation model
The two model includes structural equation model. Are the measurement model and structural model. The measurement model by the latent variable and measurable variables. The main description of the relationship between the latent variable and measurable variables. Structural model by the latent variables. Reflect the causal relationship between the latent variables. The following measurement model[6]:
(1)
In formula (1) X is the observation variable of ; Y is the observation variable of ; and are residual;
and are factor loading matrix.
The following is the form of structural equation :
(2)
In formula (2), is the endogenous latent variable, is exogenous latent variables; the residual, B and
are endogenous latent variable coefficient matrix and exogenous latent variables. represents the endogenous
latent variable number; express exogenous latent variables as endogenous latent number; B variable coefficient
matrix, describing the effects of endogenous variables as exogenous latent variables, is the coefficient matrix, describe the effects of exogenous latent variables are endogenous latent variables.
An empirical study on College Students' satisfaction 1. Established structural equation model
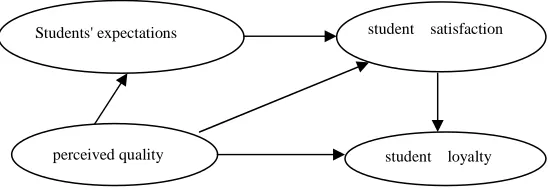
In recent years, research on every consumer satisfaction are gradually weak. Therefore, this paper will combine the loyalty and satisfaction. According to the causal relationship between student expectations, perceived quality, student satisfaction, student loyalty, the satisfaction evaluation model. Put forward a structure variable hypothesis.
H1: students perceived quality increases will cause the student satisfaction. H2: student satisfaction will lead to improved student loyalty.
H3: students are expected to improve will cause the student satisfaction.
H4: students perceived quality increases will cause the student is expected to improve. H5: students perceived quality increases will cause the student loyalty.
2. Questionnaire design
After the establishment of a structural equation model of college student satisfaction. According to the relationship between the latent variables and observed variables,in this paper, referencing to the relevant literature and the
[image:3.595.157.432.87.182.2]Bollen in 1989 to the structure equation model views. The questionnaire devide to seven scales. And established evaluation system specific as shown in table 1.
Table 1. College student satisfaction evaluation system
Latent variable The observed variables
The satisfaction evaluation index
The students expected The pre-school, understanding of teaching level
The pre-school, understanding of visibility The pre-school, awareness of employment
Perceived quality Relationship between teachers and students
School teachers' teaching ability The whole school hardware level
Satisfaction The humanization of school rules and policies
On the teaching activities of satisfaction The infrastructure of satisfaction
Loyalty Students to remain in school
Recommend the school to others Choose again, still choose this school
This questionnaire adopts electronic questionnaire to collect. Received a total of 300 questionnaires. The 124 boys. 176 girls. In them,fresher 76. sophomore 120. junior 80. senior 24.
[image:3.595.123.490.411.554.2]Analysis of structural equation model 1. Confirmatory factor analysis(CFA)
Table 2. Underlying dimensions analysis table
UNSTD S.E. C.R. P std SMC 1-SMC CR AVE
SE3 <--- SE 1 0.711 0.506 0.494
0.884 0.72
SE2 <--- SE 1.247 0.086 14.575 *** 0.93 0.865 0.135
SE1 <--- SE 1.228 0.085 14.363 *** 0.888 0.789 0.211
SS1 <--- SS 1 0.706 0.498 0.502
0.737 0.483
SS2 <--- SS 1.028 0.102 10.05 *** 0.707 0.500 0.500
SS3 <--- SS 1.024 0.106 9.656 *** 0.671 0.450 0.550
SL1 <--- SL 1 0.905 0.819 0.181
0.905 0.762
SL2 <--- SL 1.031 0.048 21.663 *** 0.908 0.824 0.176
Students' expectations student satisfaction
perceived quality student loyalty
[image:3.595.131.480.654.752.2]______________________________________________________________________________
According to Thomopson in 2004 proposed the structure equation model, should first analyze the measurement model, to ensure the correctness of the correct factors can measure model. In this paper, the measurement model of first-order confirmatory factor analysis. For the four aspect of the model: Students' expectation, perceived quality, satisfaction, loyalty, get the table 2 as follows:
Among them, SS is the student satisfaction, SQ is perceived quality, SE is the student expectations, SL is the student loyalty.
According to the table can know. Factor loading all between 0.67 and 0.93, and very significant. Composite reliability CR between 0.737 and 0.905. Multiple correlation coefficient square between 0.483 and 0.72. Meet the Hair (2009) and Fornell (1981), Larcker three standards: the factor loading greater than 0.5. The reliability of CR is greater than 0.6. Multiple correlation coefficient square more than 0.5. This paper studies the model of multiple correlation coefficient square except loyalty is slightly lower than 0.5, the rest are in line with the conditions. Can think of four aspects has convergent validity.
2. Significant test path coefficients of the student satisfaction model
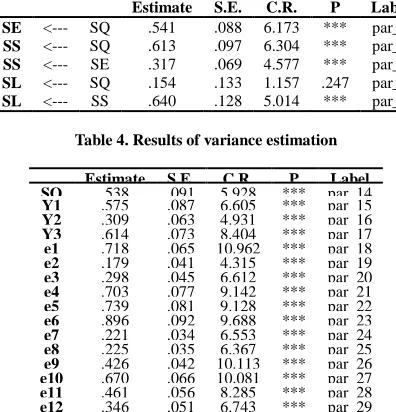
Table 3. Latent variable coefficient estimate table
Estimate S.E. C.R. P Label
SE <--- SQ .541 .088 6.173 *** par_1
SS <--- SQ .613 .097 6.304 *** par_2
SS <--- SE .317 .069 4.577 *** par_4
SL <--- SQ .154 .133 1.157 .247 par_3
[image:4.595.203.401.288.494.2]SL <--- SS .640 .128 5.014 *** par_5
Table 4. Results of variance estimation
Estimate S.E. C.R. P Label
SQ .538 .091 5.928 *** par_14
Y1 .575 .087 6.605 *** par_15
Y2 .309 .063 4.931 *** par_16
Y3 .614 .073 8.404 *** par_17
e1 .718 .065 10.962 *** par_18
e2 .179 .041 4.315 *** par_19
e3 .298 .045 6.612 *** par_20
e4 .703 .077 9.142 *** par_21
e5 .739 .081 9.128 *** par_22
e6 .896 .092 9.688 *** par_23
e7 .221 .034 6.553 *** par_24
e8 .225 .035 6.367 *** par_25
e9 .426 .042 10.113 *** par_26
e10 .670 .066 10.081 *** par_27
e11 .461 .056 8.285 *** par_28
e12 .346 .051 6.743 *** par_29
[image:4.595.163.452.614.707.2]Whether the parameter test model estimation has statistical significance, the general is a significant test on the load factor. The table of C.R. values (t statistic) or the p value analysis. When the p value is less than 0.05, can be considered that the path coefficients in the 95% confidence interval and zero exist significant differences. There is no reason to believe that the path coefficient is zero. Refuse to path for the original hypothesis of zero. According to the C.R. values in Table 2, 3, P only perceived quality to the loyalty of students of 4 values greater than 0.05. Can not refuse path regression coefficient is the original hypothesis of zero; but the analysis on the other path, C.R. values were significantly. This suggests the existence of strong correlation between.
Table 5. The satisfaction evaluation model fitness comparison table
Adaptation degree index Ideal targets University degree of satisfaction index
he smaller the better 121.560
<3 2.481
GFI >0.9 0.941
AGFI >0.9 0.906
RMSEA <0.08 0.071
TLI >0.9 0.949
IFI >0.9 0.962
CFI >0.9
3. College students satisfaction model fitness analysis
of the opinion. Based on χ χ2, 2/df,the matching fit degree (GFI), adjusted to fit (AGFI), average root mean square
(RMSEA) approximation error non reference fit (NNFI), incremental fit (IFI), the whole of the structural equation model goodness of fit test. The specific numerical fit condition and university student satisfaction model are shown in table 5.
From the table 5 we can see that the student satisfaction, evaluation model established by this research. Having a better fit. Objective response to the actual situation of samples.
CONCLUSION
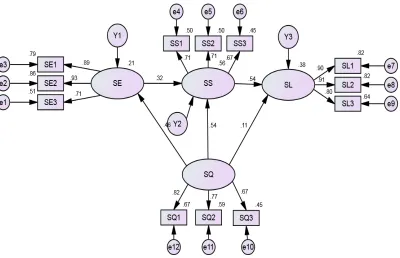
[image:5.595.93.493.322.580.2]Structural equation model constructed from Figure 2, each standard deviation increase in perceived quality. Will lead to 0.21 standard deviation is expected to improve students. A one standard deviation increase students' expectations, the increase will bring 0.32 standard deviations of the student satisfaction. Each standard deviation increase the perceived quality of indirect will bring the 0.1472 standard deviations of the student satisfaction. This is lower than the direct effect of satisfaction on the perceived quality of the students. Similarly we can know, lower than its indirect effect through the direct effect of perceived quality to improve student loyalty. This means used in the premise of other conditions are not changed, will be less than the higher education quality brought about by the student satisfaction through improving the publicity brought about by the student satisfaction effect. Although improving teaching quality in surface to enhance the loyalty of students is relatively low, but brought about through the intermediary of the satisfaction of students' loyalty is relatively large.
Figure 2. College student satisfaction evaluation model (Standardization)
Through the experiment, the statistical results of the student satisfaction model test results based on structural equation models presented in this paper truly matches the Chinese software testing center. Fully demonstrate the effectiveness of the model.
______________________________________________________________________________
REFERENCES
[1] Zhang Jie; Tan Jiandan. Research on higher education, 2013,1,9-22.
[2] Lin Zhao;Shi Jinghuan;Wang Peng; Wang Wen; Xu sweet. Education in Tsinghua University, 2012,5,19-32 [3] Lu Genshu. Journal of Xi'an Jiao Tong University study undergraduate courses: Social Science Edition,
2013,2,96-103.
[4] Qiu Haozheng. Journal of quantitative research, 2011, 3,6-16
[5] ML Wu . Structural equation model of AMOS, Operation and application of the press of Chongqing University, Chongqing,2010, 10-37.
[6] DH Yi. The method of structural equation model , Operation and application of the press of Renmin University of China, Beijing,2009,10-12.
[7] Oliver;R. L. Journal of Marketing,1999,63,33-44. [8] Bollen;Kenneth A.John Wiley&Sons,1989,3,24-34.
[9]Thompson;Bruce.Exploratory and confirmatory factor analysis,Understanding concepts and applications, American Psychological Association , 2004,89-100
[10]Schreiber, J.B.Administrative Pharmacy ,2008,4,83-97.