Journal of Chemical and Pharmaceutical Research, 2016, 8(5):482-493
Research Article
CODEN(USA) : JCPRC5
ISSN : 0975-7384
Comparative study of solid lipid nanoparticles and nanostructured lipid
carriers for
in vitro
Paclitaxel delivery
Shady Ali Swidan
1,2, Hassan Mahmoud Ghonaim
1, Ahmed Mahmoud Samy
3and Mamdouh Mostafa Ghorab
11Department of Pharmaceutics, Faculty of Pharmacy, Suez Canal University, Ismailia, Egypt 2Department of Pharmaceutics, Faculty of Pharmacy, Sinai University, Al Arish, Egypt 3Department of Pharmaceutics, Faculty of Pharmacy, Al Azhar University, Cairo, Egypt
_____________________________________________________________________________________________
ABSTRACT
Lipid nanoparticles are promising carriers to deliver anticancer agents of low aqueous solubility such as Paclitaxel (PTX). The aim of this work is to improve the efficacy of Paclitaxel through formulation of Solid Lipid Nanoparticles (SLN) and Nanostructured Lipid Carriers (NLC) containing two different liquid lipids. Preparation was done using homogenization and ultrasonication technique. Nanoparticles physical characterization was done by determination of the mean particle size, zeta potential and Transmission electron microscopy (TEM). Entrapment efficiency and Differential Scanning Calorimetry (DSC) was determined. In vitro release and cytotoxicity was done and results were compared to the commercially available product Taxol®.The mean particle diameter was between 276-314 nm, while zeta potential ranged from -20.2 and -24.9 mV. The entrapment efficiencies of prepared formulae were high(up to 87.6%) and thermal analysis revealed that the drug was in amorphous form. In vitro release through dialysis membrane showed prolonged release. In vitro cytotoxicity assay showed that IC50 of PTX-NLCs was significantly lower than that of Taxol®. NLC containing Capryol 90 had the best results in entrapment efficiency and lowest IC50. Both SLN and NLC can be potential carriers for prolonged release and to enhance activity of PTX.
Key words: Paclitaxel, Solid lipid nanoparticles, Nanostructured lipid carriers, Cytotoxicity, MCF7
_____________________________________________________________________________________________
INTRODUCTION
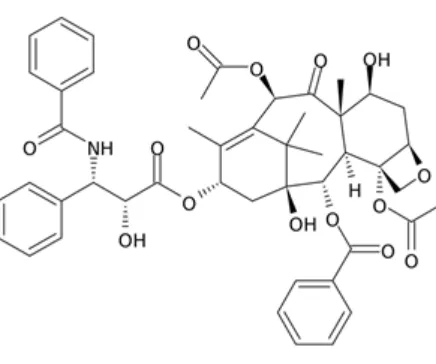
Paclitaxel (PTX) is a widely used therapeutically effective anticancer drug (Figure 1). It is naturally occurring compound derived from the bark of Taxus brevifolia the Pacific yew tree [1]. Due to its proven activity against several types of solid tumors, this antitubulin agent is now used as a treatment – either alone or in combination with other chemotherapeutic agents – for the management of advanced non-small-cell lung cancer, breast cancer, and ovarian cancer [2,3].PTX is administered intravenously as oral administration leads to poor bioavailability because of the very low water solubility of PTX (<1 µg/mL) [4] and low permeability across the intestinal membrane [5].
To avoid these severe side effects, different lipid nanoparticles with solid matrix were developed. The lipids employed in the preparation of lipid nanoparticles are usually biocompatible and biodegradable with low acute and chronic toxicity [10,11].
Various types of lipid based delivery systems like liposomes, nanoemulsions, solid lipid nanoparticles (SLN), and nanostructured lipid carriers (NLC) received growing attention [12,13]. Among the lipid based delivery systems, SLN, NLC are extensively studied [14]. This is due to the feasibility for large scale production performed in relatively simple, cost effective way. Other advantages of SLN and NLC are nontoxicity and easy availability of excipients made these systems industrially required [15-17].
Solid lipid nanoparticles are composed of a lipid matrix that should be solid at room and body temperatures [18]. They usually have a mean particle size between 50 nm and 1000 nm [19].SLN are extremely valuable for effective controlled-release delivery and prolonged stability of both lipophilic and hydrophilic drugs [20,21].Although the use of SLN is advantageous for many drugs, it is of much greater importance especially for anticancer agents. In addition to the natural ability of SLN to incorporate lipophilic drugs, the recently developed variety of SLN further extended the role of SLN to successfully encapsulate hydrophilic and even ionic compounds. SLN can also enhance the permeability and penetration of anticancer agents into the solid tumors [22].
In spite of the aforementioned advantages of SLN, they show some problems in stability and storage. When the solid lipids in SLN crystallize, they tend to form relatively perfect crystals having limited space for the drug to accommodate. This behavior causes a decreased loading capacity and expulsion of the drug from the particles during prolonged storage [23]. To overcome these limitations, a second generation of lipid particles was developed. NLC are composed of a solid lipid matrix containing spatially incompatible liquid lipids, resulting in more imperfections in the crystal lattice which increases the space for accommodation of the drug [24,25].The advantage of NLC over SLN is the increased loading capacity with actives and decreased leakage of drugs throughout the shelf life [23].
[image:2.612.197.415.463.645.2]The objective of this work is to incorporate the water insoluble PTX into SLN and NLC formulae. It also aims to compare between the two systems and investigate the effect of different liquid lipids in NLC. PTX loaded and free (unloaded) vesicles of both systems were developed. Their physicochemical properties such as particle size, zeta potential and entrapment efficiency were characterized. The rapid onset and prolonged in vitro release was evaluated. DSC is done to examine the crystallinity of PTX in the formulae. Moreover, the anticancer activity of PTX loaded NLC and SLN against MCF7 cell line was also studied against Taxol®.
Figure 1. Chemical structure of Paclitaxel
EXPERIMENTAL SECTION
Materials
monocaprylate) was a kind gift of Gattefosse (Saint-Priest, Cedex, France); Acetonitrile HPLC grade was purchased from Lab-Scan (Gliwice, Poland). Methylthiazolyldiphenyltetrazolium (MTT) and other chemicals for cell culture experiments were purchased from Sigma Chemical Company (St. Louis, MO, USA). All listed chemicals were used as supplied with no modification.
Preparation of SLN & NLC
[image:3.612.107.504.292.362.2]Un-loaded and PTX loaded SLN and NLC were prepared using high shear homogenization - ultrasonication technique as described in [26-28] with some modifications. Briefly, the oily phase - composed of: GM alone (free SLN), GM with PTX (loaded SLN), GM and Capryol or Oleic acid (free NLC), GM, Capryol or oleic acid and PTX (loaded NLC) - was added into small glass vials. The mixture in the vial was heated to 80° C, a temperature which exceeds the melting point of the lipid. The aqueous phase was prepared by dissolving Poloxamer 188 in distilled water and heated to the same temperature of oil phase. The aqueous phase was then added to the oily phase and homogenized using Heidolph silent crusher® homogenizer (Germany) at 20 000 rpm for 10 min. The obtained coarse emulsion is then sonicated using Branson sonifier® 450 (CT, USA). The sonication time was 15 minutes, on which the sonication power was set at 90% of maximum output. After sonication, nanoparticles were formed by congealing the sonicated dispersions for 2 hours at 4° C. The composition of the six nanoparticles formulae that were prepared in this study is listed in table 1.
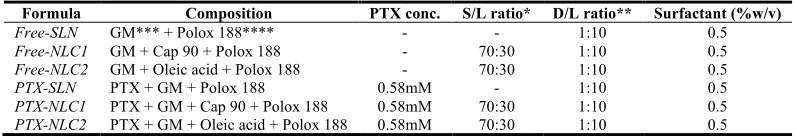
Table 1. Composition of the prepared free and PTX-loaded formulae
Formula Composition PTX conc. S/L ratio* D/L ratio** Surfactant (%w/v)
Free-SLN GM*** + Polox 188**** - - 1:10 0.5
Free-NLC1 GM + Cap 90 + Polox 188 - 70:30 1:10 0.5
Free-NLC2 GM + Oleic acid + Polox 188 - 70:30 1:10 0.5
PTX-SLN PTX + GM + Polox 188 0.58mM - 1:10 0.5
PTX-NLC1 PTX + GM + Cap 90 + Polox 188 0.58mM 70:30 1:10 0.5
PTX-NLC2 PTX + GM + Oleic acid + Polox 188 0.58mM 70:30 1:10 0.5
*S/L ratio: Solid lipid to liquid lipid ratio **Drug to lipid ratio ***GM: glycerylmonostearate ****Polox: Poloxamer
Characterization of Lipid Nanoparticles Particle Size Analysis
This analysis is used to determine the mean diameter and the polydispersity index (PI) which is a measure of the width of the size distribution. Particle size analysis of NLC and SLN was performed dynamic light scattering (DLS) using a photon correlation spectrometer Malvern Mastersizer X instrument (Malvern Instruments Ltd., Malvern, UK) with detection limit 0.1–2000 nm. All analysis measurements and setting were controlled using standard operation procedures. First, the samples of nanoparticle dispersions were diluted with suitable amount of deionized water, then diluted dispersions were added to the sample dispersion unit and the measurements were performed using a 45-mm focus objective and a beam length of 2.4 mm.
Zeta Potential
Zeta potential reflects the electric charge on the nanoparticles surface, which indicates to the physical stability of any colloidal systems. It was measured by determining the electrophoretic mobility using the Malvern Zetasizer 3000 HSA (Malvern Instruments, UK). The sample was measured in double distilled water and adjusted to a conductivity of 50 IS/cm with sodium chloride solution (0.9% w/v). The pH was in the range of 5.5–7.5 and the applied field strength was 20 V/cm.
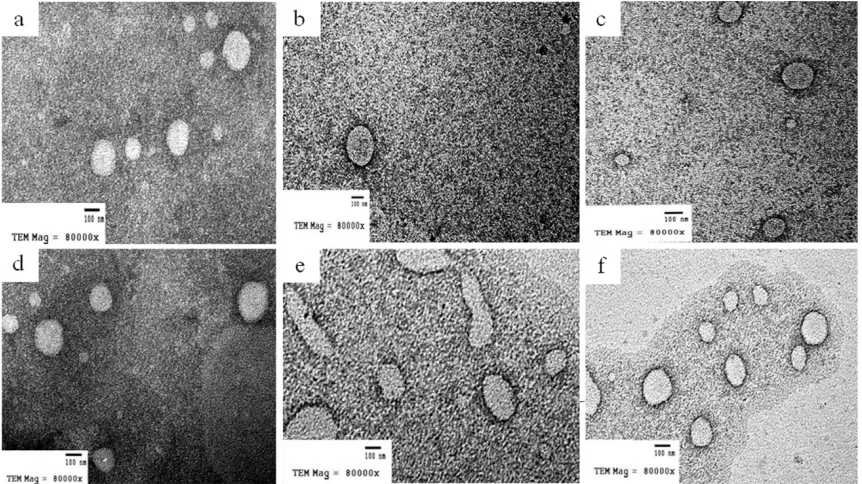
Transmission electron microscopy examination
The free and drug loaded nanoparticles are scanned morphologically by transmission electron microscopy (TEM) (model JTEM-1010, JEOL®, Tokyo, Japan) using a negative-staining method [29].A drop of the nanoparticle
dispersion was put on copper grid coating, and then the excess droplets were removed using filter paper. After 5 min, a drop of uranyl acetate solution (2% w/v) was then dropped onto the grids. After the samples being negatively stained and air-dried at room temperature, they were ready for the TEM investigation at 74 kV.
HPLC Analysis of Paclitaxel
was operated by EZchrom Elite version 3.3.2 SP1 by agilent. The mobile phase, acetonitrile–water (57:43, v/v), flow rate 1.0 ml/min. Sample absorption was measured at wave length 227 nm. The column temperature was maintained at room temperature. Prior to use, the mobile phase was filtered through a 0.45µm hydrophilic membrane filter. The sample injection volume was 60 µl.
Determination of PTX Entrapment Efficiency & Drug loading
The entrapment efficiency (EE) and drug loading (DL) were determined as described in [30] with some modifications. The desired amounts of PTX-SLN and PTX-NLC were dispersed in phosphate buffer solution (pH 7.4) containing 2 % (wt) Tween 80. Then they were vortexed for 5 min to dissolve the free PTX. The dispersion was centrifuged at 15 000 rpm for 30 min (model 2-16P, Sigma, Germany). This caused separation of the free PTX from PTX-NLC and PTX-SLN. After separation and suitable dilution, the amount of the free PTX in the dispersion medium was estimated by HPLC as described on the previous section. PTX entrapment efficiency and drug loading were calculated from the following equation:
𝑬𝑬 (%) =𝑾𝒕𝒐𝒕𝒂𝒍 𝑷𝑻𝑿 − 𝑾𝒇𝒓𝒆𝒆 (𝑷𝑻𝑿)
𝑾𝒕𝒐𝒕𝒂𝒍 (𝑷𝑻𝑿) 𝑿 𝟏𝟎𝟎
𝑫𝑳 (%) =𝑾𝒕𝒐𝒕𝒂𝒍 𝑷𝑻𝑿 − 𝑾𝒇𝒓𝒆𝒆 (𝑷𝑻𝑿)
𝑾𝒕𝒐𝒕𝒂𝒍 (𝑳𝒊𝒑𝒊𝒅𝒔;𝑷𝑻𝑿) 𝑿 𝟏𝟎𝟎
Wtotal(PTX), Wfree(PTX)andWtotal(lipids+PTX) are the weight of PTX added in the system, analyzed weight of PTX in
supernatant and weight of the total lipids plus total PTX added in the system, respectively [31].
All procedures are repeated three times and the mean ± SD of EE and DL were calculated.
The addition of 2% (wt) Tween 80% to the buffer was to dissolve the free PTX in the nanoparticle suspensions. Yang et al, stated that the solubility of PTX in 2% Tween 80-phosphate buffer solution was 28 micrograms per ml [30]. The nanoparticles were diluted with distilled water to guarantee the total amount of drug was lower than 28 micrograms per ml when determining the EE and DL.
In Vitro Release of Paclitaxel
The in vitro release of PTX was evaluated by the dialysis method as reported by studies [30,32] with slight modifications. The dialysis membrane was soaked for 24 hours before the experiment in the release medium (phosphate buffer, pH 7.4, and containing 2% Tween-80). Accurately measured one milliliter of the formulations and 1 ml of Taxol® was placed in the dialysis membrane, which was thoroughly tied to prevent leakage of the drug.
The dialysis membrane was put in a beaker containing 30 ml of the release medium. The beaker was protected from light and kept horizontally on a Clifton® shaking water bath (Nickel-Electro LTD, United Kingdom) rotating at 100
rpm for 48 hours. At predetermined time intervals, a 5 ml release medium samples was withdrawn and replaced by the same volume of fresh release media. The samples were diluted to a suitable concentration, then analyzed using HPLC method described above. The experiment was done in triplicate and the mean values ± SD was calculated.
Differential Scanning Calorimetry Analysis
Differential scanning calorimetry (DSC) was used to study the physical state and polymorphism of the SLN and NLC. The measurement was performed by differential scanning calorimeter, Shimadzu DSC-50, (Japan). The samples weighing 2-5 mg are heated and scanned between 25° C and 250° C and a heating rate of 10° C.min-1 under nitrogen gas flow (30 ml.min-1) [33]. DSC analyses were performed on the bulk lipids, the free NLC and SLN
formulae and PTX-loaded NLC and SLN formulae.
In Vitro Cytotoxicity Assay
The cytotoxicities of PTX loaded NLC and SLN compared to pure PTX powder and Taxol® were investigated
against MCF-7 human adenocarcinoma breast cancer cell line MCF-7. The cytotoxic effect was evaluated using the MTT (3-[4, 5-dimethylthiazole-2-yl]-2, 5-diphenyltetrazolium bromide) dye reduction assay [34]. Briefly, cells (0.5X10⁵ cells/ well), in serum-free media, were plated in a flat bottom 96-well microplate, and treated with 20 µl of different concentrations of the tested samples for 48 h at 37 ºC, in a humidified 5% CO2 atmosphere. After
MTT crystals were solubilized by adding 180 µl of acidified isopropanol / well and plate was shacked at room temperature, followed by photometric determination of the absorbance at 570 nm using microplate enzyme linked immunosorbant assay (ELISA) reader. Triplicate repeats were performed for each concentration and the average was calculated. Data were expressed as the fraction of survival compared with the untreated cells compared with the vehicle control, with cytotoxicity indicated by fraction relative viability. Survival fraction was calculated using the following equation:
Absorbance of treated cells Absorbance of control cells
Then the half maximal inhibitory concentration (IC50) was calculated from the equation of the dose response curve.
RESULTS AND DISCUSSION
All formulae were successfully prepared by homogenization ultra-sonication technique. This method has advantages over other different preparation methods such as the absence of organic solvents, easy procedures, fast production and capability of scaling up. In this study, glycerylmonostearate was chosen as the solid lipid matrix, oleic acid and Capryol 90 was used as the liquid lipid of the matrix. The Poloxamer 188 was used as surfactant. The use of Capryol 90 as the liquid lipid in NLC is quite novel, it is commonly used as surfactant in self-emulsified preparations, while only few and recent researches used it as a liquid lipid in nanoparticles [35].
Characterization of the Prepared Nanoparticles Particle size, Polydispersibility index and Zeta potential
Particle size, Poly dispersibility index and zeta potential values of the prepared free and drug loaded formulae are listed in table 2. The mean diameters of free nanoparticles were in the range of 276-314 nm, while PTX loaded naonparticles were 288-330 nm.
As noticed, there was a slight increase in the particle size due to drug incorporation. The addition of liquid lipid (in NLC formulae) was found to cause a decrease in particle size compared to SLN. Lin et al [36] stated that the incorporation of 30% liquid lipid caused a marked decrease in particle size compared to corresponding SLN. The effect of PTX incorporation and the use of liquid lipid on the vesicle mean diameter are illustrated in figure 2.Poly dispersibility index for all SLN and NLC were below 0.6 which indicates that all prepared formulae had uniform size and of narrow distribution. All SLN and NLC formulae were negatively charged and this negative charge was likely due to the slight ionization of fatty acids of GM and the negative charge of Capryol 90 and oleic acid at their carboxylic groups [37]. Zeta potential values are ranged closely between -20.2 and 24.9 mV. From these values it is clear that there was no specific effect neither of inclusion of PTX nor the addition of different types of liquid lipids. Highly negative zeta potential can contribute partially to the physical stability of the nanoparticle, while the use of steric stabilizers was also contributed in production stable formulations [38]. Poloxamer 188 is a nonionic surfactant; it sterically stabilizes the nanoparticles by forming a coat around their surface and decreases the electrostatic repulsion between the particles [39].
Table 2. Particle size (P.S.), Poly dispersibility index (P.I.), zeta potential (Z.P.) and entrapment efficiency (E.E.) and drug loading (D.L.) of different SLN and NLC (n = 3)
P.S (nm) P.I. Z.P. (mV) EE (%) DL (%) Free-SLN 314 ± 2.1 0.23 ± 0.06 -20.2 ± 1.3 - -
Free-NLC1 276 ± 1.5 0.40 ± 0.06 -21.4 ± 0.7 - -
Free-NLC2 306 ± 3.3 0.29 ± 0.09 -20.9 ± 0.8 - -
PTX-SLN 330 ± 1.8 0.33 ± 0.05 -21.3 ± 0.9 74.1 ± 1.6 6.74 ± 0.1
PTX-NLC1 288 ± 2.8 0.43 ± 0.03 -22.0 ± 0.7 87.6 ± 2.3 7.96 ± 0.1
PTX-NLC2 317 ± 1.1 0.54 ± 0.07 -24.9 ± 1.6 77.3 ± 1.9 7.03 ± 0.4
Transmission Electron Microscopy
within the electron beam column [41], while in LD technique, the size measurement obtained without exposure to vacuum.
Figure 2. The Effect of incorporation of dug on the particle size of SLNs and NLCs
[image:6.612.91.522.424.666.2]HPLC Analysis
[image:7.612.73.537.168.453.2]The HPLC technique was used to determine both entrapment efficiency and in vitro release. PTX was found to have a good linear relationship in 2% w/v Tween 80 phosphate buffer solution (PBS, pH 7.4), when its concentration was between 1 and 20 µg/mL (r = 0.997). A complete wave length scan (200-300 nm) and a typical chromatogram of PTX are shown in Figure 4. The λmax was 227 nm and the retention time was 10.5 min.
Figure 4. A typical HPLC chromatogram of PTX in PBS (pH 7.4) with 2% W/V tween 80. At left the characteristic peak of PTX, while at right, 3D wave length scan of the solution showing absorption and retention time
Entrapment Efficiency & Drug Loading
As listed in table 2, the entrapment efficiency of SLN was 74.1 %, of NLC1 was 87.6 % and of PTX-NLC2 was 77.3 %, while drug loading values of the three formulae were 6.74 %, 7.96 % and 7.03 % respectively.
The addition of tween to solution as stated in Yang et al., 2% Tween 80-phosphate buffer solution also did not damage the structure of NLC, so it is suitable medium for separating the free drug from the drug entrapped in PTX-SLN and PTX-NLCs [30].
It is obvious from our results that both PTX-NLC formulations had higher entrapment efficiency than PTX-SLN suggesting that NLCs are more efficient to incorporate PTX than SLNs. This finding is in agreement with Souto et al. who encapsulated Clotrimazole into both SLN and NLC [42]. The high entrapment efficiency of NLC compared to SLN could be explained by the less drug expulsion in NLC due to the addition of spatially incompatible liquid lipid forming less ordered inner structure which allows more PTX to be incorporated inside the NLC matrix [43].High entrapment efficiency could be also due to the higher solubility of PTX and other lipophilic compound in liquid oil than solid lipids [44].The addition of Capryol 90 as a liquid lipid caused significant increase in entrapment efficiency compared to oleic acid. This could be due to structural and spatial difference of Capryol 90 (Propylene glycol monocaprylate) and the solid lipid GM leading to more imperfections in the matrix offering space to accommodate more PTX, while OA is a monounsaturated fatty acid form of stearic acid [45].
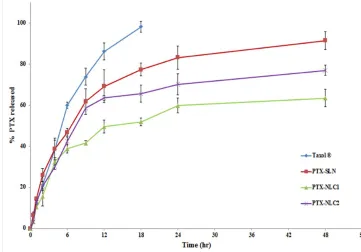
In Vitro Release
to 77.3%, 51.9% and 65.6 % of PTX was released from PTX-SLN, PTX-NLC1 and PTX-NLC2 respectively. In contrast, more than 98% of PTX was released from Taxol® during the same period. After 48 hours, 89.5% of PTX was released from PTX-SLN, 63.5% from PTX-NLC1 and 77% was released from PTX-NLC2.All lipid nanoparticles formulations released the drug in consistent and time dependent manner. It is clear that both SLN and NLC formulae showed a slower drug release manner compared to Taxol®. These findings are consistent with other researches which found that PTX or docetaxel - incorporated SLN and NLC are useful as sustained-release dosage form, decreasing the frequency of administration, which is advantageous in the clinical application. The slow release of PTX may be due to the lipophilic nature of PTX which is held in lipid core of SLN or NLC; it remains associated with the lipid nanoparticles and the drug release is mainly through dissolution and diffusion. PTX is taken up to target cells as nanoparticles not as free drug [24,46,47].
Concerning the effect of liquid lipid, it was found that PTX-NLC1 and PTX-NLC2 had released drug in slower manner compared to PTX-SLN, while the release of PTX from NLC containing Capryol 90 was slower than that containing oleic acid. This could be attributed to the entrapment efficiency difference in lipid nanoparticles. As stated in [48]the slow release profile of drug from nanoparticles is due to homogeneous entrapment of the drug throughout the system. Thus the addition of liquid lipid increased the entrapment efficiency in NLCs more than in SLN, and the addition of Capryol 90 as a liquid lipid lead to higher entrapment efficiency in PTX-NLC1than in PTX-NLC2. Thus PTX-NLC1 showed the most sustained release pattern compared to taxol® and other prepared
[image:8.612.122.483.313.565.2]formulae.
Figure 5.Release Profile of PTX-SLN, PTX-NLC1, PTX-NLC2 compared to Taxol®
Thermal Analysis
similar to and shows wider and slightly more shifted GM peak to lower temperature, which is an indication that miscible liquid lipids (Capryol 90 or oleic acid) had greater and additional effect compared to the amphiphile and colloidal size to promote disordered organization in the lattice. In the three PTX loaded lipid nanoparticles, GM showed same peaks as PTX free formulae, indicating that drug has no effect on melting of GM. It is also noticed that no melting peaks of PTX around 220° C were detected in the thermograms. It can be concluded that PTX was in amorphous (non-crystalline) state in both SLN and NLC; this behavior could be expected to enhance the water solubility of PTX in water resulting in a better bioavailability [51].
Figure 6.DSC thermograms of a) Pure PTX b) Pure GM c) Free-SLN d) Free-NLC1 e) Free-NLC2 f) SLN g) NLC1 h) PTX-NLC2
In Vitro Cytotoxicity Assay
To assess the cytotoxicity of the prepared formulae compared to pure PTX and Taxol®, human breast
adenocarcinoma cell line MCF-7 was used. The tumor killing activity of PTX loaded formulae was determined by MTT assay technique. The data obtained expressed in survival fraction are shown in Figure 7. PTX loaded SLN, NLC1 and NLC2 showed dose dependent cytotoxicity against MCF-7 cells. Their cytotoxicity was found to be comparable to that of the tested commercially available drug Taxol®. The IC50 of Taxol® against MCF-7 cell line
was 3.75 ± 0.07 µg/ml, while PTX-SLN has IC50 of 4.47 ± 0.15 µg/ml, PTX-NLC2 of 3.93 ± 0.17 µg/ml. The lowest IC50 value was obtained by PTX-NLC2 which equals 3.63 ± 0.22 µg/ml, this formula had higher cytotoxic activity compared to Taxol®. All prepared formulae had significantly lower IC50 compared to pure PTX powder (P < 0.05) which had IC50 of 21.4 µg/ml.
et al., showed that PTX loaded Nanoparticles showed significant decrease in IC50 compared to pure PTX against ovarian cancer cell line OVCAR-3 which was due to rapid uptake and intracellular presence of nanoparticles at 24 h. This allows for increased drug delivery to tumor cells and a greater likelihood of PTX presence during tumor cell division [52].
Figure 7. Cytotoxicity of PTX-SLN, PTX-NLC1 and PTX-NLC2 compared to pure PTX and Taxol® in MCF-7 cells after 48 h exposure
CONCLUSION
REFERENCES
[1] Thurston DE. Chemistry and pharmacology of anticancer drugs: CRC press; 2006. [2] Peltier S, Oger JM, Lagarce F, Couet W, Benoit JP. Pharm.Res.2006;23(6):1243-50. [3] Rowinsky EK, Donehower RC. N. Engl. J. Med.1995;332(15):1004-14.
[4] Yao HJ, Ju RJ, Wang XX, Zhang Y, Li RJ, Yu Y, et al. Biomaterials2011;32(12):3285-302. [5] Zeng N, Hu Q, Liu Z, Gao X, Hu R, Song Q, et al. Int.J.Pharm.2012;424(1-2):58-66.
[6] Hureaux J, Lagarce F, Gagnadoux F, Rousselet MC, Moal V, Urban T, et al. Pharm.Res.2010;27(3):421-30. [7] Shimomura T, Fujiwara H, Ikawa S, Kigawa J, Terakawa N. Lancet1998;352(9127):541-2.
[8] Scripture CD, Figg WD, Sparreboom A. Curr.Neuropharmacol.2006;4(2):165-72.
[9] Kim SC, Kim DW, Shim YH, Bang JS, Oh HS, Kim SW, et al. J. Control. Release2001;72(1):191-202. [10] Muller RH, Maassen S, Weyhers H, Mehnert W. J Drug Target.1996;4(3):161-70.
[11] Khalil RM, Abd-Elbary A, Kassem MA, Ghorab MM, Basha M. Pharm.Dev.Technol. 2014;19(3):304-14. [12] Sagalowicz L, Leser ME. Curr. Opin. Colloid Interface Sci.2010;15(1):61-72.
[13] Dolatabadi JEN, Valizadeh H, Hamishehkar H. Adv, pharm. Bulletin2015;5(2), 151
[14] Pezeshki A, Ghanbarzadeh B, Mohammadi M, Fathollahi I, Hamishehkar H. Adv. pharm. Bulletin2014;4(Suppl 2):563.
[15] Chen CC, Tsai TH, Huang ZR, Fang JY. Eur. J. Pharm. Biopharm.2010;74(3):474-82.
[16] Severino P, Andreani T, Macedo AS, Fangueiro JF, Santana MH, Silva AM, J. Drug deliv.2012. [17] Ansari S, Farha Islam M. J. Adv.Pharm. Technol.Res.2012;3(3):142.
[18] Hu L, Xing Q, Meng J, Shang C. AAPS PharmSciTech2010;11(2):582-7.
[19] Gasco MR. Method for producing solid lipid microspheres having a narrow size distribution. Google Patents;
1993.
[20] Ruktanonchai U, Limpakdee S, Meejoo S, Sakulkhu U, Bunyapraphatsara N, Junyaprasert V, et al.
Nanotechnology2008;19(9):095701.
[21] Suresh G, Manjunath K, Venkateswarlu V, Satyanarayana V. AAPS PharmSciTech2007;8(1):24. [22] Wong HL, Bendayan R, Rauth AM, Li Y, Wu XY. Adv.Drug Deliv. Rev.2007;59(6):491-504. [23] Muller RH, Petersen RD, Hommoss A, Pardeike J. Adv.Drug Deliv. Rev.2007;59(6):522-30. [24] Liu D, Liu Z, Wang L, Zhang C, Zhang N. Colloids Surf., B 2011;85(2):262-9.
[25] Narvekar M, Xue HY, Eoh JY, Wong HL. AAPS PharmSciTech2014;15(4):822-33.
[26] Burra M, Jukanti R, Janga KY, Sunkavalli S, Velpula A, Ampati S, et al. Adv. Powder. Technol.2012. [27] Abdelbary G, Fahmy RH. AAPS PharmSciTech2009;10(1):211-9.
[28] Manjunath K, Venkateswarlu V. J. Control. Release 2005;107(2):215-28.
[29] Zhang X, Liu J, Qiao H, Liu H, Ni J, Zhang W, et al. Powder technol.2010;197(1):120-8. [30] Yang XY, Li YX, Li M, Zhang L, Feng LX, Zhang N. Cancer letters2013;334(2):338-45. [31] Liu D, Liu Z, Wang L, Zhang C, Zhang N. Colloids Surf., B 2011;85(2):262-9.
[32] Das S, Ng WK, Tan RB. Eur. J. Pharm. Sci.2012;47(1):139-51.
[33] Martins S, Costa-Lima S, Carneiro T, Cordeiro-da-Silva A, Souto EB, Ferreira DC. Int. J. Pharm.2012 ;430(1-2):216-27.
[34] Twentyman PR, Luscombe M. Br. J. Cancer 1987;56(3):279-85.
[35] Zhang C, Peng F, Liu W, Wan J, Wan C, Xu H, et al. Int. J. Nanomedicine 2014;9:1049-63. [36] Lin X, Li X, Zheng L, Yu L, Zhang Q, Liu W. Colloids Surf., A 2007;311(1):106-11.
[37] Sanad RA, Abdelmalak NS, Elbayoomy TS, Badawi AA. AAPS PharmSciTech2010;11(4):1684-94. [38] Heurtault B, Saulnier P, Pech B, Proust J-E, Benoit J-P. Biomaterials2003;24(23):4283-300. [39] Ali H, Shirode AB, Sylvester PW, Nazzal S. Int. J. Pharm.2010;389(1-2):223-31.
[40] Gaumet M, Vargas A, Gurny R, Delie F. Eur. J. Pharm. Biopharm.2008;69(1):1-9. [41] How CW, Rasedee A, Manickam S, Rosli R. Colloids Surf., B2013;112:393-9. [42] Souto EB, Wissing SA, Barbosa CM, Muller RH. Int. J. Pharm.2004;278(1):71-7. [43] Mehnert W, Mader K. Adv. Drug Deliv. Rev.2001;47(2-3):165-96.
[44] Ruktanonchai U, Bejrapha P, Sakulkhu U, Opanasopit P, Bunyapraphatsara N, Junyaprasert V, et al. AAPS PharmSciTech2009;10(1):227-34.
[45] Sharma P, Ganta S, Denny WA, Garg S. Int. J. Pharm.2009;367(1-2):187-94. [46] Lee MK, Lim SJ, Kim CK. Biomaterials2007;28(12):2137-46.
[48] Paliwal R, Rai S, Vaidya B, Khatri K, Goyal AK, Mishra N, et al. Nanomed. Nanotechnol. Biology.Med. 2009;5(2):184-91.
[49] Das S, Chaudhury A. AAPS PharmSciTech2011;12(1):62-76.
[50] Jenning V, Thunemann AF, Gohla SH. Int. J. Pharm.2000;199(2):167-77.