3136
IMPACT OF EFFECTIVE PERFORMANCE EXPECTANCY,
EFFORT EXPECTANCY AND SOCIAL INFLUENCE ON
STUDENTS' BEHAVIOURAL INTENTION TO USE
BLACKBOARD
1AMJAD ALHARBI, 2NAHLA ALJOJO, 3AZIDA ZAINOL, 4ASMAA MUNSHI
1Faculty of Computing and Technology, Information Systems Department
King Abdulaziz University, Jeddah, Saudi Arabia Email: [email protected]
2College of Computer Science and Engineering, Information system and Technology Department
University of Jeddah, Jeddah, Saudi Arabia Email: [email protected]
3College of Computer Science and Engineering, Software Engineering Department
University of Jeddah, Jeddah, Saudi Arabia Email: [email protected]
4College of Computer Science and Engineering, Cybersecurity Department
University of Jeddah, Jeddah, Saudi Arabia Email: [email protected]
ABSTRACT
Learning Management Systems (LMS), such as Blackboard, are widely used in universities. However, many universities employing Blackboard have encountered various difficulties during implementation, specifically in the domains of effectiveness, acceptance of the LMS-based delivery of teaching courses, and students’ Behavioural Intention (BI) to use the LMS. Conducted at the Faculty of Computing and Information Technology (FCIT), King Abdulaziz University, Jeddah, Saudi Arabia, this empirical study aims to investigate the impact of Performance Expectancy (PE), Effort Expectancy (EE) and Social Influence (SI) on students' BI to use Blackboard. This study identifies three hypotheses to validate the effects of PE, EE and SI on the students' BI to use Blackboard. The participants of this study were students at FCIT, King Abdulaziz University. The pilot study sample consisted of 31 students. A questionnaire containing Arabic-language questions adapted from the Unified Theory of Acceptance and Use of Technology (UTAUT) instrument was distributed amongst the participants. The result exhibited both validity and internal reliability; furthermore, a correlation analysis validated the hypotheses, thus exhibiting that EE and SI do not have a significant effect on BI. Conversely, PE was observed to positively influence users’ BI. Although this study is a pilot study, the obtained results are promising that able to conclude the hypotheses.
Keywords: Learning Management System, Unified Theory Of Acceptance And Use Of Technology,
Behavioural Intention To Use.
1. INTRODUCTION
Learning Management Systems (LMS) are ICT tools that are Commonly employed in educational contexts. The technology emerged rapidly, and is now available in both open- (i.e. Moodle) and
commercial-source (i.e. Blackboard)
3137 different core services, most include “performance management, assessments, access control, and study schedule documentation, provision of learning content, and communication facilities” [4].
A number of universities have implemented e-learning systems in their programmes. However, the benefits of such systems are only apparent if the LMS is an operational success [5]. As with any other information system, an LMS’s success is measured in terms of its intended users' acceptance and usage [6]. Thus, when implementing an LMS, students’ acceptance should considered. If students’ acceptance were not to be duly considered, the LMS could fail. Many universities employing e-learning face difficulties regarding the adoption of successful strategies to address LMS effectiveness and students’ acceptance of the LMS-based delivering and teaching of courses [7]. In the case of King Abdulaziz University, Saudi Arabia, Blackboard has been used as a LMS software that help the students in their daily life to support the learning process. Thus, in order to measure the successful of LMS in King Abdulaziz University, there is a neccesity to conduct a study of students acceptance towards LMS. This study will help the management to focus on specific programmes, events or training for students for using LMS effectively.
A large number of models have been developed to investigate users’ intention to accept and use e-learning systems, including the “Technology Acceptance Model (TAM), the Theory of Planned Behaviour (TPB), Innovation Diffusion Theory (IDT), and the Unified Theory of
Acceptance and Use of Technology
(UTAUT)”. TAM is the most commonly adopted model thereof, being the foundations upon which subsequent models have been built [8]. Hence, adopting UTAUT, this study concentrates on investigating the extent to which Performance Expectancy (PE), Effort Expectancy (EE) and Social Influence (SI) influence students' behavioural intention to use Blackboard in Saudi Arabia.
2. THEORETICAL BACKGROUND
2.1 Technology Acceptance Model (TAM)
Rooted in Ajzen and Fishbein’s Theory of Action (TRA) model [10], the TAM is commonly employed to investigate users’ acceptance of
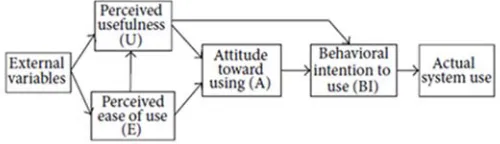
[image:2.612.323.573.463.535.2]technology [9], being based on the perspective that the extent to which a system is used is dependent on its users’ intention to use it. Such intention is determined by users’ attitudes regarding a system. For example, both a system’s perceived usefulness and the perceived ease with which it can be used affect users’ intention [11]. Furthermore, the TAM model replaces many of the behavioural constructs of the TRA model. Specifically, two new user acceptance factors are proposed: Perceived Usefulness (PU) and Perceived Ease of Use (PEOU). PEOU constitutes a measure of the degree to which an individual believes that it would easy to use a certain system, while PU measures the degree to which an individual believes that the use of a specific system would improve their job performance [11]. The TAM model is generally employed to define constructs that affect users’ technology-using intentions. Davis validated both PEOU and PU as essential determinants of user acceptance [11]. Furthermore, a large body of empirical researched has evidenced that TAM is the model most suited to explaining the use of Information Systems (IS) in business contexts [10]. However, as stated by Davis, the external variables of influence in contexts thereof have yet to be identified and investigated [11]. Davis also states that researchers should extend TAM (presented in Figure 1) to include external variables.
Figure 1: Technology Acceptance Model
2.2 Unified Theory of Acceptance and Use of Technology (UTAUT)
3138 an individual feels it would be easy to use a specific system), SI (measuring the extent to which a person recognises that the institution in which they work believes that they should use a specific system), and the usage-behaviour
determinant Facilitating Conditions
(FC) (measuring the extent to which a person believes that the organizational and technical infrastructures they use have been designed to enhance their use of a specific system) [12]. The
final construct thereof consists of four control variables; these essential moderators (i.e. experience, gender, age, and voluntariness of use, etc.) identify the behavioural intention to use a system. Figure 2 presents UTAUT’s main constructs and relationships [13].
Figure 2: Unified Theory of Acceptance and Use of Technology (UTAUT)
3. LITERATURE REVIEW
Researchers have mainly focused on determining the influence of external factors and their relationship with Perceived Usefulness (PU), Perceived Ease of Use (PEOU), Attitude Toward Use (ATT), and System Usage (SU). For example, exploring the effective elements influencing Egyptian students' usage-acceptance of an Open Learning and Training (OLAT) system, Mabed and Koehler (2012) posit a TAM-extended model in which self-efficacy and system quality are regarded as combined [14].
Yeou (2016) conducted a study at Moroccan university examining student’s attitudes towards the use of Moodle. This study focused on the relationship between the external factor computer self-efficacy and another TAM construct [15]. In addition, Moreno et al. (2017) explored individual differences, system characteristics, facilitating conditions, and social factors to determine students’ intention and attitudes towards the use of e-learning [16]. Tarhini et al. (2017) developed a TAM-dependent model to explore the influence of individual-level culture on students’ acceptance of e-learning tools
in Lebanon [17]. Similarly, Farahat (2012) conducted an Egyptian University-based study to identify the determinants of students' acceptance of e-learning. Modifying the TAM framework (i.e. to include the social influence of students' referent groups), Farahat also sought to examine the extent to which such determinants influence students' intention to use e-learning, [18].
Revythi and Tselios (2017) assessed both the technological acceptance of, and the behavioural intention to use LMSs. The researchers employed on eight TAM-derived variables (self-efficacy, year, perceived usefulness, perceived ease of use, system access, social norm and behavioural intention to use) to investigate the manner in which students do or do not accept various educational learning systems and the extent to which various factors influence technology acceptance [19].
Employing TAM, Muniasamy et al. (2014) measured the relationships between PEOU, PU, ATU and BI when using technology to investigate the degree to which the LMS at King Khalid University was accepted [20]. Finally, Examining the attitude- and perception-based factors that impact students’ acceptance of e-learning, Al-Harbi (2011) employed both TAM and the Theory of Planned Behaviour (TPB) as conceptual frameworks [21].
Thus, as demonstrated above, it can be concluded that researchers have yet to study the extent to which PE, EE and SI influence students' behavioural intention to use Blackboard.
4. RESEARCH QUESTIONS, HYPOTHESES & RESEARCH MODEL
The research questions are :
R1 : Does PE positively affect students' behavioural intention to use LMS?
R2: Does EE positively influence students' behavioural intention toward LMS?
R3: Do high levels of SI positively influence students' behavioural intention toward LMS? This study tests the following hypotheses:
H1: PE will positively affect students' behavioural intention to use LMS.
3139 H3: High levels of SI will positively influence students' behavioural intention toward LMS.
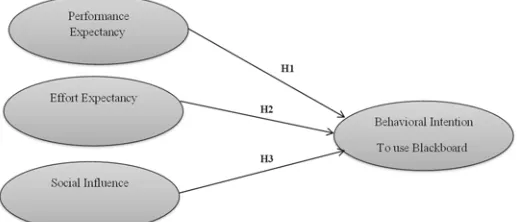
Independent Variables: The independent variable in this study is an effective on the students' behavioral intention to use Blackboard in Saudi Arabia based on three factors. These factors are
[image:4.612.34.293.199.310.2]PE, EE and SI (see figure 3).
Figure 3: Research Hypotheses and Research Model
5. METHODOLOGY
5.1 Procedures and Data Collection
As to both maximise the study’s positive outcomes and ensure the reliability and clarity of the various constructs and items employed thereof [22], a pilot study was conducted. 31 female students (aged 18-27) at King Abdul-Aziz University, Saudi Arabia, participated in the study.
Thus, prior to conducting the primary study, the researcher determined to examine both the reliability (internal consistency) and validity of the questionnaire. The pilot study was designed to test the questionnaire’s content, construct validity, and reliability prior to its primary utilisation. Furthermore, by virtue of the detailed participant feedback and questionnaire responses acquired thereof, the study allowed the researcher to detect (and consequently rectify) any ambiguous or confusing components [23].
31 female undergraduate students majoring in Computing Information Systems at King Abdul Aziz University participated in the pilot study. Participants were emailed a link to the soft copy of the web-survey, along with a cover letter explaining the context of the study. Participants
were required to complete the questionnaire and to provide detailed feedback regarding both the questionnaire’s format and content. The feedback attained thereof facilitated a number of minor revisions to the questionnaire (for example, the addition of construct-explanatory passages).
Due to the participant base, the Arabic rendering of the questionnaire was used for the pilot study. After the 31 participants submitted their questionnaires, SPSS software was employed to analyse the various samples’ reliability and validity, and thus to determine the extent to which the questionnaire was fit for use in the primary study.
Conducted in several stages, the pilot study was designed to both generate and assess the viability of questionnaire-attained data prior to the primary study. The researcher’s supervisors and a further five KAU faculty members assisted in the design of the pilot study. Furthermore, the instrument was reviewed by two experts from the Research Services Unit, both of which confirmed that the questionnaire’s design, wording, and measurement scales were fit for use. The study’s 31 participants provided mostly positive feedback; all subsequent modifications to the questionnaire were essentially minor in nature, and implemented with the approval of the researcher’s supervisors. Both the validity and reliability of the modified questionnaire were assessed via re-testing (as described in the next section). Finally, the modified questionnaire was approved by the researcher’s supervisors for use in the primary study.
5.2 Survey Design
3140 functionality, facilitating conditions, behavioural intention and use behaviour. Although the term ‘blackboard’ was used in place of the term ‘system,’ the structure of the various statements in the revised questionnaire remained essentially the same as those in the original version.
5.3 Reliability and Validity
Reliability and validity are regarded as measures of the degree to which a research instrument is free from error [24]. The following sections present the concepts and procedures that were employed during the course of the pilot study to examine (and subsequently rectify, if necessary) the reliability and validity of the questionnaire.
5.3.1 Reliability
As a measure, reliability constitutes the accuracy with which analytic constructs are employed in a study [25]; furthermore, reliability also functions as a means to determining both the exactitude and homogeneity of the various items that form such constructs [24]. Two types of reliability measurement are used in quantitative research contexts: stability (test-retest) and internal consistency [26] [24]. The stability reliability measure is employed to determine the extent to which factors, or a specific sample context, are consistent over time (a reliable instrument being an instrument that produces time- and respondent-consistent data). Thus, assuming the participation of a single sample, if a determinately reliable instrument were to be employed on two separate occasions, the data attained on both occasions would be identical. The internal consistency reliability measure is used to determine the degree to which the items of a particular construct are homogenous (i.e. pertain to the same characteristics), and thus the degree to which such items are capable of producing construct-specific results [24].
Assessing the average correlation of all items subsumed under a specific construct [27], Cronbach’s Alpha (α) is commonly employed to measure internal consistency in quantitative research contexts. Ranging in value between zero and one, the higher the value of Cronbach’s Alpha, the greater the reliability of a construct. In the
context of IS and social science research [24], a Cronbach’s Alpha of 0.7 or more is considered both acceptable and reliable. However, some scholars state that a construct can also be considered reliable if it achieves a Cronbach’s Alpha of 0.6 or above [28].
Regarding the present research model, the researcher used the internal consistency measure to examine the reliability of the various constructs employed therein.
What is this study Cronbach’s Alpha?
All of the themes (independent variables) have values that exceed the acceptable standard. The overall reliability (0.963 THIS STUDY VALUE) exceeds the recommended value of 0.70 (Sekaran, 2010). This indicates a high (overall) degree of acceptable, consistent scoring for the research.
5.3.2 Validity
In a quantitative context, the validity of a body of research is determined according to the verity and accuracy of its results [29]. Furthermore, being a measure of quality, validity has also been defined as the extent to which the inferences a researcher extracts from their gathered data are to be regarded as credible [27].
3141 Expert judgement was employed to validate the instrument used in this study. Staff members of the Research Services Unit, the Deanship of Graduate Studies, and the Computing Information Systems and Business departments (selected for both their extensive academic experience and subject-specific expertise) were asked to review the survey. After amending small portions of the questionnaire’s text (so as to avoid participant confusion), all the above-stated experts agreed the instrument was valid and thus ready for implementation.
6. RESULTS
6.1 Participants’ Demographic Data
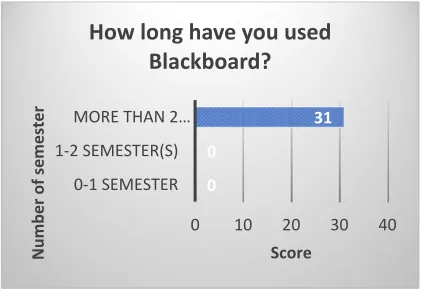
31 respondents (N = 31) participated in the study. 22 respondents (71%) were 18 to 22 years old, while 9 respondents (29%) were 23 to 27 years old. In terms of gender, all 31 respondents (100%) were female. Furthermore, all respondents were bachelor’s students, enrolled in the Faculty of Computing and Information System (FCIT), and studying for a major in information systems. In addition, figure 5 presents the respondents’ experience with Blackboard. All the respondents (100%) had more than 2 semesters worth of experience with Blackboard. Figure 6 shows the frequency with which the respondents used blackboard. 16 respondents (51.6%) always used Blackboard, 12 respondents (38.7%) regularly used Blackboard, and 3 respondents (9.7%) sometimes used Blackboard. Zero respondents
[image:6.612.306.530.47.209.2]never or rarely use Blackboard.
[image:6.612.316.527.253.398.2]Figure 4: The distribution of population according to age, gender, level of education, faculty and major.
[image:6.612.90.297.316.645.2]Figure 5: Experience with blackboard
Figure 6: The frequency with which Blackboard was used
6.2 Reliability
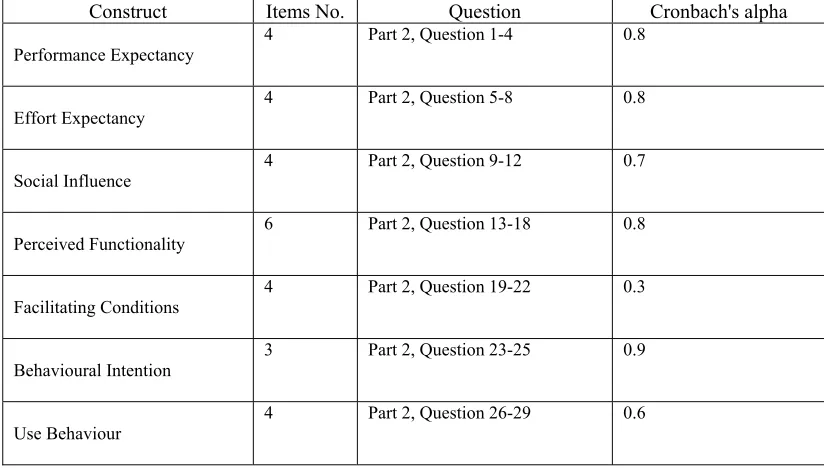
Only part two of the questionnaire (i.e. the part referring to UTAUT constructs) was tested in this study. As shown in Table 2, Cronbach’s Alpha was used to measure the reliability of the items for each construct. All of the requirements for internal consistency were acceptable; most items exhibited a reliability range of 0.7 to 0.9. Thus, the results presented in Table 2 confirm the reliability of the instrument employed in this study.
229 310 31 31 31 0 50
Age 18‐…
Age 23‐…
Fem
ale Male
Bach
elor FCIT
Infor ma…
Score 22 9 31 0 31 31 31
Distribution of
population
16 12 3 0 0
Score
Frequency
How frequently do you use
Blackboard?
0 0
31
0 10 20 30 40
0‐1 SEMESTER 1‐2 SEMESTER(S) MORE THAN 2 …
Score
Number
o
f semester
3142
Table 2: Reliability Cronbach’s Alpha for constructs as pilot study results
Construct Items No. Question Cronbach's alpha
Performance Expectancy
4 Part 2, Question 1-4 0.8
Effort Expectancy 4 Part 2, Question 5-8 0.8
Social Influence
4 Part 2, Question 9-12 0.7
Perceived Functionality
6 Part 2, Question 13-18 0.8
Facilitating Conditions 4 Part 2, Question 19-22 0.3
Behavioural Intention
3 Part 2, Question 23-25 0.9
Use Behaviour
4 Part 2, Question 26-29 0.6
As presented above, the only values slightly less than the required 0.7 were Facilitating Conditions and Use Behaviour. However, these results may be due to the small size of the sample (31 participants). The experts consultants advised the researcher that, at this stage of a pilot study, such results are acceptable and that there was no need to reconstruct or delete any items [24]. Consequently, it can be verified that the instrument was reliable and thus ready for empirical work (actual study).
6.3 Correlations Analysis
As seen in Table 3, inter-correlations among PEOU, PU, AT, and BI are as follows:
1. Performance Expectancy (PE) correlated positively with PF, FC, BI, and UB 2. Effort expectancy (EE) correlated
positively with SI, PF, FC, and UB 3. social influence (SI) correlated positively
with EE, BF, FC, and UB
4. Perceived Functionality (PF) correlated positively with PE, EE, SI, FC, BI and UB
5. Facilitating Conditions (FC) correlated positively with PE, EE, SI, PF , BI and UB
6. Behavioural intention (BI) correlated positively with PE, PF and UB
3143
PE EE SI PF FC BI UB
PE Pearson Correlation 1 .313 .275 .531** .375* .572** .321
Sig. (2-tailed) .086 .134 .002 .038 .001 .078
N 31 31 31 31 31 31 31
EE Pearson Correlation .313 1 .479** .580** .409* .239 .554**
Sig. (2-tailed) .086 .006 .001 .022 .196 .001
N 31 31 31 31 31 31 31
SI Pearson Correlation .275 .479** 1 .644** .424* .292 .531**
Sig. (2-tailed) .134 .006 .000 .017 .110 .002
N 31 31 31 31 31 31 31
PF Pearson Correlation .531** .580** .644** 1 .453* .606** .484**
Sig. (2-tailed) .002 .001 .000 .011 .000 .006
N 31 31 31 31 31 31 31
FC Pearson Correlation .375* .409* .424* .453* 1 .390* .358*
Sig. (2-tailed) .038 .022 .017 .011 .030 .048
N 31 31 31 31 31 31 31
BI Pearson Correlation .572** .239 .292 .606** .390* 1 .472**
Sig. (2-tailed) .001 .196 .110 .000 .030 .007
N 31 31 31 31 31 31 31
UB Pearson Correlation .321 .554** .531** .484** .358* .472** 1
Sig. (2-tailed) .078 .001 .002 .006 .048 .007
N 31 31 31 31 31 31 31
**. Correlation is significant at the 0.01 level (2-tailed).
[image:8.612.77.554.133.586.2]*. Correlation is significant at the 0.05 level (2-tailed).
3144
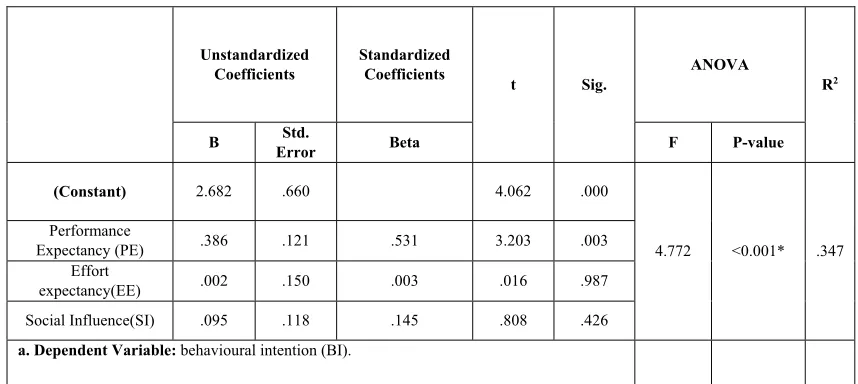
6.4 Multiple Regressing
Multiple regression was conducted to examine the impact of PE, EE and SI on students' behavioural intention to use Blackboard in Saudi Arabia. The results are presented in table 4.
[image:9.612.100.529.187.379.2]Table 4 show that a significant relationship exists between the dependent variable BI and the independent variables PE, EE and SI, where F=4.772 and P-value<0.001 (the coefficient of determination being 34.7%), but that no significant relationship exists thereof with EE and SI.
Table 4 The Multiple regressing between -Dependent Variable and Independent variables in study group
7. DISCUSSION
This study employed UTAUT to investigate the impact of effective PE, EE and SI on the students' behavioural intention to use Blackboard.
The students are aged from 18 to 27 and majority of them using Blackboard for two semesters and always use it. The result shown that out of three independent varibales, only one variable is corralated to behavioral intention.
Table 5: Summary of hypothesis testing
Hypothesis Specification Results
H1 PE will positively influence BI to use Blackboard Supported ((β = . .386, p <0.01)
H2 EE will negatively influence BI to use Blackboard Supported ((β = .002, p >0.01)
H3 SI will negatively influence BI to use Blackboard Supported ((β = .095, p >0.01)
Table 5 indicates the results of the linear regression analyses confirmed the three hypotheses. EE and SI did not have a significant effect on BI, while PE had the strongest impact on
BI to use Blackboard. Thus, this study has shown hat students believe that the use of a Blackboard would improve their job performance in terms of learning process.
8. CONCLUSION
This study has shown that, while PE positively influences students’ behavioural intention to use Blackboard, EE and SI negatively influence students’ behavioural intention to use Blackboard. As a coclusion, this result has shown that using Blackboard will enable students to improve the effectiveness of their learning process.
Unstandardized Coefficients
Standardized Coefficients
t Sig.
ANOVA
R2
B Std.
Error Beta F P-value
(Constant) 2.682 .660 4.062 .000
4.772 <0.001* .347
Performance
Expectancy (PE) .386 .121 .531 3.203 .003
Effort
expectancy(EE) .002 .150 .003 .016 .987
Social Influence(SI) .095 .118 .145 .808 .426
a. Dependent Variable: behavioural intention (BI).
3145 This study produced results that are similar to that of Maina and Nzuki’s (2015) findings regarding positive impact of performance expectancy on intention to use Blackboard [30].
Although this study is a small scale pilot study (31 participants), its results are promising and comprehensive. In the future, this study will be implemented in other faculties in King Andulaziz University in order to extract holistic conclusions regarding students’ behavioural intention to use Blackboard.
This study contributes to the general body of knowledge in understanding the acceptance factor of using Blackboard as LMS in education at higher institutions. These findings help the management to forecast and the implement a structured support program to assist students in using LMS efficiently.
REFERENCES:
[1] Al-Busaidi, K. and Al-Shihi, H. (2010). Instructors' Acceptance of Learning Management Systems: A Theoretical Framework. Communications of the IBIMA,
pp.1-10.
[2] Paulsen, M. (2003). Experiences with learning management systems in 113 European institutions. Educational Technology & Society, 6(4), pp.134-148.
[3] Paulsen, M. (2002). Online Education Systems: Discussion and definition of terms. NKI distance education, 202.
[4] Alharbi, S. and Drew, S. (2014). Using the
Technology Acceptance Model in
Understanding
Academics’ Behavioural Intention to Use
Learning Management
Systems. International Journal of Advanced Computer Science and Applications, 5(1).
[5] Pituch, K. and Lee, Y. (2006). The influence of system characteristics on e-learning use. Computers & Education, 47(2),
pp.222-244.
[6] George Saadé, R., Nebebe, F. and Tan, W. (2007). Viability of the "Technology Acceptance Model" in Multimedia Learning
Environments: A Comparative
Study. Interdisciplinary Journal of e-Skills and Lifelong Learning, 3, pp.175-184.
[7] Zuvic-Butorac, M., Roncevic, N., Nemcanin, D. and Radojicic, Z. (2011). Blended
E-Learning in Higher Education: Research on Students’ Perspective. Issues in Informing Science and Information Technology, 8,
pp.409-429.
[8] Tarhini, A., Hassouna, M., Abbasi, M. and Orozco, J. (2015). Towards the Acceptance of RSS to Support Learning: An empirical study to validate the Technology Acceptance Model in Lebanon. Electronic Journal of e-Learning, 13(1), pp.30-41.
[9] Davis, F. (1985). The technology acceptance model for empirically testing new end-user information systems: theory and results.
Ph.D. Massachusetts Institute of Technology.
[10] Bousbahi, F. and Alrazgan, M. (2015). Investigating IT Faculty Resistance to Learning Management System Adoption Using Latent Variables in an Acceptance Technology Model. The Scientific World Journal, 2015, pp.1-11.
[11] Davis, F. (1989). Perceived Usefulness, Perceived Ease of Use, and User Acceptance of Information Technology. MIS Quarterly,
13(3), p.319.
[12] Byungura, Jean, 2015. E-learning management system for the thesis process support from a supervisor perspective. The case of SciPro System at University of Rwanda. Master’s thesis. Sweden: Jönköping
University.
[13] Venkatesh, Morris, Davis and Davis (2003). User Acceptance of Information Technology: Toward a Unified View. MIS Quarterly,
27(3), p.425.
[14] Mabed, M. and Koehler, T. (2012). An Empirical Investigation of Students’ Acceptance of OLAT as an Open Web-Based Learning System in an Egyptian Vocational Education School. International Journal of Web-Based Learning and Teaching Technologies, 7(1), pp.36-53.
[15] Yeou, M. (2016). An Investigation of Students’ Acceptance of Moodle in a Blended Learning Setting Using Technology Acceptance Model. Journal of Educational Technology Systems, 44(3), pp.300-318.
[16] Moreno, V., Cavazotte, F. and Alves, I. (2017). Explaining university students’ effective use of e-learning platforms. British Journal of Educational Technology, 48(4),
3146 [17] Tarhini, A., Hone, K., Liu, X. and Tarhini, T.
(2017). Examining the moderating effect of individual-level cultural values on users’ acceptance of E-learning in developing countries: a structural equation modeling of an extended technology acceptance model. Interactive Learning Environments,
25(3), pp.306-328.
[18] Farahat, T. (2012). Applying the Technology Acceptance Model to Online Learning in the Egyptian Universities. Procedia - Social and Behavioral Sciences, 64, pp.95-104.
[19] Revythi, A. and Tselios, N. (2017). Extension of Technology Acceptance Model by using System Usability Scale to assess behavioral intention to use e-learning. arXiv preprint arXiv:1704.06127.
[20] Muniasamy, V., Ejalani, I. and Anandhavalli, M. (2014). Prediction of Learner Perception and Acceptance of E-Learning System for
Learning with TAM (Technology
Acceptance Model) in King Khalid
University, Kingdom of Saudi
Arabia. International Journal of Emerging Technology and Advanced Engineering,
4(9).
[21] Al-Harbi, K. (2011). e-Learning in the Saudi tertiary education: Potential and
challenges. Applied Computing and
Informatics, 9(1), pp.31-46.
[22] Cohen, L., Manion, L. and Morrison, K. (2001). Research methods in education. 5th
ed. London: Routledge Falmer.
[23] Szajna, B. (1996). Empirical Evaluation of the
Revised Technology Acceptance
Model. Management Science, 42(1),
pp.85-92.
[24] Swesi, K. (2012). An Investigation into the Influence of Learning Styles and other Factors Affecting Students’ Perception of Virtual Learning Environments. Ph.D. De
Montfort University.
[25] Venkatesh, V. (2000). Determinants of Perceived Ease of Use: Integrating Control, Intrinsic Motivation, and Emotion into the Technology Acceptance Model. Information Systems Research, 11(4), pp.342-365.
[26] Venkatesh, V. and Davis, F. (2000). A Theoretical Extension of the Technology Acceptance Model: Four Longitudinal Field Studies. Management Science, 46(2),
pp.186-204.
[27] Winter, G. (2000). A Comparative Discussion of the Notion of 'Validity' in Qualitative and Quantitative Research. The Qualitative Report, 4(3), pp.1-14.
[28] Bagozzi, R. and Yi, Y. (1988). On the Evaluation of Structural Equation
Models. Journal of the Academy of
Marketing Science, 16(1), pp.74-94.
[29] Golafshani, N. (2003). Understanding Reliability and Validity in Qualitative Research. The Qualitative Report, 8(4),
pp.597-607.