www.wjpls.org 1 Muttaka et al. World Journal of Pharmaceutical and Life Sciences
IN-SILICO T-CELL EPITOPE PREDICTION TOOL OF HEPATITIS C VIRUS (HCV)
Auwalu Muttaka1*, Abdul-Hamid Abubakar Zubair1, Sani S. Usman2, Kaushik Vicas3
1Department of Chemistry, Faculty of Science, Federal University Gusau, P.M.B. 1001, Zamfara, Nigeria.
2
Department of Biological Sciences, Faculty of Science, Federal University of Kashere P.M.B. 0182, Gombe, Nigeria.
3Department of Biotechnology, Faculty of Bioscience and Biotechnology, Lovely Professional University Punjab,
India.
Article Received on 23/09/2019 Article Revised on 13/10/2019 Article Accepted on 03/11/2019
GENERAL INTRODUCTION
Support Vector Machines (SVMs) are optimized learning algorithms used for binary class label prediction. Recently, the SVMs become most significant tools for medical researches such as drug discovery for searching of novel active compounds and prediction of their properties.[1]
The performance of the SVMs is well increased and monitored in various area of biological analysis which includes gene expression in microarray etc.[2] prediction of remote protein homologies,[3] and detecting the site for initiation of translation of proteins.[4]
Apart from accurate and comprehensive separation of the data samples into appropriate classes, the SVMs also analyze various properties of the data. The SVMs are relatively modified type of learning algorithm which was introduced by Vapnik and co-workers in the first time.
Moreover, SVMs are currently being modified and extended by many researchers. The ability of the SVMs to function as a robust tool that deal with sparse and
noisy data make them to be the system of interest and choice in various applications ranging from text categorization to prediction of functional proteins.[5]
The SVMs classify and break off a given set of binary labeled trained data with a hyper-plane that is maximally distant from them and this simply means “the maximal margin hyper-plane”. However, if there is no linear separation, they usually work together with “kernel” technique that recognizes non-linear mapping to a feature space automatically.[6]
Hepatitis C virus (HCV) is worldwide health threaten pathogen. It is a small single stranded RNA. It is also the most causative agent of various liver diseases including hepatocellular carcinoma, chronic liver disease etc. It was estimated that, 130-150 million of peoples worldwide were infected and 3-4 million people newly infected increased yearly, this is the indication of progressive increasing of the infection.[7]
Furthermore, it was observed that, the infection also depend on the variation of both gender and age.
World Journal of Pharmaceutical and Life Sciences
WJPLS
www.wjpls.org
SJIF Impact Factor: 6.129*Corresponding Author: Auwalu Muttaka
Department of Chemistry, Faculty of Science, Federal University Gusau, P.M.B. 1001, Zamfara, Nigeria.
ABSTRACT
Hepatitis C Virus (HCV) is a ssRNA infectious microbe that affects and kills millions of people worldwide annually However, various part of the virus that can be recognized processed and dealt with by immune system, such as B-cells, T-cells or microphages are known as epitopes or antigenic determinants. Knowledge of these epitopes is invaluable for the research and development, of vaccine and drug design, that will eradicate and diminish this life threaten virus. There is an exponential increase in the expression of these epitopes regularly which make them difficult to be handled. To rectify and deal with this problem, a new computational method was developed to analyze such kind of large data with the help of support vector machine (SVM). This analytical method consists of training, testing, classifying and validation of both T-cell epitopes and non T-cell epitopes of hepatitis C virus (HCV). To improve the performance of this method, the data were divided into (70% and 30%), (80% and 20%) and (90% and 10%) of train and test respectively using non-epitopes as control. The accuracy of class of data with amino acids feature (polarity, acidity, alkalinity, aliphaticity, etc) and without amino acids features were noted. The result was obtained by taking the average of the %accuracy which indicates high performance and potentiality of this method.
KEYWORDS: Hepatitis C virus (HCV), Immune system, Epitopes, drug design, life threaten, support vector
According to majority of report of different researches, the HCV is dominant among 2.4-6.5% in the case of adults while among children is 0.44-1.6%,[8] from the analysis, HCV genotype 3a is cheaply and abundantly
common in Asian Country such as Pakistan.[9]
The HCV belongs to one of family of Flaviviridae. It has 9.5 kb functional genome (ssRNA) that encodes for a large polyprotein which cleaved to produce four structural proteins (C, E1, E2 and P7) as well as six “6” non-structural proteins domain (NS2, NS3, NS4A, NS4B, NS5A and NS5B). The viral proteins enable it to replicate and perform various metabolic and cellular functions.[10,11]
Envelop proteins are the part of HCV structural proteins which play significant role in helping the virus get entered into the host. The hepatitis C virus envelop protein 1 (E1) refers to a transmembrane glycoprotein having a C-terminal domain that help in membrane
adherence and membrane permeability modification.[12]
E1 serves as a fusigenic subunit in which the HCV envelop depend. It has 4-5 N-linked glycons which interact with different cell receptors and consequently result in hepatitis C virus infection.[13]
Furthermore, the E1 is glycoprotein of interest that helps pharmaceutical industries to produce medicine which will target and prevent the entrance of the virus to the host, even though, the mechanism of the E1 involvement in HCV infection is not fully understood, some researchers thought it to be likely due to
intra-cytoplasmic virus-membrane fusion.[14]
METHODOLOGY
Recently, various methods have been developed for performing identification of T-cell epitopes of HCV but these methods can only analyze a few numbers of the epitopes. However, most learning techniques do not perform well on datasets by which the number of features is larger and diversified. To rectify and minimize these problems, support vector machines (SVMs) come into existence. The SVMs can test, classify and validate a given data easily.
Retrieval of T-Cell Epitopes of Hcv
To get authentic and reliable model for prediction of the T-Cell epitopes of HCV, the protein sequence of hepatitis C virus (HCV) is retrieved from research papers (15-33) via pubMed-NCBI (www.ncbi.nlm.nih.gov /m/pubmed/) and database through which the tested epitopes were extracted. The length of the amino acids present in the T-cell epitopes of HCV differs ranging from six residues to above.
The data was categorized into five groups
Group one is the data set that contained all positive
epitopes and negative epitopes
Group two is the data set that contained positive
epitopes and negative epitopes
Group three is the data set that contained positive-low and negative epitopes
Group four is the data set that contained positive-high and negative epitopes
Group five is the data set that contained positive-intermediate and negative epitopes
Training of the Tool for prediction of T-cells epitopes of HCV
The cytotoxic T lymphocytes epitopes and non-epitopes of the hepatitis C virus were run with modified support vector machine (SVM_prep). The tool was trained by dividing the epitopes and the non-epitopes into three division 0.7 (70%), 0.8 (80%) and 0.9 (90%) respectively. In each case, a model is generated and the average of the accuracy of these groups of the trained set was calculated.
Testing of the Tool for Classification of the Data into Epitopes and Non-Epitopes
In order to classify the epitopes, the amino acid sequences of structural and non-structural proteins of the hepatitis C virus were run with the modified support vector machine (SVM_prep). The epitopes were tested by using with the model generated together with the remaining 0.3 (30%), 0.2 (20%), and 0.1 (10%) respectively. The average of the accuracy of these groups of the test set was calculated.
Steps of running the support vector machine (SVM)
In order to access support vector machine (SVM), you
need to download and install the SVMlight which is freely
available at www.svm_light.tar.gz. The steps are:
1. Press shift key and right click at the same time (shift
+ right click)
2. Select “open command window”
3. Write “ SVM_prep.exe” space
4. Write name of positive dataset in “txt” format
5. Write name of negative dataset in “txt” format
6. Write name of train dataset
7. Write name of test dataset
8. Write name of model
9. Write number of division ( 0.7 for 70%, 0.8 for 80%
etc)
10. Write number of features (0 no feature, 1 there are features).
RESULTS AND DISCUSSION
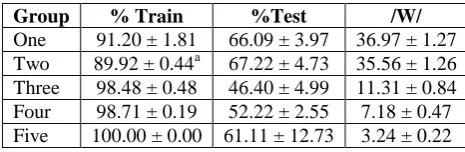
The details result of percentage accuracy of training, percentage accuracy of testing and normal weight of the vectors, with features and without features were summarized in “Table 1 and Table 2”respectively. The features that we considered in this research includes
Aliphatic Amino acid (leucine, valine, proline etc),
Aromatic Amino acid (phenylalanine, tryptophan and
tyrosine), Acidic amino acid (aspartate, glutamate),
Basic Amino acid (Lysine, arginine, histidine),
Hydroxylic Amino Acid (serine, threonine), Amidic
Amino Acid (asparagines, glutamine) as well as
methionine). However, in case of with feature, the SVM classified the epitopes based on these seven features.
Table 1: The Percentage Accuracy and Normal of Weight Vector with Features.
Group % Train %Test /W/
One 91.42 ± 2.29 67.2 ± 2.96 38.40 ± 1.70
Two 91.93 ± 0.82a 64.60 ± 4.31 37.64 ± 1.31
Three 98.41 ± 0.33 48.50 ± 1.78 11.11 ± 0.88
Four 98.74 ± 0.16 52.22 ± 2.55 07.19 ± 0.48
Five 100.00 ± 0.00 61.11 ± 12.73 03.24 ± 0.20
Values are expressed as Mean ± Standard deviation, a = significant difference (P<0.05) when group two with features is compared with group two without features, \W\= Normal of weight vector, GROUP 1= All positive
+ Negative, GROUP 2= Positive + Negative, GROUP 3= Positive-Low + Negative,GROUP 4= Positive-High + Negative, GROUP 5= Positive-Intermediate + Negative,
Table 2: The Percentage Accuracy and Normal of Weight Vector without Features.
Group % Train %Test /W/
One 91.20 ± 1.81 66.09 ± 3.97 36.97 ± 1.27
Two 89.92 ± 0.44a 67.22 ± 4.73 35.56 ± 1.26
Three 98.48 ± 0.48 46.40 ± 4.99 11.31 ± 0.84
Four 98.71 ± 0.19 52.22 ± 2.55 7.18 ± 0.47
Five 100.00 ± 0.00 61.11 ± 12.73 3.24 ± 0.22
Values are expressed as Mean ± Standard deviation, a = significant difference (P<0.05) when group two with features is compared with group two without features, \W\= Normal of weight vector, GROUP 1= All positive + Negative, GROUP 2= Positive + Negative, GROUP 3= Positive-Low + Negative, GROUP 4= Positive-High + Negative, GROUP 5= Positive-Intermediate + Negative.
The result of the average percentage accuracy and normal of weight vector with features was shown in the “Table 1”. The percentage accuracy of the trained dataset while considering the seven features above range from 48.50% to 67.20%. Whereas, the percentage accuracy of the trained dataset with features was found to be 91.42%-100%.
The result of the average percentage accuracy and normal of weight vector without features was shown in the “Table 2”. The percentage accuracy of the trained dataset without considering the seven features above range from 46.40% to 67.22%. Whereas, the percentage accuracy of the trained dataset with features was found to be 89.92%-98.71%.
The comparative analysis of the percentage accuracy of trained dataset with features and without features indicate that, there is no difference of percentage accuracy of group four and group five. There is slight variation in the case of group one and group three though the difference is not significant (P>0.05) while the difference is high in the group two.
While the comparative analysis of the percentage accuracy of trained dataset with features and without
features shown in table 1 and table 2 indicate that, there is no variation of the accuracy of dataset of group five while training the data with or without features. Whereas, there is slight differences, in the case of group one, three and four, but there is significant difference (P<0.05) of dataset of group two, when training the dataset with or without features.
The result of the percentage accuracy of the test dataset with features visualized in table 1 and table 2, indicate that, there is decrease of the accuracy from group one to group two and then from group five to group three. The group one which is the group of all positive + negative has the highest accuracy while the group three which is the group of positive-low + negative has the lowest accuracy.
This result shows interesting features as expected, the group with all positive should possess the highest accuracy while the group with positive-low should possess the lowest accuracy.
CONCLUSION
Identification of the T-cell epitopes of hepatitis C virus is invaluable which has great potential for use as the part of standard drug design performed in medical research and pharmaceutical industries. The SVMs can easily analyze and classify the epitopes. However, the predictions of the success or failure of a particular peptide sequences may be possible but so far, the result from this is not 100% guarantee.
Future Aspect
However, the future aspect of this research is to improve the accuracy of the prediction tool of T-cell epitope of a given unknown epitope.
REFERENCES
1. Heikamp K, Bajorath J. Support vector machines for
drug discovery. Expert Opin Drug Discov, 2014 Jan; 9(1): 93-104.
2. Brown M, Grundy W, Lin D, Cristianini N, Sugnet
C, Furey T, et al.Knowledge-based analysis of microarray gene expression data by using support vector machines. Proc Natl Acad Sci USA, 2000; 97: 262-7.
3. Jaakkola T, Diekhans M, Haussler D. Using the
Fisher kernel method to detect remote protein homologies. Pro Int Con Intell Syst Mol Bio., 1999: 149-58.
4. Zien A, Ratsch G, Mika S, Scholkopf B, Lenqauer
T, Muller KR. Engineering support vector machine kernels that recognize translation initiation sites. Bioinformatics, 2000 Sep; 16(9): 799-807.
5. Mukherjee S, Tamayo P, Rogers S, Rifkin R, Engle
A, Campbell C, et al. Estimating dataset size requirements for classifying DNA microarray data. J Comput Biol, 2003; 10(2): 119-42.
6. Furey TS, Cristianini N, Duffy N, Bednarski DW,
Schummer M, Haussler D. Support vector machine classification and validation of cancer tissue samples using microarray expression data. Bioinformatics, 2000 May; 102000(16): 906-14.
7. Swann RE, Cowton VM, Robinson MW, Cole SJ,
Barclay ST,Mills PR, et al. Broad anti-HCV antibody responses are associated with improved clinical disease parameters in chronic HCV infection. J Virol, 2016 Feb; pii: JVI.02669-15.
8. Jafri W, Subhan A. Hepatitis C in Pakistan:
magnitude, genotype, disease characteristics and therapeutic response. Trap Gastroenterol, 2008; 29: 194-201.
9. Idrees M, Riazuddin S. Frequency distribution of
hepatitis C virus genotypes in different geographical regions of Pakistan and their possible routes of transmission. BMC Infect Dis., 2008; 8: 69.
10. Ashfaq UA, Ansar M, Sarwar MT, Jave T, Rehman
S, Riazuddin S. Post-transcriptional inhibition of hepatitis C virus replication through small interference RNA. Virol J., 2011; 8: 112.
11. Ashfaq UA, Javed T, Rehman S, Nawaz Z,
Riazuddin S. An overview of HCV molecular
biology, replication and immune responses. Virol J., 2011; 8: 161.
12. Ciccaglione AR, Costantino C, Equestre M, Geraci
A, Rapicetta M. Mutagenesis of hepatitis C virus E1 protein affects its membrane-permiabilizing activity. J Gen Virol, 2001; 82: 2243-50.
13. Ashfaq UA, Masoud MS, Khaliq S,Nawaz Z,
Riazuddin S. Inhibition of hepatitis C virus 3a genotype entry through Glanthus Nivalis Agglutin. Virol J., 2011; 8: 248.
14. Idrees S, Ashfaq UA. Structural analysis and epitope
prediction of HCV E1 protein isolated in Pakistan: an in-silico approach. Virol J., 2013; 10: 113.
15. Himoudi N, Abraham JD, Fournillier A, Lone YC,
Op De Beeck A, Freada D, et al. Comparative vaccine studies in HLA-A2.1-transgenic mice reveal a clustered organization of epitopes presented in hepatitis C virus natural infection. J Virol, 2002 Dec; 76(24): 12735-46.
16. Wentworth PA, Sette A, Celis E, Sidney J,
Southwood S, Crimi C, et al. Identification of A2-restricted hepatitis C virus-specific cytotoxic T lymphocyte epitopes from conserved regions of the viral genome. Int Immunol, 1996 May; 8(5): 651-9.
17. Cerny A, McHutchison JG, Pasquinelli C, Brown
ME, Brothers MA, Grabscheid B, et al. Cytotoxic T lymphocyte response to hepatitis C virus-derived peptides containing the HLA A2.1 binding motif. J Cli Invest, 1995 Feb; 95(2): 521-30.
18. Guan J, Wen B, Deng Y, Zhang K, Chen H, Wu X,
et al. Effect of route of delivery on heterologous protection against HCV induced by an adenovirus vector carrying HCV structural genes. Virol J., 2011 Nov; 8: 506.
19. Lauer GM, Barnes E, Lucas M, Timm J, Ouchi K,
Kim AY, et al. High resolution analysis of cellular immune responses in resolved and persistent hepatitis C virus infection. Gastroenterology, 2004 Sep; 127(3): 924-36.
20. Scognamiglio P, Accapezzato D, Casciaro MA,
Cacciani A, Artini M, Bruno G, et al. Presence of effector CD8+ T cells in hepatitis C virus-exposed healthy seronegative donors. J Immunol, 1999 Jun; 162(11): 6681-9.
21. Battegay M, Fikes J, Di Bisceglie AM, Wentworth
PA, Sette A, Celis E, et al. Patients with chronic hepatitis C have circulating cytotoxic T cells which recognize hepatitis C virus-encoded peptides binding to HLA-A2.1 molecules. J Virol, 1995 Apr; 69(4): 2462-70.
22. Koziel MJ, Dudley D, Afdhal N, Grakoui A, Rice
CM, Choo QL, et al. HLA class I-restricted cytotoxic T lymphocytes specific for hepatitis C virus. Identification of multiple epitopes and characterization of patterns of cytokine release. J Clin Invest, 1995 Nov; 96(5): 2311-21.
23. Wei SH, Yin W, An QX, Lei YF, Hu XB, Yang J, et
multi-epitope antigen. Arch Virol, 2008; 153(6): 1021-9.
24. Koziel MJ, Dudley D, Afdhal N, Choo QL,
Houghton M, Ralston R, Walker BD. Hepatitis C virus (HCV)-specific cytotoxic T lymphocytes recognize epitopes in the core and envelope proteins of HCV. J Virol, 1993 Dec; 67(12): 7522-32.
25. Wong DK, Dudley DD, Dohrenwend PB, Lauer
GM, Chung RT, Thomas DL, Walker BD. Detection of diverse hepatitis C virus (HCV)-specific cytotoxic T lymphocytes in peripheral blood of infected persons by screening for responses to all translated proteins of HCV. J Virol, 2001 Feb; 75(3): 1229-35.
26. Wong DK, Dudley DD, Afdhal NH, Dienstag J,
Rice CM, Wang L, et al. Liver-derived CTL in hepatitis C virus infection: breadth and specificity of responses in a cohort of persons with chronic infection. J Immunol, 1998 Feb; 160(3): 1479-88.
27. Kurokohchi K, Akatsuka T, Pendleton CD,
Takamizawa A, Nishioka M, Battegay M, et al. Use of recombinant protein to identify a motif-negative human cytotoxic T-cell epitope presented by HLA-A2 in the hepatitis C virus NS3 region. J Virol, 1996; 70(1): 232-40.
28. Urbani S, Uqqeri J, Matsuura Y, Miyamura T, Penna
A, Boni C, Ferrari C. Identification of
immunodominant hepatitis C virus (HCV)-specific cytotoxic T-cell epitopes by stimulation with
endogenously synthesized HCV antigens.
Hepatology, 2001 Jun; 33(6): 1533-43.
29. Kurokohchi K, Masaki T, Arima K, Miyauchi Y,
Funaki T, Yoneyama H, et al. negetive
CD28-positive cytotoxic T lymphocytes mediate
hepatocellular damage in hepatitis C virus infection. J Clin Immunol, 2003 Nov; 23(6): 518-27.
30. Chanq KM, Gruener NH, Southwood S, Sidney J,
Pape GR, Chisari FV, Sette A. Identification of HLA-A3 and –B7-restricted CTL response to hepatitis C virus in patients with acute and chronic hepatitis C . J Immunol, 1999 Jan; 162(2): 1156-64.
31. Shin EC, Park SH, Nascimbeni M, Major M,
Caqqiari L, de Re V, et al. The frequency of CD127 (+) hepatitis C virus (HCV)-specific T cells but not the expression of exhaustion markers predicts the outcome of acute HCV infection. J Virol, 2013 April; 87(8): 4772-7.
32. Mizukoshi E, Nascimbeni M, Blaustein JB, Mihalik
K, Rice CM, Lianq TJ, et al. Molecular and immunological significance of chimpanzee major histocompatibility complex haplotypes for hepatitis C virus immune response and vaccination studies. J Virol, 2002 Jun; 76(12): 6093-103.
33. Kelly C, Swadling L, Brown A, Capone S, Folgori
A, Salio M, et al. Cross-reactivity of hepatitis C
virus specific vaccine-induced T cells at