RESEARCH ARTICLE
Klf5
maintains the balance of primitive endoderm versus epiblast
specification during mouse embryonic development by
suppression of
Fgf4
Takuya Azami1,2, Tsuyoshi Waku3, Ken Matsumoto1, Hyojung Jeon2, Masafumi Muratani4, Akihiro Kawashima2, Jun Yanagisawa5,6, Ichiro Manabe7, Ryozo Nagai8, Tilo Kunath9,
Tomonori Nakamura10,11, Kazuki Kurimoto10,11, Mitinori Saitou10,11,12,13, Satoru Takahashi2,6,14and Masatsugu Ema1,15,*
ABSTRACT
The inner cell mass of the mouse blastocyst gives rise to the pluripotent epiblast (EPI), which forms the embryo proper, and the primitive endoderm (PrE), which forms extra-embryonic yolk sac tissues. All inner cells coexpress lineage markers such asNanogand Gata6at embryonic day (E) 3.25, and the EPI and PrE precursor cells eventually segregate to exclusively express Nanog and Gata6, respectively. Fibroblast growth factor (FGF)–extracellular signal-regulated kinase (ERK) signalling is involved in segregation of the EPI and PrE lineages; however, the mechanism involved in Fgf4 regulation is poorly understood. Here, we identified Klf5 as an upstream repressor ofFgf4.Fgf4was markedly upregulated inKlf5 knockout (KO) embryos at E3.0, and was downregulated in embryos overexpressing Klf5. Furthermore, Klf5 KO and overexpressing blastocysts showed skewed lineage specification phenotypes, similar to FGF4-treated preimplantation embryos and Fgf4 KO embryos, respectively. Inhibitors of the FGF receptor (Fgfr) and ERK pathways reversed the skewed lineage specification ofKlf5KO blastocysts. These data demonstrate thatKlf5suppresses
Fgf4-Fgfr-ERK signalling, thus preventing precocious activation of the PrE specification programme.
KEY WORDS: Inner cell mass, Primitive endoderm, Epiblast,Fgf4, Klf5, Mouse
INTRODUCTION
Mammalian preimplantation embryo development segregates into three fundamental cell lineages. The first lineage segregation event separates an epithelial cell layer called the trophectoderm (TE) on the surface of the embryo, which gives rise to trophoblast tissues of the placenta, and the inner cell mass (ICM), which gives rise to the embryo proper and extra-embryonic mesoderm. The second lineage segregation event further differentiates the ICM into epiblast (EPI) cells and the primitive endoderm (PrE). EPI cells generate most of the embryo proper and are a source of pluripotent embryonic stem cells (ESCs), whereas the PrE generates visceral and parietal endoderm tissues, and these become the visceral and parietal yolk sacs (Rossant and Tam, 2009). After compaction, inner cells generated in the first wave of cell division (8- to 16-cell stage) mainly contribute to EPI cells, whereas inner cells generated in the second wave (16- to 32-cell stage) are biased towards PrE cells (Morris et al., 2010). However, a previous study did not observe such predetermination in EPI and PrE specification (Yamanaka et al., 2010).
Single-cell analysis revealed that inner cells at embryonic day (E) 3.25 randomly coexpress EPI and PrE markers and eventually acquire either an EPI or a PrE identity (Guo et al., 2010; Kurimoto et al., 2006; Ohnishi et al., 2014). The mechanism involved in the emergence and specification of EPI and PrE precursor cells is not fully understood (Bedzhov and Zernicka-Goetz, 2015; Hermitte and Chazaud, 2014). The cell fate of EPI and PrE precursors is still plastic at E3.75 and is fully committed to EPI and PrE cells at
∼E4.0-4.25 (Grabarek et al., 2012; Nichols et al., 2009; Yamanaka et al., 2010).
Nanogand Gata6mRNAs are detectable as early as the 2-cell stage (Guo et al., 2010), and both Nanog and Gata6 proteins are coexpressed in all inner cells at E3.25 (∼32 cells) (Dietrich and Hiiragi, 2007; Plusa et al., 2008). Variability in the initialNanog expression level shows no correlation with that of Gata6 in individual inner cells at E3.25 (Ohnishi et al., 2014). As embryos develop, the salt-and-pepper distributions ofNanogandGata6are evident in ICM cells until E3.5-4.0 (Chazaud et al., 2006; Plusa et al., 2008). The establishment of this salt-and-pepper distribution of Nanog and Gata6 is poorly understood; however, fibroblast growth factor (FGF)–extracellular signal-regulated kinase (ERK)
Received 22 February 2017; Accepted 25 August 2017
1Department of Stem Cells and Human Disease Models, Research Center for
Animal Life Science, Shiga University of Medical Science, Seta, Tsukinowa-cho, Otsu, Shiga 520-2192, Japan.2Department of Anatomy and Embryology, Faculty of
Medicine, University of Tsukuba, 1-1-1 Tennoudai, Tsukuba, Ibaraki 305-8575, Japan.3Graduate School of Pharmaceutical Sciences, The University of Tokyo,
Hongo, Bunkyo-ku, Tokyo 113-0033, Japan.4Department of Genome Biology,
Faculty of Medicine, University of Tsukuba, 1-1-1 Tennodai, Tsukuba, Ibaraki 305-8575, Japan.5Graduate School of Life and Environmental Sciences, University of
Tsukuba, 1-1-1 Tennodai, Tsukuba, Ibaraki 305-8577, Japan.6Center for Tsukuba
Advanced Research Alliance, University of Tsukuba, 1-1-1 Tennodai, Tsukuba, Ibaraki 305-8577, Japan.7Department of Cardiovascular Medicine, The University
of Tokyo Graduate School of Medicine, Bunkyo, Tokyo 113-8655, Japan.8Jichi
Medical University, 3311-1 Yakushiji, Shimotsuke, Tochigi 329-0498, Japan.9MRC
Centre for Regenerative Medicine, School of Biological Sciences, University of Edinburgh, 5 Little France Drive, Edinburgh EH16 4UU, UK.10Department of
Anatomy and Cell Biology, Graduate School of Medicine, Kyoto University, Yoshida-Konoe-cho, Sakyo-ku, Kyoto 606-8501, Japan.11JST, ERATO,
Yoshida-Konoe-cho, Sakyo-ku, Kyoto 606-8501, Japan.12Department of Reprogramming
Science, Center for iPS Cell Research and Application, Kyoto University, 53 Kawahara-cho, Shogoin Yoshida, Sakyo-ku, Kyoto 606-8507, Japan.13Institute for
Integrated Cell-Material Sciences, Kyoto University, Yoshida-Ushinomiya-cho, Sakyo-ku, Kyoto 606-8501, Japan.14International Institute for Integrative Sleep
Medicine, Life Science Center, and Laboratory Animal Resource Center, University of Tsukuba, 1-1-1 Tennodai, Tsukuba, Ibaraki 305-8577, Japan.15PRESTO, Japan
Science and Technology Agency, 4-1-8 Honcho Kawaguchi, Saitama 332-0012, Japan.
*Author for correspondence ([email protected])
J.Y., 0000-0002-7196-7513; I.M., 0000-0001-9481-6673; T.K., 0000-0002-8805-7356; M.E., 0000-0003-0645-6183
DEVEL
O
signalling is postulated to play key roles (Chazaud et al., 2006; Kang et al., 2013; Krawchuk et al., 2013; Nichols et al., 2009; Ohnishi et al., 2014; Yamanaka et al., 2010). Fgf4-Fgfr-ERK signalling determines the balance of the EPI and PrE cell lineages: overactivation of FGF signalling caused by exogenous FGF4 converts all ICM cells to PrE cells (Yamanaka et al., 2010), whereas all ICM cells acquire EPI identity when FGF signalling is blocked by small chemical inhibitors of Fgfr and ERK (Nichols et al., 2009), by gene knockout (KO) ofFgf4(Kang et al., 2013; Krawchuk et al., 2013), and by KO of the expression of the adapter moleculeGrb2 (Chazaud et al., 2006).Fgf4KO embryos show normalNanogand Gata6expression levels at E3.25; thus, the initial coexpression of Nanog and Gata6 is independent of Fgf4 (Kang et al., 2013; Krawchuk et al., 2013; Ohnishi et al., 2014). Subsequently, the segregation of EPI and PrE precursor cells is believed to be mediated by reciprocal repression between Nanog and Gata6 (Singh et al., 2007). In agreement with this model, the loss of Gata6 results in a complete shift into the EPI lineage, while there is no effect on the Nanog expression level at E3.0-3.25; thus, the initial expression of Nanog is independent of Gata6 at E3.0-3.25 (Bessonnard et al., 2014; Schrode et al., 2014). Importantly, single-cell analysis showed that bimodalFgf4expression precedes asymmetric Nanog and Gata6 expression and is the first sign of the segregation of the EPI and PrE lineages (Guo et al., 2010; Ohnishi et al., 2014). Currently, what regulates Fgf4 at this developmental stage is unknown (Artus and Chazaud, 2014; Chazaud and Yamanaka, 2016).
Klf5, a member of the Krüppel-like factor (Klf ) family of transcription factors, functions in the maintenance of pluripotency and in somatic cell reprogramming (Takahashi and Yamanaka, 2006). Klf5 marks a naïve state of human pluripotent stem cells (Chan et al., 2013; Theunissen et al., 2014). Target gene inactivation ofKlf5 causes failure of TE and ICM development (Ema et al., 2008; Lin et al., 2010), but the molecular mechanism underlying Klf5-regulated ICM development is not well understood.
Here, we show that the inner cells ofKlf5KO embryos adopt a PrE lineage fate at the expense of EPI cells, while Klf5 -overexpressing (OE) embryos show incomplete lineage segregation as indicated by the persistence of Nanog+/Gata6+
double-positive cells. We show thatFgf4expression is upregulated inKlf5KO embryos at E3.0, whereasFgf4is repressed inKlf5OE blastocysts. Importantly, single-cell analysis clearly demonstrates thatFgf4is derepressed in a subset ofFgf4-high inner cells ofKlf5 KO embryos. Chromatin immunoprecipitation (ChIP) assays indicate that theFgf4locus is occupied by Klf5, suggesting direct regulation ofFgf4by Klf5. In terms of the emergence of Nanog+
pluripotent EPI cells, the phenotypes ofKlf5KO embryos can be reversed by either Fgfr or ERK inhibition. Taken together, these results provide new insights into the interplay betweenKlf5and the Fgf4-Fgfr-ERK pathway crucial for the proper lineage segregation.
RESULTS
Skewed EPI and PrE lineage specification inKlf5KO and OE blastocysts
Although Klf5 is indispensable for blastocyst development, the mechanistic functions of Klf5 in ICM development and early lineage segregation remain elusive (Ema et al., 2008; Lin et al., 2010). In a previous study, theKlf5-lacZallele (Ema et al., 2008) was generated by inserting alacZcassette into the second exon of Klf5, leaving the rest of theKlf5locus with the potential to generate a C-terminally truncated protein of ∼164 amino acids in length (Fig. S1A). To delete almost the entire open reading frame ofKlf5,
we generated a new KO mouse forKlf5that removes the two major coding exons (designatedKlf5Δ2nd3rd exon) (Fig. S1B). Similar to Klf5-lacZmice (Fig. S1A) (Ema et al., 2008), no homozygous pups were obtained from heterozygous intercrosses of theKlf5Δ2nd3rd exon mice, and homozygous Klf5Δ2nd3rd exon/Δ2nd3rd exonembryos
showed implantation defects (Fig. S1C). WhenKlf5KO morulae (Klf5lacZ/lacZorKlf5Δ2nd3rd exon/Δ2nd3rd exon) at E2.5 were stained with
antibodies against lineage markers such as Oct3/4 (Pou5f1) and Cdx2, both types ofKlf5KO embryos showed decreased levels of Cdx2 and normal levels of Oct3/4 protein expression (Fig. S1D,E). Hereafter, theKlf5Δ2nd3rd exon allele was used as the null allele for our study.
To obtain insight into the role ofKlf5in early embryogenesis, we established a new ESC line with Cre-mediated overexpression of the FLAG/HA-Klf5 cassette (Fig. S1F). We used the ESC line, which expresses GFP prior to Cre-mediated excision, to generate the conditionalKlf5OE mice (Fig. S1G). Upon crossing to the Ayu1-Cre driver line, we confirmed that Klf5 protein is overexpressed 1.5-fold in Klf5 OE blastocysts compared with wild type (WT) (Fig. S1H).
First, we collected embryos carefully timed every 6 h from E3.25 onwards and found thatKlf5KO embryos had fewer cells than their WT counterparts (Fig. S1I). The total cell number per Klf5 KO embryo never exceeded 64 until E4.25 (Fig. S1I; data not shown). Given that bromodeoxyuridine (BrdU) incorporation was severely affected, it is likely that cell cycle progression had been disturbed (Fig. S1J,K). Co-staining embryos from E3.25 to E3.5 for BrdU incorporation and terminal deoxynucleotidyl transferase-mediated dUTP nick-end labelling (TUNEL) showed that the cells defective in BrdU incorporation were TUNEL+, suggesting that defective cell
cycle progression was promoting apoptosis (Fig. S1L).
Examination of Nanog and Gata6 expression levels inKlf5KO embryos revealed that the initial Nanog and Gata6 expression at E3.25 was, overall, similar to that of WT embryos (Fig. 1A). Analyses ofKlf5 KO blastocysts at E3.5 and E3.75 showed that most, if not all, ICM cells were Gata6+ and that few cells were
Nanog+(Fig. 1A,C, Fig. S2A,C). Consistent with this result, Nanog
protein expression levels decreased in Klf5 KO embryos during development from E3.25 to E4.0, whereas Gata6 protein levels increased (Fig. 1B). Since it was reported that Nanog+/Gata6+
double-positive (DP) common precursors differentiate progressively into a Nanog+/Gata6− (Nanog+) EPI or Nanog−/
Gata6+(Gata6+) PrE fate in an asynchronous manner (Saiz et al.,
2016), we evaluated the percentage of DP cells, Nanog+cells and
Gata6+cells from E3.25 to E4.0. The percentage of DP cells inKlf5
KO embryos decreased rapidly and, in turn, the percentage of Gata6+cells increased, indicating that bipotential DP cells inKlf5
KO embryos prefer to differentiate into Gata6+PrE cells (Fig. 1C).
At the E4.0 late blastocyst stage, most cells inKlf5 KO embryos acquired the Gata6+PrE fate (Fig. 1A,C).
Our finding that only Gata6-expressing cells inKlf5KO embryos remain at E4.0 could be the consequence of apoptosis of Nanog+
EPI cells rather than of more cells differentiating into PrE. To gain insight into the role of apoptosis in the EPI lineage, we analysed the number of TUNEL+cells inKlf5KO and WT embryos at E3.5. We
found no significant changes in the percentage of Nanog+, Gata6+,
DP, or double-negative (DN) cells undergoing apoptosis between WT andKlf5 KO embryos (Fig. S1M-O). This indicated that the increase in the percentage of Gata6+cells was not caused by the
death of any specific cell lineage, including EPI cells. Because the percentage of DP cells inKlf5KO embryos was decreased (Fig. 1C), DP cells were likely to have differentiated into PrE. Because the
DEVEL
O
Klf5KO embryos showed a cell proliferation defect (Fig. S1I) we categorised embryos by similar total cell numbers (<32 or 32-64) from various days of development and reached the same conclusion (Fig. S2B-D).
When we investigated Nanog and Gata6 expression inKlf5OE embryos at E3.25,Klf5OE blastocysts showed overall coexpression of Nanog and Gata6 (Fig. 1A). The numbers of DP cells per embryo at E3.5 to E4.0 were significantly increased inKlf5 OE embryos (Fig. 1C, Fig. S2C,D). Whereas there were Gata6+endoderm layers
and Nanog+ EPI cells in WT blastocysts at E4.5, there were still
significant numbers of DP cells centrally located towards presumably uncommitted cells inKlf5OE blastocysts at E4.5 (Fig. S2A,A′).
Accelerated PrE lineage specification inKlf5KO embryos Specification of the PrE lineage involves Gata6, followed by sequential activation of Pdgfra, Sox17, Gata4 and Sox7 (Artus et al., 2010, 2011; Kang et al., 2013; Plusa et al., 2008). Sox17 is activated between the 32-cell and 64-cell stages (Artus et al., 2011; Morris et al., 2010; Niakan et al., 2010); Gata4 expression marks the onset of the mutual exclusion of Gata6 and Nanog and is activated at the 64-cell stage (Artus et al., 2011; Grabarek et al., 2012). Because we observed a reduction in the percentage of Nanog+ cells and an
increase in Gata6+cells inKlf5KO embryos at E3.75, we tested
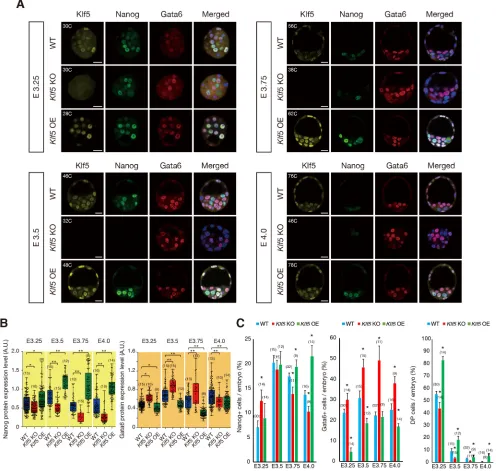
[image:3.612.59.555.61.532.2]whether inner cells at E3.0 already exhibit signs of accelerated PrE lineage specification. Immunohistochemistry did not show any Fig. 1. Skewed EPI and PrE lineage specification inKlf5KO and OE blastocysts.(A) Expression levels of Nanog and Gata6 in WT,Klf5KO andKlf5 OE mouse embryos from E3.25-4.0. Confocal microscopy transverse sections are shown. Note that Nanog expression was reduced inKlf5KO blastocysts at E3.25 and was dramatically reduced after E3.5. Gata6 expression was induced at E3.25-E4.0. C, cell number. Scale bars: 20 µm. (B) Tukey box plots of Nanog and Gata6 protein expression levels. Embryo numbers are shown in parentheses. A.U., arbitrary unit. The central mark is the median, the edges of the box are the 25th and 75th percentiles, and the whiskers extend to 1.5× the interquartile range. (C) Percentage of Nanog+(Nanog+/Gata6−), Gata6+
(Nanog−/Gata6+) and DP cells per embryo. *P<0.01, **P<0.001, versus WT (Mann–WhitneyU-test). Embryo numbers are shown in parentheses.
DEVEL
O
detectable Pdgfra or Sox17 protein expression inKlf5KO morulae at E3.0 (data not shown; Fig. S3A). However, at E3.25, immunohistochemistry showed strong Pdgfra expression in most of the inner cells of Klf5 KO embryos but not WT embryos (Fig. 2A). Quantitation of Pdgfra+cells indicated that over 80% of
the inner cells ofKlf5KO embryos were Pdgfra+, whereas fewer
than 20% of the inner cells of WT embryos were Pdgfra+(Fig. 2B).
It is of note that a small increase in Pdgfra+cells was observed in the
outer cells ofKlf5KO embryos (Fig. 2B). Taken together, the data revealed that the inner cells ofKlf5KO embryos exhibit accelerated PrE lineage specification as early as E3.25 (Fig. 2C).
We also found an increase in the percentage of Sox17+cells in Klf5 KO blastocysts at E3.5 (Fig. S3B-D), which was consistent with a previous report (Lin et al., 2010). Furthermore, we found an increase in the numbers of Gata4+cells inKlf5KO blastocysts at
E3.75, which was in sharp contrast with the small number of cells found inKlf5OE embryos (Fig. 2D,E). Gata4 protein expression levels were increased in Klf5KO embryos and decreased in Klf5 OE embryos (Fig. 2F). Collectively, these data indicated thatKlf5 KO embryos show an accelerated PrE lineage specification in the ICM.
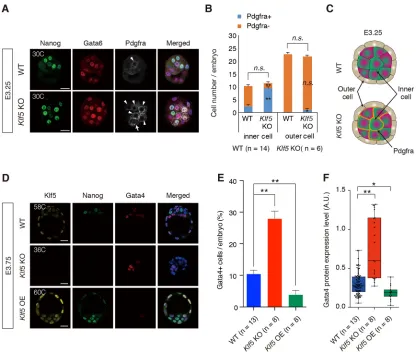
[image:4.612.98.516.55.407.2]During maturation of EPI cells at E4.25-4.5, it has been demonstrated that downregulation of Nanog expression is a hallmark of the naïve-to-primed transition of EPI cells (Kang et al., 2017; Saiz et al., 2016; Smith, 2017). Elevated Nanog expression inKlf5OE embryos from E3.25 to E4.25 suggests that these cells might remain in a naïve state and fail to differentiate into mature EPI cells. To examine the consequence of ubiquitous overexpression of Klf5, Klf5 OE embryos at E5.5 (egg cylinder stage) were dissected and subjected to immunohistochemistry. In WT embryos, Klf5 protein was expressed in extra-embryonic ectoderm cells but not in EPI cells; however,Klf5OE embryos still expressed Klf5 protein in all cell lineages, including EPI cells (Fig. S4). Thus, the elevated Nanog expression caused byKlf5OE did not block differentiation into EPI cells. Yamanaka and colleagues indicated that even thoughFgf4heterozygous embryos exhibit a reduction in the number of PrE cells, the embryos eventually develop normally (Krawchuk et al., 2013). Thus, although lower activity of the Fgf4-Fgfr-ERK pathway affects PrE maturation it is restored during development. We presume that the PrE maturation of Klf5 OE embryos is restored, as seen inFgf4 heterozygous embryos.Klf5OE embryos developed normally until Fig. 2. Accelerated PrE lineage specification inKlf5KO embryos.(A) Upregulation of Pdgfra in the inner cells ofKlf5KO embryos at E3.25. Note that the inner cells of theKlf5KO embryos were DP cells that strongly express Pdgfra. Arrowheads and arrow indicate inner cells and outer cells, respectively. Confocal microscopy transverse sections at E3.25 are shown. C, cell number. (B) Absolute number of Pdgfra+and Pdgfra−cells in inner or outer cells. (C) Illustration of
WT andKlf5KO embryos at E3.25. More than 80% of inner cells inKlf5KO embryos strongly expressed Pdgfra (indicated by the orange outline of the cell membrane), but not in WT embryos, indicating accelerated PrE specification of the inner cells. (D) Expression of Nanog and Gata4 in WT andKlf5KO blastocysts from E3.75. Gata4 expression levels were dramatically upregulated inKlf5KO blastocysts. Confocal microscopy transverse sections are shown. (E) Percentage of Gata4+cells per embryo. (F) Tukey box plots of Gata4 protein expression levels. Embryo numbers are shown in parentheses. A.U., arbitrary unit. *P<0.01, **P<0.001 (Fig. 2B: Fisher’s exact test; Fig. 2E,F: Mann–WhitneyU-test); n.s., not significant. Scale bars: 20 µm.
DEVEL
O
E8.0 but then died at E11.5 for unknown reasons, whileKlf5KO embryos showed reduced Cdx2 expression and failed to promote blastocoel expansion, indicating a defect in TE development. Taken together, these results indicated that loss or overexpression ofKlf5 results in skewed cell fate specification in the EPI/PrE lineages during preimplantation development.
Overactivation of the Fgf4-Fgfr-ERK pathway inKlf5KO embryos
To elucidate the molecular mechanism involved in the accelerated PrE lineage specification ofKlf5KO embryos, microarray analyses were performed using amplified cDNAs from WT embryos andKlf5
[image:5.612.112.500.218.646.2]KO embryos at E3.0 (Fig. S5A), which at this stage showed no apparent defects and had normal expression levels of Oct3/4, Nanog,Sox2andCdx2mRNAs (Fig. S5B). Bioinformatic analysis indicated thatFgf4expression was upregulated inKlf5KO embryos, whereas Spry4, a negative regulator of FGF-induced ERK activation, was downregulated (Fig. 3A). Pdgfra and Sox17, markers for the PrE lineage, were upregulated in Klf5 KO embryos (Fig. 3A). In agreement with these observations, quantitative reverse-transcription PCR (RT-qPCR) analysis confirmed that Fgf4, Pdgfra and Sox17 were significantly upregulated inKlf5KO embryos at E3.0 (Fig. 3B). Quantification of Sox17 immunostaining inKlf5KO embryos showed increased
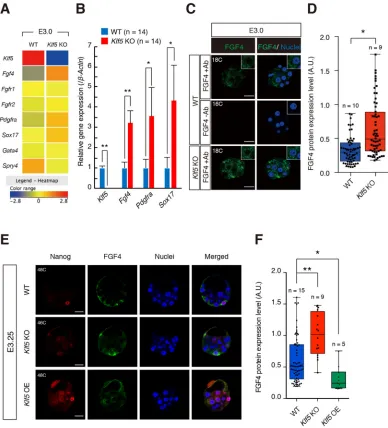
Fig. 3.Klf5is required for the repression ofFgf4expression in morulae at E3.0.(A) Heat map summarizing expression data for representative genes involved in Fgf4-ERK signalling and PrE specification. Colour intensity represents the mean-centered log2 expression; deeper red is associated with greater relative gene expression, and deeper blue is associated with decreased relative gene expression. (B) Average of relative gene expression inKlf5KO embryos compared with WT embryos at E3.0.β-actin was used for the normalisation of mRNA expression. *P<0.05, **P<0.01 (Mann–WhitneyU-test). (C) Increased expression levels of FGF4 protein inKlf5KO morulae at E3.0. Confocal transverse sections are shown. Insets are high-magnification images of FGF4+cells. Data are also shown for a negative control experiment on WT morulae without anti-FGF4 antibody (−Ab). C, cell number. (D) Tukey box plots showing FGF4 protein expression levels in FGF4+cells of WT andKlf5KO morulae at E3.0. *P<0.01 (Mann–WhitneyU-test). (E) FGF4 protein expression levels in FGF4+cells of WT, Klf5KO andKlf5OE blastocysts at E3.25. Confocal transverse sections are shown. (F) Tukey box plots showing FGF4 protein expression levels in FGF4+cells of WT,Klf5KO andKlf5OE embryos at E3.25. *P<0.05, **P<0.01 (Mann–WhitneyU-test). A.U., arbitrary unit. Scale bars: 20 µm.
DEVEL
O
numbers of Sox17+cells per embryo, as well as increased staining for
Sox17 on a per-cell level at E3.5 (Fig. S3C,D). Therefore, the upregulation of PrE genes in the microarray analysis appears to reflect a combination of increased PrE cells per embryo and, in some cases such asSox17, an increased level of PrE gene expression per cell.
To examine FGF4 protein expression in Klf5KO embryos, we validated an anti-FGF4 antibody by staining mouseFgf4KO and WT ESCs and found that it could exclusively recognise endogenous FGF4 protein expressed in these cells (Fig. S5C). We further validated the anti-FGF4 antibody by staining the Nanog+EPI cells
of WT blastocysts at E3.75 (Fig. S5D) and found that the staining pattern was consistent with a previous report by Frankenberg et al. (2011). Immunohistochemical analysis with this antibody confirmed that FGF4 was abundantly expressed in Klf5 KO embryos at E3.0 and E3.25 (Fig. 3C-F). By contrast, FGF4 expression was significantly reduced inKlf5OE embryos at E3.25, indicating that Klf5 suppresses Fgf4 (Fig. 3E,F). Since Fgf4 encodes a secreted protein, it is difficult to identifyFgf4-expressing cells. To resolve this issue, we performed single-cell RT-qPCR analysis with amplified cDNA prepared from individual blastomeres of inner cells of WT,Klf5KO andKlf5OE embryos at E3.25 using the single-cell mRNA 3-prime end sequencing (SC3-seq) method (Nakamura et al., 2015) (Fig. 4A). There were two populations: Fgf4-high inner cells and Fgf4-low/negative inner cells. Given thatPdgfra,Fgfr2andSox17are expressed inFgf4 -low/negative inner cells but not in Fgf4-high inner cells, these populations might represent PrE and EPI cells, respectively (Fig. 4A). There was no significant difference in the expression pattern of major lineage markers, such asNanog,Gata6,Oct3/4and Sox2, between WT, Klf5 KO and Klf5 OE embryos (Fig. 4A). Importantly, the proportion ofFgf4-high inner cells toFgf4-low/ negative inner cells was significantly increased inKlf5KO embryos at E3.25 (Fig. 4B,C). Interestingly,Fgf4mRNA was significantly upregulated in Fgf4-high inner cells of Klf5 KO embryos but downregulated in Fgf4-high inner cells of Klf5 OE embryos, as compared with those of WT embryos (Fig. 4B,D). These results clearly demonstrated thatKlf5suppressesFgf4inFgf4-high inner cells at E3.0-3.25.
To investigate whetherKlf5directly regulatesFgf4, we surveyed the genomic binding sites ofKlf5by examining public ChIP-seq data and found that three candidate regions in Fgf4 loci were occupied by Klf5 in mouse ESCs (Fig. 4E). To verify this result, we established ESC lines that overexpressed epitope-tagged Klf5 and confirmed that the tagged protein binds to the three regions ofFgf4 (Fig. 4F) and to the promoter and enhancer regions ofNanog(Jeon et al., 2016). These data suggest that Klf5 repressesFgf4through direct regulation. Although inner cells at E3.25 express Fgfr2 homogeneously,Fgf4was observed to be expressed at two distinct levels, namely high and low, in populations of cells (Guo et al., 2010; Kurimoto et al., 2006; Ohnishi et al., 2014). However, the regulatory mechanism ofFgf4at early stages, such as in the morula, is unknown (Chazaud and Yamanaka, 2016). To the best of our knowledge, we are the first to identifyKlf5as a crucial regulator of Fgf4at E3.0-3.25.
Of note, althoughcis-regulatory regions in theFgf4promoter and enhancers are occupied by Klf5 (Fig. 4E,F), a lack of Klf5 expression did not significantly alter Fgf4 expression in mouse ESCs (Fig. S5E). This finding suggests a minor role forKlf5in the transcription of Fgf4 in mouse ESCs, in contrast to its strongly suppressive role onFgf4at E3.0 or E3.25. Previous work showed that Klf5 is a context-dependent transcription factor and, depending on the co-factor or nuclear environment, behaves as a transcriptional
repressor or activator on the same set of genes (Oishi et al., 2008). Therefore, the different outcomes ofFgf4transcription promoted by the absence ofKlf5might result in a different cell type, i.e. inner cells at E3.0-3.25 versus mouse ESCs (equivalent to EPI cells at E4.25) (Boroviak et al., 2014).
Fgfr or MEK inhibitors reverse the skewed lineage specification ofKlf5KO blastocysts
Our data indicate thatKlf5 KO blastocysts show cell proliferation defects and accelerated PrE specification (Fig. S1I, Figs 1 and 2), yet it is not clear whether the overactivation of Fgf4-Fgfr-ERK signalling is responsible for the cell proliferation defects and accelerated PrE lineage specification inKlf5KO embryos. In fact, Lin et al. (2010) reported no difference in the phosphorylated ERK ( pERK) signal between WT andKlf5KO blastocysts. However, it is of note that careful and extensive immunohistochemical analyses showed that a strong background signal hampers the detection of pERK in preimplantation embryos (Frankenberg et al., 2011), whereas pERK signals can be observed reproducibly in whole embryos after E5.5 (Corson et al., 2003).
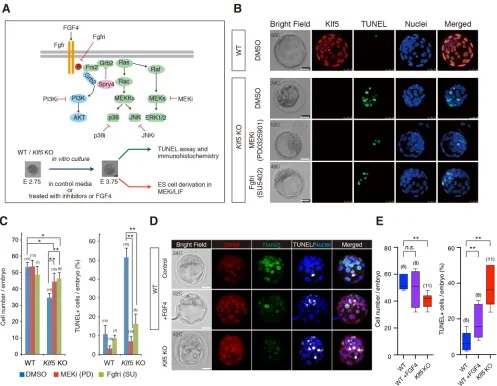
To examine whether Fgf4-Fgfr-ERK signalling is responsible for the phenotype ofKlf5KO blastocysts, we used chemical inhibitors to block the kinase activities of Fgfr1/2 (SU5402) and MEK (PD0325901) (Fig. 5A). Morulae at E2.75 were collected and cultured for 24 h in the presence or absence of these inhibitors, and we found that Klf5 KO embryos treated with either SU5402 or PD0325901 showed marked phenotypic rescue in terms of a normal morphology with an expanded blastocoel, indistinguishable from WT blastocysts (Fig. 5B). The number of cells per embryo was also increased but still significantly different from that of WT embryos, suggesting thatKlf5regulates cell proliferation in part through an Fgf4-Fgfr-ERK-independent mechanism (Fig. 5C). The number of TUNEL+cells was reduced dramatically in the inhibitor-treatedKlf5
KO embryos and was similar to that of WT embryos (Fig. 5C). Notably, inhibitors of the JNK and p38 MAPK (Mapk14) pathways did not significantly rescue the cell cycle defects of Klf5 KO blastocysts (Fig. S6), indicating that JNK and p38 MAPK are not involved in this process.
We also attempted to test whether excess FGF4 activity is sufficient to cause defective cell proliferation in WT embryos and found that culturing in the presence of FGF4 slightly increased the number of TUNEL+cells but did not significantly change total cell
number (Fig. 5D,E). WhenKlf5OE embryos were cultured in the presence of saturated levels of FGF4 (1μg/ml) from E2.5 to E3.75 (Fig. S7A), this did not change total cell number (Fig. S7B-D); however, Gata6 protein expression was significantly upregulated in FGF4-stimulatedKlf5OE embryos (Fig. S7E).
To investigate whether the precocious activation of Fgf4-Fgfr-ERK signalling was responsible for the altered lineage specification ofKlf5 KO blastocysts, WT andKlf5 KO morulae at E2.5 were collected and cultured for 24 or 48 h in the presence or absence of PD0325901 and were then subjected to immunohistochemistry (Fig. 6A).Klf5KO blastocysts culturedin vitrofor 24 h from E2.5 showed reduced Nanog and increased Gata6 expression levels, as did the Klf5 KO blastocysts at E3.5 (Fig. 6B,C). MEK inhibitor treatment dramatically reversed the alterations in Nanog and Gata6 expression levels (Fig. 6B,C). WhenKlf5KO morulae were treated with PD0325901 from E2.5 for 24 h, most of the ICM cells were Nanog+EPI-biased cells (Fig. 6B,C). By contrast, whenKlf5KO
morulae were treated with vehicle alone for 24 h from E2.5, most of the ICM cells were Gata6+PrE cells. Importantly, the percentage of
Nanog+cells among the ICM cells ofKlf5KO blastocysts cultured
DEVEL
O
Fig. 4.See next page for legend.
DEVEL
O
in the presence of PD0325901 was increased compared with WT, but was still less than that of PD0325901-treated WT embryos (Fig. 6C). WhenKlf5KO morulae were treated with PD0325901 from E2.5 for 48 h (corresponding to E4.5), all the cells in the ICM were Nanog+EPI cells (Fig. 6B′).
Because our previous results indicated that ESC lines could not be established from Klf5 KO blastocysts and that Klf5 was indispensable for ESC derivation from the ICM (Ema et al., 2008), we attempted to derive ESC lines from PD0325901-treated Klf5 KO blastocysts. Sixty ESC lines were established and genotyped. Seven Klf5 KO ESC lines were obtained (data not shown), demonstrating that treatment with this MEK inhibitor rescued the emergence of pluripotent EPI cells in Klf5 KO blastocysts. By contrast, treatment with the MEK or Fgfr inhibitors did not affect the reduced expression of Cdx2 (Fig. S8). This suggested that the dysregulation of Cdx2 in Klf5 KO blastocysts was not caused by increased signalling through the Fgf4-Fgfr-ERK pathway but was nonetheless controlled byKlf5.
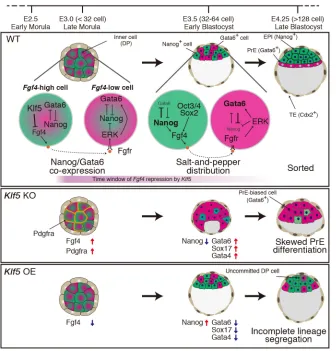
Taken together, our studies showed that the loss ofKlf5results in the induction of Fgf4 in morula at E3.0, followed by the rapid upregulation of Pdgfra in the inner cells at E3.25 and a decrease in Nanog+cells and DP cells at E3.5, which ultimately led to
expressing cells only. This skewed EPI/PrE phenotype with Gata6-only ICM cells was reversed by MEK inhibitors. However, overexpression of Klf5 resulted in the reduction of Fgf4 in blastocysts at E3.5 and an increase in Nanog+cells and DP cells
at E3.5 or later, which ultimately led to the presence of DP
ʻuncommitted’ cells by E4.0. Therefore, our model is that Klf5 represses Fgf4-Fgfr-ERK signalling to suppress its precocious activation of the PrE specification programme, thus ensuring the emergence of Nanog+naïve pluripotent cells during development
(Fig. 7).
DISCUSSION
Previous experiments showed that Nanog KO caused a severe reduction inFgf4expression in blastocysts at E3.5, demonstrating that Nanog activates Fgf4 expression in EPI precursor cells (Frankenberg et al., 2011; Messerschmidt and Kemler, 2010). Moreover,Oct3/4KO led to reducedFgf4expression in blastocysts at E3.5 (Frum et al., 2013; Le Bin et al., 2014). Furthermore, mutant
embryos lacking Sox2, which cooperates with Oct3/4 in the maintenance of ESC pluripotency, showed reducedFgf4expression (Wicklow et al., 2014). Because Oct3/4-Sox2 complexes can directly induceFgf4expressionin vitro(Ambrosetti et al., 2000), there is an interplay between Nanog, Oct3/4 and Sox2 to regulate Fgf4 for proper lineage segregation (Chazaud and Yamanaka, 2016). Thus, these studies showed thatNanogandOct3/4activate Fgf4 expression in EPI precursor cells at the E3.5 blastocyst stage; however, these studies did not address the regulatory mechanism of Fgf4 at an earlier stage, such as the morula. The mechanism involved in the induction ofFgf4expression in a subset of inner cells at this stage is still unknown (Chazaud and Yamanaka, 2016). Our study demonstrated for the first time that Klf5is a crucial regulator forFgf4in the morula at E3.0, before the blastocyst stage.
BimodalFgf4expression levels precede the exclusive production of Nanog and Gata6 (Guo et al., 2010; Ohnishi et al., 2014) and is the first sign of the segregation of the EPI and PrE lineages. However, what regulates Fgf4is unknown (Artus and Chazaud, 2014; Chazaud and Yamanaka, 2016). Yamanaka and colleagues clearly demonstrated that all ICM cells acquire a PrE fate when cultured in the presence of saturated levels of FGF4, and they proposed that the local concentration of FGF4 in the inner cells is important for the establishment of its salt-and-pepper distribution at the blastocyst stage (Yamanaka et al., 2010). At E3.0-3.25, DP inner cells exist as a common precursor pool and have the potential to commit to either fate asynchronously (Saiz et al., 2016). Activity of the Fgf4-Fgfr-ERK pathway regulates the balance of EPI and PrE differentiation from common precursors. We demonstrated that Fgf4expression is induced in a subset ofFgf4-high inner cells of Klf5KO embryos at E3.0-3.25. At that time, the number of DP cells was reduced inKlf5KO embryos. Furthermore, the skewed cell fate ofKlf5KO embryos was markedly reversed by inhibitors of MEK and Fgfr. These results demonstrated thatKlf5 is involved in the segregation of the EPI and PrE lineages by suppressing precocious activation of the Fgf4-Fgfr-Fgfr-ERK pathway. Further examination of the mechanisms involved in the transcription ofKlf5 and the transcriptional activity of Klf5 protein could reveal how the bimodal expression ofFgf4is generated.
Given an elevation in Gata6 protein andSox17mRNA expression inKlf5KO embryos at E3.0 or E3.25 (Fig. 1B, Fig. 3B, Fig. 4D), this might suggest a cell-autonomous role for Klf5 in the PrE lineage. However, the mRNA expression level ofSox17at E3.0 was much lower than that of other transcription factors such as Nanog, Sox2 and Gata6 (Sox17/Nanog ratio=5.6×10⁻⁶, Sox17/
Sox2=5.28×10⁻⁵, Sox17/Gata6=0.00125), suggesting that Sox17
mRNA expression is very low. Furthermore, we detected no Sox17 protein expression (Fig. S3A). This is consistent with previous reports that Sox17 is activated between the 32- and 64-cell stages in mouse embryos (Artus et al., 2011; Morris et al., 2010; Niakan et al., 2010). Thus, the elevation inSox17mRNA expression inKlf5 KO ICM is still too low to cause PrE differentiation. The Gata6 protein expression level also showed a slight increase (29%) at E3.25 (Fig. 1B), but the mRNA expression level ofGata6was not changed significantly between WT andKlf5KO embryos at E3.0 (Fig. S5B) and E3.25 (Fig. 4D), indicating that Gata6 is not regulated by Klf5 at the transcriptional level at∼E3.0-3.25. Taken together, these data suggest that Fgf4 regulates the induction of PrE differentiation, rather than there being a Sox17- or Gata6-mediated cell-autonomous mechanism.
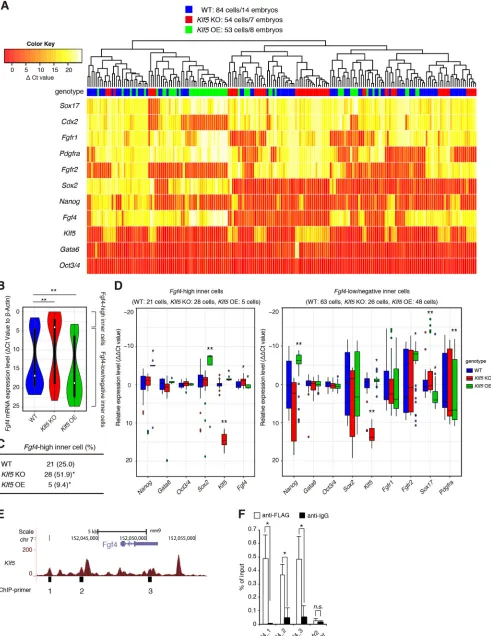
Previous studies have demonstrated that Klf5 regulates lineage specification in TE and ICM (Ema et al., 2008; Lin et al., 2010). Fig. 4.Klf5is required to suppressFgf4in a subset of inner cells at
E3.0-3.25.(A-C) Single-cell RT-qPCR analysis of inner cells from WT,Klf5KO and Klf5OE embryos at E3.25. cDNAs extracted from 84 cells from WT embryos (n=14), 54 cells fromKlf5KO embryos (n=7) and 53 cells fromKlf5OE embryos (n=8) were synthesised using the SC3-seq method. (A) TheΔCt values from the average Ct value ofβ-actin are shown as heat maps and are used for clustering. The genotype of each sample is shown above the heat map. (B) Violin plot of single-cell mRNA expression levels (ΔCt values from the average Ct value of β-actin) ofFgf4in WT,Klf5KO andKlf5OE inner cells at E3.25. Two cell populations can be distinguished byFgf4expression level:Fgf4-high cells and Fgf4-low/negative cells, as determined by aΔCt value of 4.3 that marks the 25th percentile expression levels in WT embryos. **P<0.001 (Mann–Whitney U-test). (C) Number ofFgf4-high cells among the inner cells of WT,Klf5KO and Klf5OE embryos at E3.25 from single-cell RT-qPCR as shown in A. *P<0.01, versus WT (Fisher’s exact test). (D)ΔΔCt values normalised to the average WT ΔCt value ofFgf4-high andFgf4-low/negative cells in WT,Klf5KO andKlf5OE embryos are shown as box plots.Fgf4-high cells were determined by aΔCt value of 4.3 that marks the 25th percentile expression levels in WT embryos. Sample number is indicated above each boxplot. *P<0.01, **P<0.001 (Mann– WhitneyU-test). (E) Binding peaks of Klf5 toFgf4in mouse ESCs. Numbers below binding peaks indicate regions designated for ChIP primers used in F. (F) ChIP analysis of the binding of Klf5 toFgf4in mouse ESCs. The promoter region ofVegfr2, which is not regulated by Klf5, was analysed as a negative control region. *P<0.01 (Student’st-test). n.s., not significant.
DEVEL
O
While Klf5 directly regulatesSox17 (Lin et al., 2010), it is still unclear howKlf5regulates the balance of EPI and PrE. Our results indicate thatKlf5is required to suppressFgf4in morula at E3.0, but it is not clear whether it continues to suppress Fgf4 later in development because Klf5 KO ESCs expressed normal levels of Fgf4(Fig. S5E).Fgf4andKlf5 are expressed abundantly in such cells and are important for their differentiation and for self-renewal, respectively (Ema et al., 2008; Kunath et al., 2007).Cis-regulatory regions in theFgf4promoter and enhancers are occupied by Klf5 in mouse ESCs (Fig. 4F). Nevertheless, the lack ofKlf5expression did not significantly alter Fgf4expression (Fig. S5E). Therefore, we speculate that the transcriptional repression ofFgf4byKlf5occurs within a brief developmental window, such that the induction of Fgf4 does not hamper the normal segregation of EPI and PrE lineages, and laterKlf5expression does not repressFgf4by the time the mature EPI cells arise. This is consistent with the observation that aggregation of Klf5 KO ESCs with WT tetraploid embryos generatesKlf5KO embryos that appear normal at E8.5, indicating
that Klf5 is not required for normal development once the EPI is established (Ema et al., 2008).
[image:9.612.58.555.56.442.2]Activation of the Fgf4-Fgfr-ERK pathway destabilises a naïve pluripotent state in mouse ESCs and promotes a primed state, whereas a reduction in ERK activity strongly promotes naïve pluripotency (Hamilton et al., 2013; Kunath et al., 2007; Ying et al., 2008). However, the precise molecular mechanisms of self-renewal promoted by ERK inhibition remain elusive. Although ERK inhibition contributes to self-renewal in part through the stabilisation of Klf2 and Klf4 proteins, which are subject to proteasome-dependent degradation of ERK-phosphorylated forms in mouse ESCs (Kim et al., 2012; Yeo et al., 2014), it is interesting to note that Klf5 modulates the level of pERK in mouse ESCs (T.A., unpublished observations). ERK inhibition also facilitates the emergence of naïve pluripotent cells in the blastocyst during murine development (Nichols et al., 2009). It remains unclear whether there is a specific physiological mechanism that mediates ERK inhibition to promote pluripotencyin vivo, but Klf5 could be a key genetic Fig. 5. Inhibition of Fgfr-ERK signalling rescues the cell cycle defects ofKlf5KO blastocysts.(A) Experimental outline for assessing the role of the Fgf4-Fgfr-MAPK pathway inKlf5KO blastocysts. (B) Effects of inhibitors of MEK (MEKi) and Fgfr (Fgfri) in WT andKlf5KO blastocysts. Embryos at E2.75 were recovered and incubated in the presence or absence of MEKi (PD0325901, 1 µM) and Fgfri (SU5402, 2 µM) for 24 h, and then subjected to TUNEL assay and immunohistochemistry.z-projected confocal microscopy transverse sections are shown. C, cell number. Scale bars: 25 µm. (C) Number of cells (left) and percentages of TUNEL+(apoptotic) cells (right) per embryo. Embryo numbers are shown in parentheses. (D) Bright-field and fluorescent images of WT embryos cultured in the presence of FGF4 (1μg/ml) from E2.75 to E3.75 and ofKlf5KO embryos at E3.75. Maximum intensity projections of confocal microscopy images are shown. Scale bars: 20 µm. (E) WT embryos cultured in the presence of FGF4 showed a slight, but not significant, reduction in cell number (left) and increase in the percentage of TUNEL+cells (right). Embryo numbers are shown in parentheses. *P<0.01, **P<0.001 (Mann–WhitneyU-test).
DEVEL
O
component in this regard. Further investigation of the functions of Klf5might allow us to understand how the symmetric expression of Fgf4andFgfr2is altered during early development.
MATERIALS AND METHODS
Generation ofKlf5KO and OE transgenic mice
Klf5lacZ/lacZmice were generated as previously described (Ema et al., 2008).
ThelacZ cassette was inserted into the second exon of the Klf5 gene. Conditional KO and OE alleles forKlf5were generated as described in the supplementary Materials and Methods. Primers used for the genotyping of the conditional KO and OE alleles forKlf5mice are described in Table S1. Mouse embryos were recovered at noon of the day on which the vaginal plug was discovered (considered E0.5).
Pluripotent stem cells
MouseKlf5+/+(WT)::Oct3/4-ireszeocinRESCs,Klf5lacZ/lacZ(KO)::
Oct3/4-ireszeocinRESCs andKlf5+/+(WT)::Oct3/4-ireszeocinR::Klf5 OE ESCs
were generated as previously described (Ema et al., 2008) and were cultured in DMEM+15% Knockout Serum Replacement (KSR; Invitrogen). Details are provided in the supplementary Materials and Methods.
Manipulation of early embryos
[image:10.612.97.513.66.518.2]Embryo manipulations were performed according to Nagy et al. (2003). For immunosurgery followed by ESC derivation, blastocysts were incubated with rabbit anti-mouse red blood cell antibody (Inter Cell Technologies, A3840; 1:8) for 10 min. After the blastocysts were briefly washed twice in M2, they were incubated with guinea pig serum (Calbiochem) for 15 min.
Fig. 6. Treatment with Fgfr or MEK inhibitors reverses the skewed lineage specification ofKlf5KO blastocysts.(A) Experimental outline to assess the role of the Fgf4-Fgfr-ERK pathway inKlf5KO embryos. Embryos were collected fromKlf5heterozygous intercrosses at E2.5 and cultured in the presence or absence of MEKi (PD0325901, 1 µM) for 24 h and 48 h. (B,B′) Effects of MEKi on skewed lineage specification ofKlf5KO blastocysts at E3.5 (B) and E4.5 (B′). Confocal microscopy transverse sections are shown. C, cell number. Scale bars: 20 µm. (C) Tukey box plots of Nanog and Gata6 protein expression levels per embryo and the percentage of Nanog+and Gata6+cells per embryo. Embryo numbers are shown in parentheses. Mean and s.e.m. of three independent experiments. A.U., arbitrary unit. *P<0.01, **P<0.001 (Mann–WhitneyU-test).
DEVEL
O
After removal of the zona pellucidae with acidic Tyrode’s solution (Sigma-Aldrich), the cells were cultured in ESC medium for 2 weeks on a gelatine-coated dish. Forin vitroculture of early mouse embryos, embryos at the 2-cell stage or later were incubated in KSOM (Millipore) in the presence or absence of PD0325901 (1 µM; Wako), SU5402 (2 µM; Wako), CHIR99021 (Chiron; 3 µM; Wako), JNK inhibitor II (5 µM; Calbiochem), SB203508 (10 µM; Calbiochem) or LY924002 (10 µM; Calbiochem). To activate the Fgf4-Fgfr-ERK pathway, recombinant human FGF4 (R&D Systems) was added at a saturated concentration (1μg/ml) prepared in KSOM. 1 µg/ml heparin (Sigma) was added together with FGF4 or control. BrdU was added (10 µM; BD Pharmigen) for 2 h, and BrdU Flow Kits (BD Pharmingen) were used for detection.
Immunohistochemistry
Embryos were fixed in 4% paraformaldehyde (PFA) in PBS for 15 min, permeabilised in 0.5% Triton X-100 for 15 min and incubated in blocking reagent (PBS, 10% donkey serum, 0.1% BSA, 0.01% Tween 20) for 1 h. Embryos were incubated at 4°C overnight with primary antibodies prepared in blocking reagent. After the embryos were washed with PBS+0.5% Triton X-100, they were incubated with secondary antibodies in the blocking reagent for 3 h at 4°C. Nuclei were stained with Hoechst 33342 (10 µg/ml; Molecular Probes). Antibodies used for the immunohistochemistry are described in Table S2. Immunohistochemistry with anti-FGF4 antibody was performed as described in the supplementary Materials and Methods.
Confocal microscopy analysis and image data acquisition
Embryos were mounted in drops of 30% glycerol on glass-bottom dishes. Confocal images were acquired using a Leica TCS SP5 or SP8 camera. Fluorescence was excited with a 405 nm UV laser for Hoechst 33342, a 638 nm laser for Cy5 or Alexa Fluor 633, a 552 nm laser for Cy3, and a 488 nm laser for Alexa Fluor 488. Images were acquired using an HC PL APO CS2 40×/1.30 oil-immersion objective lens (Leica), with optical sections of
2-2.5 µm. A hybrid detector system (Leica) was used for the acquisition of raw images, which were processed using Leica software or Photoshop CS6 (Adobe). Cell nuclei were counted manually using ImageJ image analysis software (National Institutes of Health). Protein expression levels were analysed as described (Dietrich and Hiiragi, 2007; Kang et al., 2013). Briefly, mean fluorescence intensities inside regions of interest (for example, nuclei) were measured, and subtracted from background signals, which were defined as the average of the mean fluorescence intensities of randomly chosen cytoplasmic signals, and were then normalised against the mean fluorescence intensity in the Hoechst channel using ImageJ (Dietrich and Hiiragi, 2007). We defined a cell as positive if it showed a higher fluorescence signal than the background. To quantify Nanog and Gata6 protein expression levels, we measured Nanog expression in both Nanog+/
Gata6− and Nanog+/Gata6+ (DP) cells, and Gata6 expression in both
Gata6+/Nanog−and DP cells.
For the quantification of FGF4 expression in preimplantation embryos, background signals were subtracted from mean fluorescence intensities inside regions of interest in the cytoplasm of FGF4+ cells. Background
signals were defined as the average of the mean fluorescence intensities of randomly chosen cytoplasmic regions in without-antibody negative controls. FGF4 expression values were then normalised against the mean fluorescence intensity in the Hoechst channel using ImageJ. Individual cells were distinguished using intercellular gaps seen in differential interference contrast (DIC) images from the same focal plane as the corresponding confocal microscopy image.
TUNEL assay
Apoptotic cells were identified using the DeadEnd Fluorometric TUNEL System (Promega). For counting TUNEL+ cells, individual cells were
[image:11.612.49.385.55.406.2]identified using the intercellular gaps seen in DIC images merged with images of nuclear staining and TUNEL staining. Fragmented or pyknotic nuclei bounded by the same intercellular gap were counted as one cell.
Fig. 7. Model for the role ofKlf5in ICM lineage specification.At E3.0, the inner cells are DP precursors. At E3.5-3.75, the salt-and-pepper distribution of Nanog and Gata6 is evident, and cells are considered Nanog+EPI and Gata6+PrE lineage precursor cells. At E4.0-4.25, the lineages have been determined. Although Fgf4-ERK signalling is not involved in the initial coexpression of Nanog and Gata6, it regulates EPI/PrE specification by inhibiting Nanog and maintaining Gata6 expression. In theKlf5 KO embryos,Fgf4is overexpressed because of derepression in the absence ofKlf5, leading to PrE lineage specification. Gata4, a late marker for PrE lineage specification, is seen from the 64-cell stage in Klf5KO embryos but only in a fewKlf5OE embryos, indicating accelerated differentiation into the PrE lineage. At E3.5,Fgf4is activated in EPI precursor cells in a Nanog- and Oct3/4-dependent manner [according to Frankenberg et al. (2011); Frum et al. (2013); Le Bin et al. (2014); Messerschmidt and Kemler (2010)]. Klf5 represses precociousFgf4 transcription to suppress the Fgf4-Fgfr-ERK pathway, thereby ensuring Nanog+pluripotent EPI
development.
DEVEL
O
Chromatin immunoprecipitation (ChIP) assays
ChIP assays were performed as previously described (Ito et al., 2013). Cells were fixed with 1% formaldehyde and sonicated. The samples were incubated with normal mouse IgG and anti-FLAG-M2 antibody. For details, see the supplementary Materials and Methods. Primers used for ChIP-qPCR are listed in Table S3.
ChIP-sequencing (ChIP-seq) data analysis
To locateFgf4loci occupied by Klf5 in mouse ESCs, ChIP-seq data of Aksoy et al. (2014) were analysed as described in the supplementary Materials and Methods.
Microarray analysis
cDNAs were synthesised from individual WT andKlf5KO embryos at E3.0 as previously described (Kurimoto et al., 2007; Nakamura et al., 2015). The cDNAs were amplified further in a linear fashion and labelled with a Cy3- or Cy5-conjugated nucleotide. Hybridisation procedures were performed by TaKaRa Bio. Raw data were analysed using GeneSpring software version 13.0 (Agilent Technologies). The raw probe intensities were background subtracted. Signal values were set to threshold level 10 and log2 transformed. Normalization was performed using a 75th percentile shift algorithm. Further normalization using baseline to median of all samples algorithm was performed. Transcripts were filtered with 2-fold expression change compared with the median intensity in all samples.
Isolation of single cells for cDNA amplification
Outer cells of E3.25 embryos were removed by immunosurgery. Inner cells were incubated in a 1:1 mixture of Accutase (Nakalai Tesque) and 0.25% trypsin-EDTA (Invitrogen) for∼5 min at 37°C and then dissociated into single cells by pipetting. cDNAs were synthesised from the isolated single cell using the single-cell mRNA 3-prime sequencing (SC3-seq) method as previously described (Nakamura et al., 2015).
RT-qPCR analysis
First-strand cDNA was synthesised from total RNA using the QuantiTect Reverse Transcription Kit (Qiagen). Real-time PCR was performed with SYBR Premix Ex Taq II (TaKaRa) and analysed on a Thermal Cycler Dice Real-Time System (TP850; TaKaRa). The amount of target RNA was estimated using an appropriate standard curve and divided by the estimated amount ofβ-actin for normalisation. Primers used for RT-qPCR are listed in Table S3.
Statistical analysis
Statistical analyses were performed using the nonparametric Mann– WhitneyU-test or Student’st-test. Data are expressed as the mean and s. e. Differences were considered significant atP<0.05. Statistical analyses were performed using Prism6 (GraphPad) for the nonparametric Mann– WhitneyU-test and Excel (Microsoft) for Student’st-test. Single-cell qPCR data analysis was performed using R software with gplots (ver. 3.0.1) and ggplot2 (ver. 2.2.1) and Excel (Microsoft).
Acknowledgements
We thank Drs Hitoshi Niwa, Yojiro Yamanaka and Tomoyuki Tsukiyama for helpful discussions and reagents. M.E. thanks Dr Vincent Kelly for critical reading of the manuscript.
Competing interests
The authors declare no competing or financial interests.
Author contributions
Conceptualization: M.E., T.A.; Methodology: T.A., T.W., K.M., H.J., J.Y., I.M., R.N., T.K., T.N., K.K., M.S., S.T.; Software: T.W., M.M., T.N., K.K., M.S.; Validation: T.A.; Formal analysis: T.A.; Investigation: T.A., T.W., K.M., H.J., A.K.; Resources: I.M., R.N., T.K., S.T.; Data curation: T.A., T.K.; Writing original draft: M.E., T.A.; Writing -review & editing: M.E., T.A., T.K.; Supervision: M.E.; Funding acquisition: M.E.
Funding
This work was supported in part by a grant from PRESTO, Japan Science and Technology Agency (JST) (to M.E.). This work was also supported by a
Grant-in-Aid for Japan Society for the Promotion of Science (JSPS) Fellows (20057002 to T.A. and T.W.).
Data availability
Microarray data have been deposited at Gene Expression Omnibus under accession number GSE65020.
Supplementary information
Supplementary information available online at
http://dev.biologists.org/lookup/doi/10.1242/dev.150755.supplemental
References
Aksoy, I., Giudice, V., Delahaye, E., Wianny, F., Aubry, M., Mure, M., Chen, J.,
Jauch, R., Bogu, G. K., Nolden, T. et al.(2014). Klf4 and Klf5 differentially inhibit
mesoderm and endoderm differentiation in embryonic stem cells.Nat. Commun.
5, 3719.
Ambrosetti, D.-C., Schöler, H. R., Dailey, L. and Basilico, C.(2000). Modulation
of the activity of multiple transcriptional activation domains by the DNA binding domains mediates the synergistic action of Sox2 and Oct-3 on the fibroblast growth factor-4 enhancer.J. Biol. Chem.275, 23387-23397.
Artus, J. and Chazaud, C.(2014). A close look at the mammalian blastocyst:
epiblast and primitive endoderm formation.Cell. Mol. Life Sci.71, 3327-3338.
Artus, J., Panthier, J.-J. and Hadjantonakis, A.-K.(2010). A role for PDGF
signaling in expansion of the extra-embryonic endoderm lineage of the mouse blastocyst.Development137, 3361-3372.
Artus, J., Piliszek, A. and Hadjantonakis, A.-K.(2011). The primitive endoderm
lineage of the mouse blastocyst: sequential transcription factor activation and regulation of differentiation by Sox17.Dev. Biol.350, 393-404.
Bedzhov, I. and Zernicka-Goetz, M.(2015). Cell death and morphogenesis during
early mouse development: are they interconnected?BioEssays37, 372-378.
Bessonnard, S., De Mot, L., Gonze, D., Barriol, M., Dennis, C., Goldbeter, A.,
Dupont, G. and Chazaud, C.(2014). Gata6, Nanog and Erk signaling control cell
fate in the inner cell mass through a tristable regulatory network.Development
141, 3637-3648.
Boroviak, T., Loos, R., Bertone, P., Smith, A. and Nichols, J.(2014). The ability of
inner-cell-mass cells to self-renew as embryonic stem cells is acquired following epiblast specification.Nat. Cell Biol.16, 516-528.
Chan, Y.-S., Göke, J., Ng, J.-H., Lu, X., Gonzales, K. A. U., Tan, C.-P., Tng, W.-Q.,
Hong, Z.-Z., Lim, Y.-S. and Ng, H.-H.(2013). Induction of a human pluripotent
state with distinct regulatory circuitry that resembles preimplantation epiblast.Cell Stem Cell13, 663-675.
Chazaud, C. and Yamanaka, Y. (2016). Lineage specification in the mouse
preimplantation embryo.Development143, 1063-1074.
Chazaud, C., Yamanaka, Y., Pawson, T. and Rossant, J.(2006). Early lineage
segregation between epiblast and primitive endoderm in mouse blastocysts through the Grb2-MAPK pathway.Dev. Cell10, 615-624.
Corson, L. B., Yamanaka, Y., Lai, K.-M. V. and Rossant, J.(2003). Spatial and
temporal patterns of ERK signaling during mouse embryogenesis.Development
130, 4527-4537.
Dietrich, J.-E. and Hiiragi, T.(2007). Stochastic patterning in the mouse
pre-implantation embryo.Development134, 4219-4231.
Ema, M., Mori, D., Niwa, H., Hasegawa, Y., Yamanaka, Y., Hitoshi, S., Mimura, J.,
Kawabe, Y., Hosoya, T., Morita, M. et al.(2008). Krüppel-like factor 5 is essential
for blastocyst development and the normal self-renewal of mouse ESCs.Cell Stem Cell3, 555-567.
Frankenberg, S., Gerbe, F., Bessonnard, S., Belville, C., Pouchin, P., Bardot, O.
and Chazaud, C.(2011). Primitive endoderm differentiates via a three-step
mechanism involving Nanog and RTK signaling.Dev. Cell21, 1005-1013.
Frum, T., Halbisen, M. A., Wang, C., Amiri, H., Robson, P. and Ralston, A.(2013).
Oct4 cell-autonomously promotes primitive endoderm development in the mouse blastocyst.Dev. Cell25, 610-622.
Grabarek, J. B., Zyzyńska, K., Saiz, N., Piliszek, A., Frankenberg, S., Nichols, J.,
Hadjantonakis, A.-K. and Plusa, B.(2012). Differential plasticity of epiblast and
primitive endoderm precursors within the ICM of the early mouse embryo. Development139, 129-139.
Guo, G., Huss, M., Tong, G. Q., Wang, C., Li Sun, L., Clarke, N. D. and Robson, P.
(2010). Resolution of cell fate decisions revealed by single-cell gene expression analysis from zygote to blastocyst.Dev. Cell18, 675-685.
Hamilton, W. B., Kaji, K. and Kunath, T.(2013). ERK2 suppresses self-renewal
capacity of embryonic stem cells, but is not required for multi-lineage commitment. PLoS ONE8, e60907.
Hermitte, S. and Chazaud, C.(2014). Primitive endoderm differentiation: from
specification to epithelium formation.Philos. Trans. R. Soc. Lond. B Biol. Sci.369, pii: 20130537.
Ito, I., Waku, T., Aoki, M., Abe, R., Nagai, Y., Watanabe, T., Nakajima, Y., Ohkido,
I., Yokoyama, K., Miyachi, H. et al.(2013). A nonclassical vitamin D receptor
pathway suppresses renal fibrosis.J. Clin. Invest.123, 4579-4594.
DEVEL
O
Jeon, H., Waku, T., Azami, T., Khoa, L. T. P., Yanagisawa, J., Takahashi, S. and
Ema, M. (2016). Comprehensive identification of Krüppel-like factor family
members contributing to the self-renewal of mouse embryonic stem cells and cellular reprogramming.PLoS ONE11, e0150715.
Jiang, J., Chan, Y.-S., Loh, Y.-H., Cai, J., Tong, G.-Q., Lim, C.-A., Robson, P.,
Zhong, S. and Ng, H.-H.(2008). A core Klf circuitry regulates self-renewal of
embryonic stem cells.Nat. Cell Biol.10, 353-360.
Kang, M., Piliszek, A., Artus, J. and Hadjantonakis, A.-K. (2013). FGF4 is
required for lineage restriction and salt-and-pepper distribution of primitive endoderm factors but not their initial expression in the mouse. Development
140, 267-279.
Kang, M., Garg, V. and Hadjantonakis, A.-K.(2017). Lineage establishment and
progression within the inner cell mass of the mouse blastocyst requires FGFR1 and FGFR2.Dev. Cell41, 496-510.e5.
Kim, M. O., Kim, S.-H., Cho, Y.-Y., Nadas, J., Jeong, C.-H., Yao, K., Kim, D. J., Yu,
D.-H., Keum, Y.-S., Lee, K.-Y. et al.(2012). ERK1 and ERK2 regulate embryonic
stem cell self-renewal through phosphorylation of Klf4.Nat. Struct. Mol. Biol.19, 283-290.
Krawchuk, D., Honma-Yamanaka, N., Anani, S. and Yamanaka, Y.(2013). FGF4
is a limiting factor controlling the proportions of primitive endoderm and epiblast in the ICM of the mouse blastocyst.Dev. Biol.384, 65-71.
Kunath, T., Saba-El-Leil, M. K., Almousailleakh, M., Wray, J., Meloche, S. and
Smith, A. (2007). FGF stimulation of the Erk1/2 signalling cascade triggers
transition of pluripotent embryonic stem cells from self-renewal to lineage commitment.Development134, 2895-2902.
Kurimoto, K., Yabuta, Y., Ohinata, Y., Ono, Y., Uno, K. D., Yamada, R. G., Ueda,
H. R. and Saitou, M.(2006). An improved single-cell cDNA amplification method
for efficient high-density oligonucleotide microarray analysis.Nucleic Acids Res.
34, e42.
Kurimoto, K., Yabuta, Y., Ohinata, Y. and Saitou, M.(2007). Global single-cell
cDNA amplification to provide a template for representative high-density oligonucleotide microarray analysis.Nat. Protoc.2, 739-752.
Le Bin, G. C., Muñoz-Descalzo, S., Kurowski, A., Leitch, H., Lou, X., Mansfield,
W., Etienne-Dumeau, C., Grabole, N., Mulas, C., Niwa, H. et al.(2014). Oct4 is
required for lineage priming in the developing inner cell mass of the mouse blastocyst.Development141, 1001-1010.
Lin, S.-C. J., Wani, M. A., Whitsett, J. A. and Wells, J. M.(2010). Klf5 regulates
lineage formation in the pre-implantation mouse embryo. Development 137, 3953-3963.
Messerschmidt, D. M. and Kemler, R.(2010). Nanog is required for primitive
endoderm formation through a non-cell autonomous mechanism.Dev. Biol.344, 129-137.
Morris, S. A., Teo, R. T. Y., Li, H., Robson, P., Glover, D. M. and Zernicka-Goetz, M.(2010). Origin and formation of the first two distinct cell types of the inner cell mass in the mouse embryo.Proc. Natl. Acad. Sci. USA107, 6364-6369.
Nagy, A., Gertsenstein, M., Vintersten, K. and Behringer, R.(2003).Manipulating
the Mouse Embryo. Cold Spring Harbor, NY: Cold Spring Harbor Laboratory Press.
Nakamura, T., Yabuta, Y., Okamoto, I., Aramaki, S., Yokobayashi, S., Kurimoto,
K., Sekiguchi, K., Nakagawa, M., Yamamoto, T. and Saitou, M.(2015).
SC3-seq: a method for highly parallel and quantitative measurement of single-cell gene expression.Nucleic Acids Res.43, e60.
Niakan, K. K., Ji, H., Maehr, R., Vokes, S. A., Rodolfa, K. T., Sherwood, R. I.,
Yamaki, M., Dimos, J. T., Chen, A. E., Melton, D. A. et al.(2010). Sox17
promotes differentiation in mouse embryonic stem cells by directly regulating extraembryonic gene expression and indirectly antagonizing self-renewal.Genes Dev.24, 312-326.
Nichols, J., Silva, J., Roode, M. and Smith, A. (2009). Suppression of Erk
signalling promotes ground state pluripotency in the mouse embryo.Development
136, 3215-3222.
Ohnishi, Y., Huber, W., Tsumura, A., Kang, M., Xenopoulos, P., Kurimoto, K.,
Oleś, A. K., Araúzo-Bravo, M. J., Saitou, M., Hadjantonakis, A.-K. et al.(2014).
Cell-to-cell expression variability followed by signal reinforcement progressively segregates early mouse lineages.Nat. Cell Biol.16, 27-37.
Oishi, Y., Manabe, I., Tobe, K., Ohsugi, M., Kubota, T., Fujiu, K., Maemura, K.,
Kubota, N., Kadowaki, T. and Nagai, R.(2008). SUMOylation of Krüppel-like
transcription factor 5 acts as a molecular switch in transcriptional programs of lipid metabolism involving PPAR-delta.Nat. Med.14, 656-666.
Plusa, B., Piliszek, A., Frankenberg, S., Artus, J. and Hadjantonakis, A.-K.
(2008). Distinct sequential cell behaviours direct primitive endoderm formation in the mouse blastocyst.Development135, 3081-3091.
Rossant, J. and Tam, P. P. L.(2009). Blastocyst lineage formation, early embryonic
asymmetries and axis patterning in the mouse.Development136, 701-713.
Saiz, N., Williams, K. M., Seshan, V. E. and Hadjantonakis, A.-K. (2016).
Asynchronous fate decisions by single cells collectively ensure consistent lineage composition in the mouse blastocyst.Nat. Commun.7, 13463.
Schrode, N., Saiz, N., Di Talia, S. and Hadjantonakis, A.-K.(2014). GATA6 levels
modulate primitive endoderm cell fate choice and timing in the mouse blastocyst. Dev. Cell29, 454-467.
Singh, A. M., Hamazaki, T., Hankowski, K. E. and Terada, N. (2007). A
heterogeneous expression pattern for Nanog in embryonic stem cells.Stem Cells
25, 2534-2542.
Smith, A.(2017). Formative pluripotency: the executive phase in a developmental
continuum.Development144, 365-373.
Takahashi, K. and Yamanaka, S.(2006). Induction of pluripotent stem cells from
mouse embryonic and adult fibroblast cultures by defined factors.Cell126, 663-676.
Theunissen, T. W., Powell, B. E., Wang, H., Mitalipova, M., Faddah, D. A., Reddy,
J., Fan, Z. P., Maetzel, D., Ganz, K., Shi, L. et al.(2014). Systematic identification
of defined conditions for induction and maintenance of naive human pluripotency. Stem Cell15, 1-17.
Wicklow, E., Blij, S., Frum, T., Hirate, Y., Lang, R. A., Sasaki, H. and Ralston, A.
(2014). HIPPO pathway members restrict SOX2 to the inner cell mass where it promotes ICM fates in the mouse blastocyst.PLoS Genet.10, e1004618.
Yamanaka, Y., Lanner, F. and Rossant, J. (2010). FGF signal-dependent
segregation of primitive endoderm and epiblast in the mouse blastocyst. Development137, 715-724.
Yeo, J.-C., Jiang, J., Tan, Z.-Y., Yim, G.-R., Ng, J.-H., Göke, J., Kraus, P., Liang,
H., Gonzales, K. A. U., Chong, H.-C. et al.(2014). Klf2 is an essential factor that
sustains ground state pluripotency.Cell Stem Cell14, 864-872.
Ying, Q.-L., Wray, J., Nichols, J., Batlle-Morera, L., Doble, B., Woodgett, J.,
Cohen, P. and Smith, A.(2008). The ground state of embryonic stem cell
self-renewal.Nature453, 519-523.