Optimization of PID Controller Parameters based on
Genetic Algorithm for non-linear Electromechanical
Actuator
Shayma'a A. Mahdi
College of Engineering, University of Baghdad.
ABSTRACT
The servo motors system have been widely used in industrial robotics and electronics due to its excellent speed control characteristics even though its maintenance costs are higher than the induction motor. In this paper, the genetic algorithm were used for non-linear electromechanical actuator to determine the optimal parameters of the PID controller to improve the transient response of the system. The designed parameters which were optimized are rise time, peak time, settling time and maximum overshoot. The Simulation results show that the genetic algorithm is a fast and flexible tuning method to determine the optimal parameters of PID controller for wide range of requirements to achieve satisfied performance for stable system. Genetic Algorithm applied in PID controller improves transient response, the average percent overshoot reduction about 80% compared to the conventional methods such as optimized fuzzy supervisory PID, while keep the delay time, rise time and peak time almost unchanged and improves the settling time
Keywords
: Electromechanical Actuator, Genetic Algorithm, PID controller, Optimization.1-INTRODUCTION
The use of electromechanical actuation is becoming increasingly popular in the aerospace industry as more importance is placed on maintainability. Electromechanical actuators (EMAS) are being used in the actuation of flight critical control surfaces and in thrust vector control [1]. Electrical motor servo systems are indispensable in modern industries. Servo motors are used in a variety of applications in industrial electronics and robotics that includes precision positioning as well as speed control [2]. Servomotors use feedback controller to control the speed or the position, or both. The basic continuous feedback controller is PID controller which possesses good performance. However is adaptive enough only with flexible tuning. Although many advanced control techniques such as self-tuning control, model reference adaptive control, sliding mode control and fuzzy control have been proposed to improve system performances, the conventional PI/PID controllers are still dominant in majority of real-world servo systems [1].To implement a PID controller the proportional gain KP, the integral gain KI and the derivative gain KD must be determined carefully. Many approaches have been developed to determine PID controller parameters for single input single output (SISO) systems.
2-MATHEMATICAL
SYSTEM
MODEL
A-Linear model
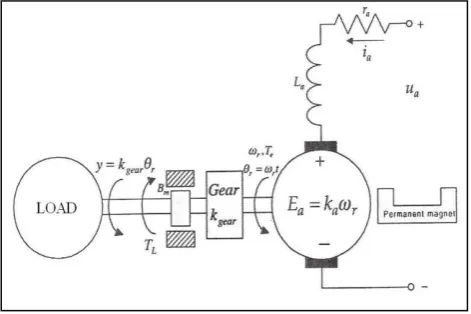
[image:1.595.307.543.380.537.2]Consider a DC servo motor as shown in figure(1). A simple mathematical relationship between the shaft angular position and voltage input to the DC motor may be derived from physical laws. In the point of control system, DC servo motor can be considered as SISO plant [3]. Therefore, complications related to multi-input system are discarded. DC servo motors have the field coil in parallel with the armature. The current in the field coil and the armature are independent of one another. As a result, these motors have excellent speed and position control [4]
Fig. 1 Schematic diagram of the DC motor.
To find the transfer function for the block diagram of the open and closed loop system a differential equation used to describe the system dynamic. In the begging
Kirchhoff’s voltage is use to map the armature circuitry dynamic of the motor.
(1)
Then using Newton’s 2nd law
(2)
The electromagnetic torque developed by the permanent-magnet DC motor
The viscous friction torque
(4)
The load torque is denoted as TL. Use the Newton’s second law, we have
(5)
The dynamics of the rotor angular displacement
(6)
To find the transfer function, the derived three first-order differential equation
(7)
(8)
and
(9)
Using the Laplace operator
(10)
(11)
(12)
(13)
A simple model that could describe an actuator ,s dynamics is a linear second – order system with demping ratio zeta (ζ) and natural frequency omega (ωn). The transfer function of a
second – order system is given below, where ( ) is the output and ( is the input[5].
(s) = G (s) . (s) = ( ωn2/ s(s2+2ζ ωn s+ ωn2) ) (14 )
B- Nonlinear Model
The nonlinear model equations [6]:
R(s) = (s) - (s)Lim (15) (15)
Y(s) = R(s)[Kp + Ki/s +s Kd] (16) (16)
s2 (s) = ω
n2 [Y(s) - RATEFB - ] - HM (17)
Fig.2 Block diagram of non-linear electromechanical servo motor to adjust PID parameters via GA.
3- GENETIC ALGORITHIMS (GAs)
The GAs differ from traditional search and optimization methods by four differences, they are:
• GAs search not a single point but a population of points in parallel,
• GAs do not require an auxiliary knowledge;
just the objective function and corresponding fitness levels influence thedirections of search.
• GAs, do not use deterministic ones but only probabilistic transition rules.
• GAs work on an encoding of the parameter set rather than the parameter set
itself (except in where real-valued individuals are used)[8].
4-METHODOLOGY
[
9]
In a genetic algorithm, a population of strings (called chromosomes or the genotype of the genome), which encode candidate solutions (called individuals, creatures, or phenotypes) to an optimization problem, is evolved toward better solutions. Traditionally, solutions are represented in binary as strings of 0s and 1s, but other encodings are also possible. The evolution usually starts from a population of randomly generated individuals and happens in generations. In each generation, the fitness of every individual in the population is evaluated, multiple individuals are stochastically selected from the current population (based on their fitness), and modified (recombined and possibly randomly mutated) to form a new population. The new population is then used in the next iteration of the algorithm. Commonly, the algorithm terminates when either a maximum number of generations has been produced, or a satisfactory fitness level has been reached for the population. A typical genetic algorithm requires:
a genetic representation of the solution domain,
a fitness function to evaluate the solution domain.
Fig.3 Genetic algorithm – program flow chart.
5- SIMULATION RESULTS
PID controller parameters will be optimized by applying GA. Here we use Matlab Genetic Algorithm to simulate it. The first and the most crucial step is to encoding the problem into suitable GA chromosomes and then construct the population. Each chromosome comprises of three parameters, Kd, Kp, Ki, with value bounds varied depend on objective functions used.
There are several variables used as the standard to measure systems performance. In general, unit step input is used to test the systems, and the output signals is characterized by some standard performance measures: delay time, rise time, percent overshoot, peak time, settling time, and error signal. All these measures are defined in time domain response.
where the maximum value reached (overshoot) at 3.2 second. settling time, for example 1% criterion, 2% criterion, and 5% criterion. Here we use 5% criterion settling time. And error signal is the difference between the input signal magnitude and system response final magnitude. In this work four cases are taken :
The first case when ∆ =0.75 for deadzone (RAETFE) and ζ is variable from (0.1-1.0) as shown in table (1).While the second case when ∆ =0. 5 for deadzone (RAETFE) and ζ is variable from (0.1-1.0) as shown in table (2).
[image:4.595.308.574.106.600.2]The third case when ζ =0.3 and ∆ is variable from (0.1-1.0) as shown in table (3).While the fourth case when ζ =0.6 and ∆ is variable from (0.1-1.0) as shown in table (4)
Fig.4 Standard performance measures of a typical system driven by unit step input for PID controller.
There are four tables for the four mentioned cases, which are in Table 1 shows the genetic algorithm optimum results for different gain values of PID and transient performance when ∆ =0.75 for dead zone (RAETFE) , ULIM = 200 for saturation, ΩN = 144, HM = 3 (HUGE MOMENT).
Table 1 Genetic Algorithm Optimum Results
Fig.5 The relation between damping ratio zeta ζ max.peak overshoot Mp when deadzone time delta ∆=0.75
[image:4.595.63.249.254.559.2]Fig.6 The relation between damping ratio zeta ζ & delay timeTd when deadzone time delta ∆=0.75
[image:5.595.42.549.88.686.2]Fig.7 The relation between damping ratio zeta ζ & rise timeTr when deadzone delta ∆=0.75
Fig.8 The relation between damping ratio zeta &peak time Tp when deadzone time delta ∆=0.75
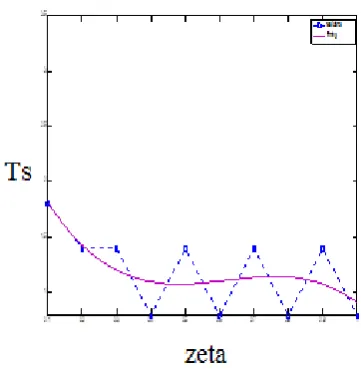
[image:5.595.54.241.305.455.2]Fig.9 The relation between damping ratio zeta &settling time Ts when deadzone time delta ∆=0.75
Table 2, shows genetic algorithm optimum results for different gain values of PID and transient performance when ∆ =0.5 for deadzone (raetfe) , ulim = 200 for saturation, ωn = 144, hm = 3 (huge moment)
Table 2 Genetic Algorithm Optimum Results
[image:5.595.59.545.390.667.2]Fig.10 The relation between damping ratio zeta ζ &max.peak overshoot Mp when deadzone time delta
∆=0.5
[image:6.595.330.526.72.231.2]Fig.11 The relation between damping ratio zeta ζ & delay timeTd when deadzone time delta ∆=0.5
Fig.12 The relation between damping ratio zeta ζ & rising timeTr when deadzone time delta ∆=0.5
[image:6.595.28.262.74.240.2]Fig.(13) The relation between damping ratio Zeta ζ & Peak timeTp when deadzone time delta ∆=0.5
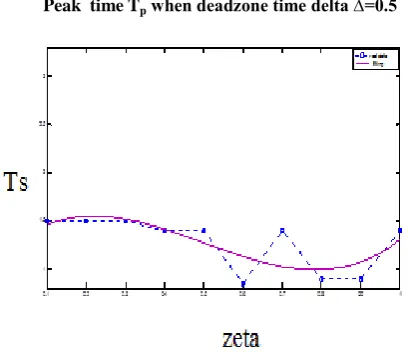
[image:6.595.318.522.260.436.2]Fig.14 The relation between damping ratio zeta ζ & settling timeTs when deadzone time delta ∆=0.5
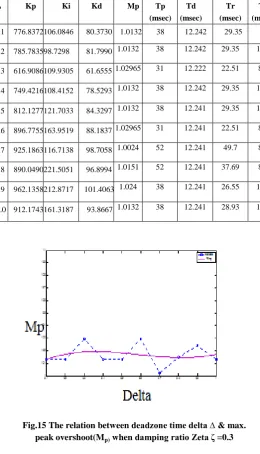
[image:6.595.63.242.492.643.2]Table 3 Genetic Algorithm Optimum Results
Fig.15 The relation between deadzone time delta ∆ & max. peak overshoot(Mp) when damping ratio Zeta ζ =0.3
[image:7.595.32.293.89.544.2]Fig.16 The relation between deadzone time delta ∆ & delay time Td when damping ratio zeta ζ =0.3
[image:7.595.331.526.290.435.2]Fig.17 The relation between deadzone time delta∆ & rising time(Tr) when ζ=0.3
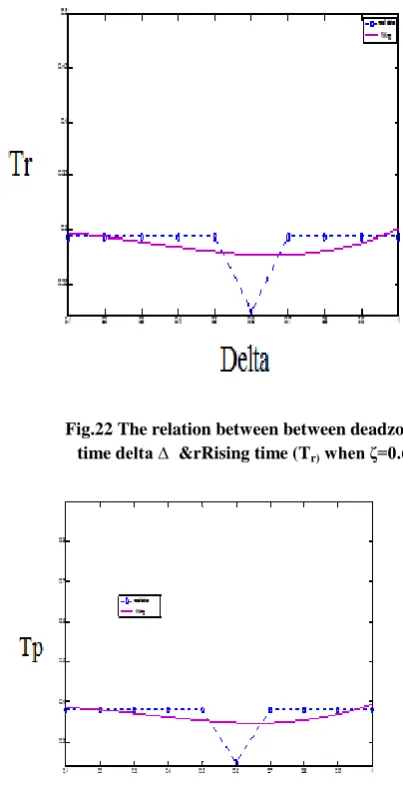
Fig.18 The relation between deadzone time delta ∆ & peak time Tp when damping ratio zeta ζ =0.3
Fig.19 The relation between deadzone time delta ∆ & settling time Ts when damping ratio zeta ζ =0.3
[image:7.595.333.522.485.644.2] [image:7.595.54.254.546.713.2]Fig.20 The relation between deadzone time delta ∆ &max. peak overshoot (Mp) when ζ=0.6
Table 4 Genetic Algorithm Optimum Results
Fig.21 The relation between between deadzone time delta ∆ &delay time (Td) when ζ=0.6
Fig.22 The relation between between deadzone time delta ∆ &rRising time (Tr) when ζ=0.6
Fig.23 The relation between between deadzone time Ts
(msec) Tr
(msec) Td
(msec) Tp
(msec) Mp kd
Ki Kp
∆
160 29.36
12.245 38
1.0132 64.4189 89.5452 626.7801 0.1
160 29.36
12.25 38
1.0132 101.2775 176.5927
959.8850 0.2
170 29.36
12.245 38
1.0132 86.0727 133.5264 857.4701
0.3
170 29.36
12.245 38
1.0132 91.1001 98.1728 916.1705 0.4
170 29.36
12.242 38
1.0132 96.3753 156.1254 949.8885
0.5
125 22.51
12.242 25
1.0249 68.8030 72.945
695.2232 0.6
160 29.36
12.242 38
1.0132 75.8768 85.9769 727.0700 0.7
170 29.36
12.245 38
1.0132 97.6081 129.6789 973.6226
0.8
170 29.36
12.245 38
1.0132 81.8213 83.1211 807.6227 0.9
170 29.36
12.245 38
1.0132 92.6512 126.0383 894.7265
[image:8.595.324.526.314.716.2] [image:8.595.12.303.354.598.2]Fig.24 The relation between between deadzone time delta ∆ &sittling time (Ts) when ζ=0
.6
6- CONCULUSION
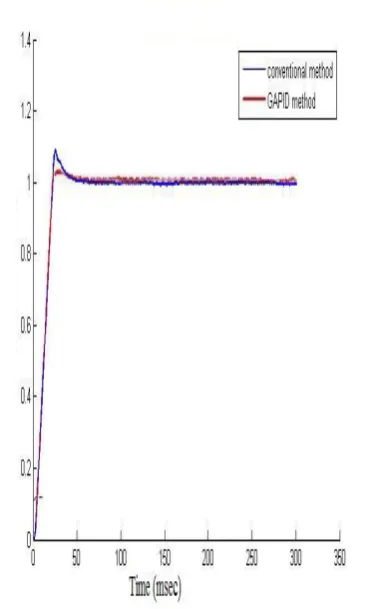
The genetic algorithm based PID tuning provides much better results compared to the conventional methods as shown in figure (4).
The conventional method is good for getting the initial values of the PID tuning which needs to be modified.
In the designed PID controller tuning with GA, the actual response was found to be satisfying the required value. PID controller gain values depend upon the range selected for the initial population. The range of requirement can be widened by increasing the range of initial population but the number of generations required to converge to optimal value may increase.
Genetic Algorithm applied in PID controller improves transient response. This is shown by average percent overshoot reduction about 80% compared to the conventional methods such as genetic PID optimization and genetic algorithm optimized fuzzy supervisory PID, while keep the delay time, rise time and peak time almost unchanged and improves the settling time as shown in figures (6) to figure (24).
7- REFERENCES
[1] Milan R. Ristanovic, Dragan V. Lazic and Ivica Indin (2008), "Nonlinear PID Controller Modification of The Electromechanical Actuator System for Aerofin Control with a PWM Controlled D.C. Motor", Automatic Control and Robotics Vol. 7, No.1, 2008 pp.131-139.
[2] Bindu R., Mini K. Namboothiripad (2012) "Tuning of PID Controller for DC Servo Motor using Genetic Algorithm" International Journal of Emerging Technology and Advanced Engineering Volume 2, Issue 3, pp.310-317March 2012.
[3] Victor M. Becerra, (2009), Nonlinear Control, Lecture 8, University of Reading, School of Systems Engineering. [4] Mohamed Farid Bin Mohamed Faruq(2008),"PID
Controller Design For Controlling DC Motor Speed
Using MATLAP Application". Universiti Malaysia Pahang, Electrical & Electronics Engineering.
[5] Chung-Hee Yoo, Young-Cheol Lee and Sang-Yeal Lee (2005),"A Robust Controller for an Electro-Mechanical Fin Actuator", Agency for Defense Development, South Korea.
[6] Shaimaa A. Mahdi, Zeina A. Abdul Redha (2011) "The Linear and Non-linear electromechanical Fin actuators" Al-Khwarizmi Engineering Journal Vol.7 , No. 4 , 2011 pp.88-96.
[7] Ayman A. Aly(2011)," PID Parameters Optimization Using Genetic Algorithm Technique for Electrohydraulic Servo Control System" Intelligent Control and Automation Journal Vol.2 , 2011 pp. 69-76. [8] Andri Mirzal, Shinichiro Yoshii, Masashi Furukawa
(2003)"PID Parameters Optimization by Using Genetic Algorithm"Graduate School of Information Science and Technology Hokkaido University Sapporo, Japan. [9] Nibal Fadel Farman(2013), "Performance of the Solar
8- NAMENCLATUR
Symbol Meaning Unit
Damping ratio ---
n Natural Frequency Rad /sec
Kp Proportional gain
Ki Integral gain ---
Kd Derivative gain
Deadzone delay time Sec.
Mp Maximum peak overshoot
Td Delay time Sec.
Tr Rising time Sec.
Tp Peak time Sec.