Service Oriented Architecture for Remote Sensing
Satellite Telemetry Data Implemented on Grid
Computing
Abdelfattah El-Sharkawi
, Ph.D Associate professor, Software Engineering, Al – Azhar University,Cairo, Egypt
Ahmed Shouman,
Ph.DLecturer, Department of Engineering and Computer Science, Faculty of Electronic Engineering, Monoufia University,
Cairo, Egypt
Sayed Lasheen
Telemetry senior engineer, National Authority for RemoteSensing and Space Science (NARSS), Cairo, Egypt
ABSTRACT
This paper illustrates how a grid computing architecture and a service oriented architecture (SOA) will accelerate telemetry (TM) data processing and make flexible TM data analysis service. Moreover, this paper will articulate grid computational and data resources management, tacking a TM system as a case study from the Egyptian space program (ESP).
General Terms
Modeling, distributed computing
Keywords
Grid computing, Telemetry data, service oriented architecture, national authority for remote sensing and space science (NARSS)
1.
INTRODUCTION
Remote sensing satellite TM data has been implemented on the cloud computing in our previous work [12] and in this paper we will implement it on the grid computing, hence, comparative study will be done with cloud computing implementation to show the value of the research.
1.1
Space System Components
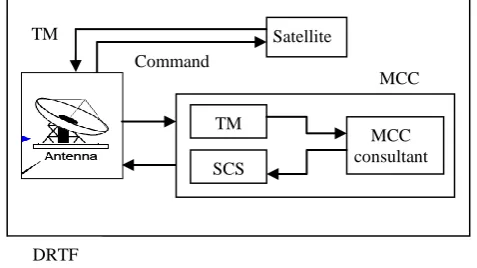
[image:1.595.307.546.535.669.2]Any space system can be represented as two components. First is a space segment such as Low Earth Orbit (LEO) satellites [1]
Fig. 1: Space system components
The second is a ground segment which has two parts first is Data Reception and Transmission Facilities (DRTF) that is responsible to communicate with the space segment and second part is Mission control center (MCC) that is
responsible to plan payload missions and receive TM data, analyze them and take in flight control decisions. Figure 1summarizes this structure.
1.2
Low Earth Orbit (LEO) Remote
Sensing Satellites
Among the important applications of LEO satellites is remote sensing. Satellites are controlled by a Ground Station on earth that sends commands and receives telemetry from satellite to maintain proper operation. LEO satellites could be visible for only a period of time from the point of view of an observer on earth. They can send data to the Ground Station when they pass by a Ground Station zone. Therefore, the Ground station plays a very important role in the communication process with satellites [1]
1.3
Telemetry (TM) Data
Data transmitted from a satellite during satellite’s ground contact involve not only image data but also housekeeping telemetry data including information about satellite health which comprises a set of satellite status indicators and sensors read outs such as electric current of the on-board equipment and temperature etc. [1]
Fig. 2: MCC decision support mechanism
TM subsystem and Satellite Control Subsystem (SCS) together are considered as a decision support system in MCC. If MCC discovers that some mistakes occur through the quick satellite health checking from TM report, MCC normally take the suitable decision by uploading the corresponding commands through SCS. Figure 2 summarizes this decision support mechanism.
Space system
Space segment Ground segment
MCC DRTF
TM PPS
ODPS SCS
1.4
Grid Computing
A grid is a collection of machines, sometimes referred to as nodes, resources, members, donors, clients, hosts, engines, and many other such terms. They all contribute any combination of resources to the grid as a whole. Some resources may be used by all users of the grid, while others may have specific restrictions [2]
Grid computing involves an evolving set of open standards for Web services and interfaces that make services, or computing resources, available over the Internet.
Very often grid technologies are used on homogeneous clusters, and they can add value on those clusters by assisting, for example, with scheduling or provisioning of the resources in the cluster.
[image:2.595.315.542.160.283.2]Figure 3 illustrate Grid architecture which has six layers as follows: [3] [4]
Fig. 3: Classic Grid Architecture
1. Grid applications
2. Grid programming environments and tools 3. User-level middleware
4. Core Grid Middleware 5. Security infrastructure 6. Grid Fabric
1.5
Service Oriented Architecture (SOA)
A service-oriented architecture is basically a collection of services. These services can communicate with each other
Fig. 4: Basic SOA
In order to exchange information, the communication between these services can involve data interchange. [5]
The basic SOA shown in Figure 4 does not only represent the architecture for services [6] but so a relationship of three kinds
of participants; namely the service provider, the service discovery agency, and the service requestor (client), the interactions involve publish, find and bind operations.
2.
PROBLEM DEFINITION
The first Egyptian remote sensing satellite (Egypt sat-1) was launched to LEO in 2007 by Egyptian Space program (ESP).
In order to maintain proper satellite operation, Egyptian
a) Dedicated station b) multiple stations
Fig. 5: DRTF zone
Ground control Station was Established to monitor and control the satellite in its Orbit via DRTF and MCC. Since LEO satellites are visible for only a period of time from the point of view of an observer on earth, they can send TM data to the Ground stations only when they pass by a DRTF zone of theses ground stations as shown in Figure (5-a) Since ESP got only one ground station in Cairo, Egypt sat-1 could only be seen by DRTF four times per day. As many countries, if ESP decided to build a number of DRTF’s around the country to cover most of satellite orbits as shown in Figure (5-b). It can monitor other satellites which belong to other partners (countries, small organizations, universities) which has the same satellite series. Moreover, it will use its all hardware and software resources in the ground segment to create a new business model as (pay – per - use) to develop organization assets. According to this proposal, two problems will appear. First is how to handle the TM data for other satellites in the same series? Second is how to design a SOA for TM subsystem to introduce the TM data analysis service and how to implement it on grid computing?
This paper focuses on the second problem.
3.
PROPOSED SOLUTION
Taking the TM packet structure defined by European cooperation for space standardization (ECSS) [7] into consideration, and using modular object oriented techniques to design TM software this will make standardization in TM data handling problem and offer an application programming interface (API), which enables the software engineers to extend the system and adapt it to their project requirements.
So the following generic steps [8] could be considered to handle TM data
1. Receive the data stream from the satellite
2. Extract the individual TM frames out of the data stream.
3. Extract the raw value of every single TM data from the Frame.
4. Apply the calibration routines to retrieve the engineering value of the TM data.
5. Archive the retrieved TM data.
[image:2.595.55.277.280.451.2] [image:2.595.67.280.574.713.2]6. Visualize the values to the clients through some User Interface.
Based on this generic procedure the system architecture shown in Figure 6 has been proposed, which guaranties the highest level of flexibility and extendibility for different Satellite projects.
[image:3.595.309.559.78.301.2]MCC collects all telemetry data (TMD) for each satellite from these DRTF’s and makes them available to the partners as a service. Therefore, this research introduces a design of a
Fig. 6: proposed Architecture of MCC and DRTF
SOA for TM subsystem to introduce the TMD analysis service and to study the deployment of these services on grid computing
3.1
System Components
The system can be divided into the following core software components:
- TM database, which contains the calibrated values and definitions of all TMD. These definitions consist of information about the raw format of the data, i.e. the size in Bytes and Bits, its position in the TM frame, the calibration method to retrieve the engineering value and hard/soft limits for valid values, etc.
- Data handling engine, which establishes a connection to the database and DRTF to carry out the task Nr 2, 3, 4 and 5 of the above procedure. Upon a satellite pass it receives telemetry packages sequentially and extracts the telemetry data entities then apply the calibration and archive TMD into database (DB).
- Grid service provider (GSP) which has reporting facility for monitoring and visualization of the extracted telemetry data to telemetry clients (Task Nr 6.).
- Orbit determination package (ODPS)to propagate satellites orbits
3.2
Data Flow between System
Components
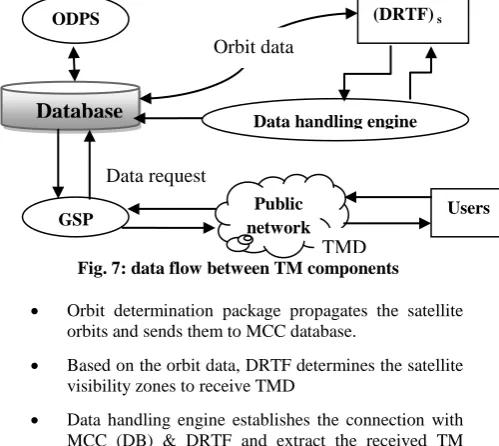
This following paragraph describes the data flow between system components as shown in Figure 7
Fig. 7: data flow between TM components
Orbit determination package propagates the satellite orbits and sends them to MCC database.
Based on the orbit data, DRTF determines the satellite visibility zones to receive TMD
Data handling engine establishes the connection with MCC (DB) & DRTF and extract the received TM packets with parameters’ calibration values then archive TMD to database.
Through public network and GSP users can access TMD after authentication.
3.3
The Suggested Techniques
Grid computing and service oriented technologies which will provide
Reduce costs Standardization
Parallel processing capability Reliability
Resource balancing
Time minimization to get results
4.
SERVICE ORIENTED
ARCHITECTURE (SOA) of TM SYSTEM
The design process of a Service-oriented model for TM system are discussed in the following subsections
4.1
Services Identification Phase
This phase has two steps as follows
4.1.1
Functional decomposition
Determination of Satellite orbits or Calculate satellite orbits using satellite two line elements then Define the DRTF zone which can track the satellite in a period of time (session) with defining its start and end time to receive TM, This function must be finished by orbit determination subsystem in MCC before satellite communication session start.
After the previous function, Telemetry system can do the following functions to provide all proposed Services:
1. Establish a connection to MCC database and to the (DRTF)
2. Extract TM packet format for each subsystem on the satellite
DRTF
DRTF
MCC
Grid
services
Public
network
User
User
Database
ODPS GSPData handling engine
Public network
(DRTF) s
Users
Data request
Orbit data
[image:3.595.49.282.178.310.2]3. Apply the calibration routines to retrieve the engineering value of the TMD.
4. Archiving TMD on DB during session
5. Authentication management.
4.1.2
Services decomposition
6. Display TM parameters in tabular format.
7. Visualize the values of parameters to the clients through some User Interface.
8. TMD analysis per defined period of time with graphs
9. TM reporting per period of time
4.2
Services Specification
From the above discussion, the proposed TM system services can be summarized as Follows:
1- packet extraction with data calibration
2- Archiving
3- Analysis with presentation
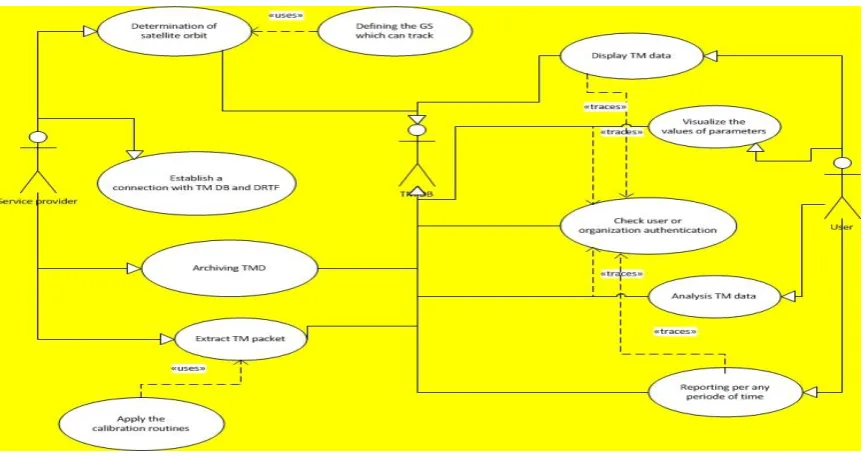
The process model of all TM functions and services can be drawn using MS Visio tool according to unified modeling language (UML) as shown in Figure 8.
[image:4.595.75.507.231.459.2]Fig. 8: UML process model for the TM functional and services decomposition
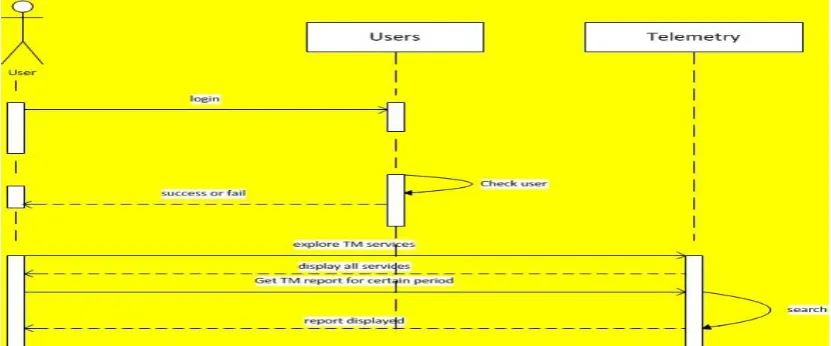
Fig. 10: UML sequence diagram for getting a service
4.3
Services Realization
As explained before there are four software components and this step will recognize the software that realizes a given services, as follows:
Orbit determination package
o Define the DRTF which can track the satellite in its zone in a period of time called session with defining its start and end time to receive TM. Data handling engine
o Establish a connection to DB and DRTF
o Extract TM packet format from TM stream (unpacking)
o Apply the calibration routines to retrieve the engineering value of the TM data.
o Archiving TMD on DB during session to make analysis or statistics
Data grid service provider
o Display TM parameters in table format.
o Visualize the values of parameters to the clients through some User Interface.
o TMD analysis per any period of time with graphs o Reporting per any period of time
TM Database
This is the main component to realize all previous services. Using MS Visio tool according to UML class diagram shown in Figure 9 shows the data model of the TM database schema
4.4
Dynamics of TM Messaging Interaction
Using MS Visio tool according to UML Figure 10 shows the sequence diagram that monitor messaging interaction flow to get a service
Sequence of actions
- Check user authentication
- Search in DB about the user data request - Display telemetry data
4.5
Proposed Service Oriented
Architecture (SOA)
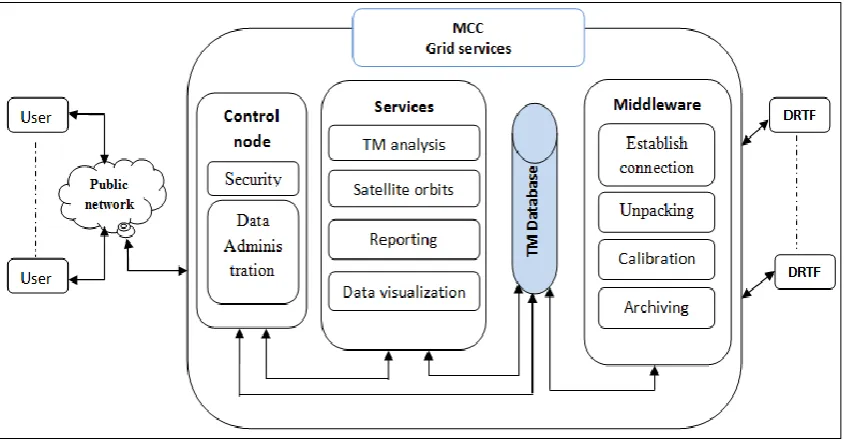
The proposed architecture has four main blocks shown in Figure 11 as follows:
Middleware (workhorse) of the grid which will establish the connection with (DRTF) during satellite communication session to extract TMD from TM packets (unpacking) with calibration of parameters values and archive it into DB.
TM database has all TM data for all satellites which was archived and definitions of all TMD; Services this block have users interface to access
any service after authentication.
Fig. 11: proposed TM (SOA)
5.
PROPOSED GRID COMPUTING
IMPLEMENTATION
5.1
Grid Topology
[image:6.595.87.515.72.292.2]Intragrid topology, as illustrated in Figure 12, will be used to provide a set of Grid services.
Fig. 12: an intragrid
TM system will be made up of a number of computers that share a common security domain, and share TM data internally on a private network and externally though the public network (internet).
5.2
Grid Computing Architecture
Grid provide protocols and services at different layers as shown in Figure 13 – (a) “hour-glass” model [9] and Figure 13 – (b) Grid protocol architecture [10].
b- grid protocol architecture
Based on this architecture, the proposed grid architecture of TM shown in Figure 14 has five layers to provide differentiating capabilities to the TM system user.
Fig. 14: TM Grid computing architecture
At the fabric layer, Grid delivers computational resources, communication facilities and data storage for the layers above.
The resource layer defines protocols for the publication, monitoring, accounting and payment of sharing operations on individual resources.
The collective layer monitors all resources to co-allocating and scheduling services.
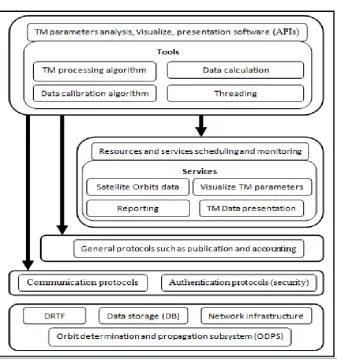
The application layer comprises of a ready to use software applications (APIs), such as TMD parameters analysis, TMD Visualization, TMD graph presentation software and tools such as data calculation, calibration and processing.
The connectivity layer defines core communication and authentication protocols for easy and secure network transactions.
6.
GRID COMPUTING SIMULATION
To provide TM services through grid computing; Figure 15 shows the needed tools.
Data storage (TM DB) This component was simulated using clustering technique to archive and
manage all TM data. Data transmission and receiving facilities (DRTF)
Networking
Platform (operating system OS)
TM data extractor software
Orbit determination and propagation subsystem (ODPS)
Control node to manage resources and clients authentication.
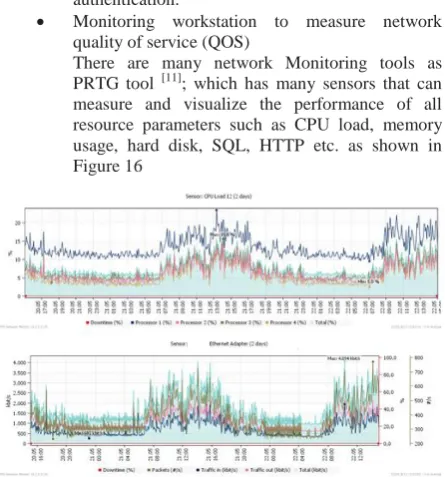
Monitoring workstation to measure network quality of service (QOS)
[image:8.595.307.551.82.418.2]There are many network Monitoring tools as PRTG tool [11]; which has many sensors that can measure and visualize the performance of all resource parameters such as CPU load, memory usage, hard disk, SQL, HTTP etc. as shown in Figure 16
Fig. 16: PRTG network monitoring tool
6.1
Grid Computing Services Performance
Parameters Simulation
Using OPNET network simulation tool the following services performance parameters was measured
FTP service which contain TM data and files transfer.
HTTP or web service Database service Servers Load
Table 1 contains simulation data which will be illustrated in Figure 17
Table 1: simulation data
Simulation parameter Value
Protocol TCP
Number of subnets (4) - one for servers and three for clients
Internal subnets links 100 base T
External links PPP-DS3
Internet IP32_cloud
Number of servers (3) - DB , HTTP and FTP each one contains single processor
Number of applications Three - (FTP,HTTP and database )
each client can access all applications in serial order HTTP application Heavy browsing
[image:8.595.58.281.110.349.2]Database application High access
Fig. 17: main scenario configurations and FTP application parameters table
6.1.1
The relation between link background
utilization and other performance parameters
By modifying PPP_DS3 link background utilization between server’s subnet and IP32_cloud in scenario (2) as shown in Figure18
Fig. 18: Background utilization
Note: Point to point throughput will be changing according to utilization values as HTTP server performance load will increase as shown in Figure 19
2
1
1
[image:8.595.319.540.509.578.2]Fig. 19: results comparing scenario (1) & (2)
6.1.2
The relation between number of clients and
other performance parameters
By increasing the number of clients in each subnet from one (10base LAN has 10 clients) in scenario (1) to three (10base LAN has 10 clients) in each subnet in scenario (3), each client can access all applications (FTP, HTTP and database) in serial operation mode.
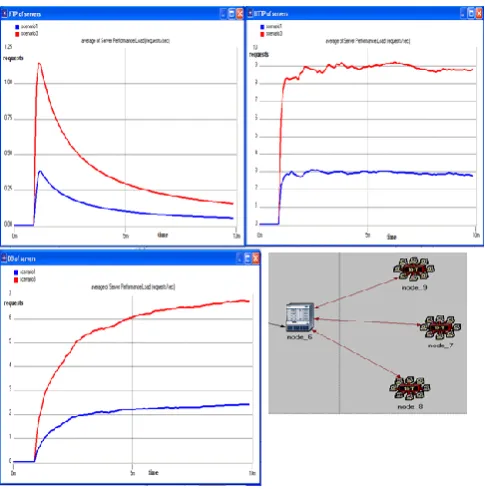
Note : DB , FTP , and HTTP servers load will increase as shown in Figure (20)
Fig. 20: results comparing scenario (1) & (3)
6.1.3
The relation between servers enhancementand other performance parameters
Enhancing DB, HTTP and FTP servers performance by increasing the number of processors to three processors in scenario (4) instead of single processor in scenario (3)
[image:9.595.318.565.182.434.2]Note: Task processing time in DB, HTTP and FTP servers will decrease as shown in Figure 21
Fig. 21: results comparing scenario (3) & (4)
7.
COMPARATIVE STUDY
Remote sensing satellite TM data has been implemented on cloud computing in our previous work [12] and in the following paragraph, we are going to present a comparative study of grid model presented in this paper to that of cloud model. Compared to cloud model, grid model introduces a difference concerning the following measures:
Business Model - In a cloud model, a customer will pay to the provider on a consumption basis,
The business model For Grid is project-oriented in which the users or community has certain number of service units (i.e. CPU hours) they can spend
Maintainability – cloud model increased maintainability over grid model by definition of standardized requirements
Interoperability – cloud model increased interoperability over grid model by standardized service and data models
SOA – grid model has control node and middleware (cloud model does not)
[image:9.595.46.289.497.742.2]1) It is massively scalable,
2) Can be encapsulated as an abstract entity that Delivers different levels of services to Customers outside the Cloud, 3) It is driven by economies of scale
4) The services can be dynamically configured And delivered on demand
8.
CONCLUSION
Implementing the same case study (satellite telemetry data (TMD)) on grid computing after implementation on cloud was a very good idea to illustrate the main factors to the surge and interests in Cloud Computing:
1) rapid decrease in hardware cost and increase in computing power and storage capacity, and the advent of multi-core architecture and modern supercomputers consisting of hundreds of thousands of cores;
2)
The exponentially growing data size in scientific instrumentation/simulation can be deployed as a service to the clients with substantial scalability and elasticity.Moreover, Simulation results were collected using OPNET for studying the performance of the grid based on the network protocol as TCP; Network utilization and task processing time.
On the application level, simulation results that affect grid performance were also collected such as link background utilization, the number of clients and the number of processors. To show the added values of this research, a comparative study with a similar work done by (cloud computing implementation) was also introduced.
9.
REFERENCES
[1] Yu Du , “A Satellite Ground Station Control System” , Technical University of Denmark , Informatics and Mathematical Modeling , Lyngby 21 October 2005 IMM-THESIS-2005-86, pp. 17 ,18,26,27,34
[2] Luis Ferreira, Fabiano Lucchese,Tomoari Yasuda, Chin Yau Lee,Carlos ,Alexandre Queiroz,Elton Minetto,
Antonio Mungioli “Grid Computing in Research and Education” , IBM red book , April 2005
[3] Eero Vainikko, Satish Narayana Srirama,” Basics of Grid and Cloud Computing” , University of Tartu, Institute of Computer Science , 2011/12 Spring (http://courses.cs.ut.ee/2012/cloud)
[4] Bart Jacob , Michael Brown , Kentaro Fukui , Nihar Trivedi , “Introduction to Grid Computing” , IBM red book , 2005
[5] Asadullah Shaikh , Muniba Memon, Nasrullah Memon, Muhammad Misbahuddin , “The Role of Service Oriented Architecture in Telemedicine Healthcare System” , IEEE DOI 10.1109/CISIS.2009
[6] Mike P. Papazoglou , “ Service -Oriented Computing: Concepts, Characteristics and Directions “ , Proceedings of the Fourth International Conference on Web Information Systems Engineering (WISE’03) , PP. 3 , VOL 0-7695-1999-7/03 $17.00 , 2003 IEEE
[7] European cooperation for space standardization (ECSS) “Ground systems and operations Telemetry and telecommand packet utilization ” , ECSS – E- 70-41A , 30 January 2003
[8] MehranSarkarati, Keplerlaan , Noordwijk ZH, "A WEB-BASED MODULAR AND FLEXIBLE DATA ACQUISITION AND TELEMETRY MONITORING SYSTEMFOR MICRO SATELLITES “
[9] Robert van Engelen , “ Concepts and Architecture of Grid Computing” , 2008
[10] Ian Foster, Yong Zhao, Ioan Raicu, Shiyong Lu “Cloud Computing and Grid Computing 360-Degree Compared”
[11] http://www.paessler.com/blog/2013/05/27/prtg/similar-sensors-analysis
![Figure 3 illustrate Grid architecture which has six layers as follows: [3] [4]](https://thumb-us.123doks.com/thumbv2/123dok_us/8065770.777806/2.595.67.280.574.713/figure-illustrate-grid-architecture-layers-follows.webp)