http://dx.doi.org/10.4236/jcc.2015.311013
Enhancement of Process Capability for the
Vision-Guided Robot
Yongjin (James) Kwon
Department of Industrial Engineering, Ajou University, Suwon, South Korea
Received October 2015
Abstract
This study addresses a critical problem in the control of process capability as to the positioning accuracy of vision-guided robot. Depending on the calibration accuracy, the process capability va-ries widely, which renders the precise control of assembly tasks difficult. Furthermore, some vi-sion sensors prohibit the programming access to rectify the lens distortion effects, which even complicates the problem. This study proposes a method of circumventing the lack of programming access by implementing the lens optical center alignment. Three different calibration methods are compared as to the process capability, and the proposed method shows a very good accuracy. The method can be easily adopted on the shop floor since it doesn’t require a complex setup and ma-thematical derivation process. Therefore, the practitioners can benefit from the proposed method, while maintaining a high level of precision in terms of robot positioning accuracy.
Keywords
Process Capability, Assembly Robot, Vision Calibration, Positioning Accuracy
1. Introduction
be linear, if a lens distortion is minimal. On the contrary, the lines are curved, and the vertical and horizontal distortions appear to be different. The distortion seems to be magnified towards the corner areas, while the im-age center exhibits less distortion. The extent of lens distortion is evident.
In this context, this study addresses critical aspects of vision calibration in order to improve the positioning accuracy, which in turn affects the process capability of the robotic operations. To minimize the lens distortion effects without the use of image processing functions, the optical center of the vision sensor is aligned with the target centers. The alignment process is composed in the form of a robot program that can be quickly adopted and reused by other robots. Due to automated alignment, the fast and accurate outcome is entailed. This ap-proach significantly improves the positional accuracy, when compared to other methods tested in this study. The proposed method doesn’t require complex mathematical derivations or expensive measuring instruments. The calibration pattern is customized for our application, which is simple and easily duplicable on the shop floor. Therefore, the approach presented in this study can be better suited for today’s production environment, where a dynamically changing marketplace dictates a rapid changeover as well as a frequent vision calibration.
2. Descriptions on iVY and Single Scale-Factor Calibration
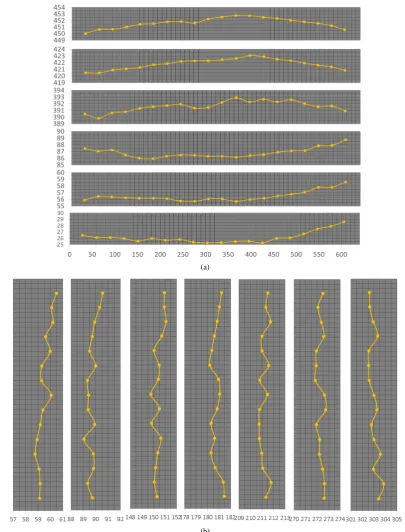
[image:2.595.174.454.486.702.2]This section provides a detailed description for two different calibration methods, and compares the positioning accuracy. The first test is carried out using the iVY Studio calibration function provided by the manufacturer, which utilizes only two random points. We designed a pattern with 13 objects and the errors are measured. When the objects are positioned at the center, the calibration error is the smallest. The fluctuation between the points seems excessive. For Channel 2, the errors fluctuate even more. If the target objects are moved farther to the corner areas, the errors grow larger along with the fluctuation. The iVY Studio calibration only concerns two pixel points, which cannot adequately encompass the whole FOV, hence the positioning accuracy is likely to
(a)
[image:3.595.107.513.82.615.2](b)
Figure 2. Image distortion from the Channel 2 camera. (a) Along a horizontal direction; (b) Along a vertical direction.
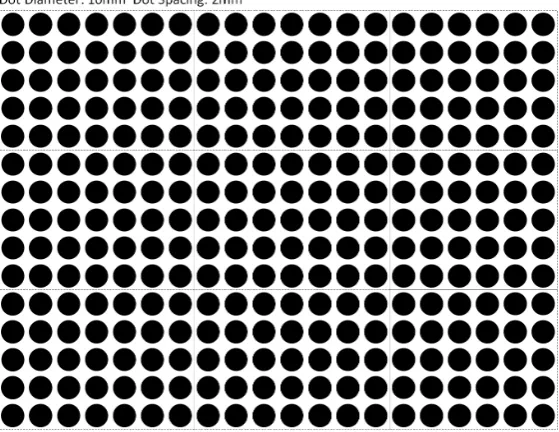
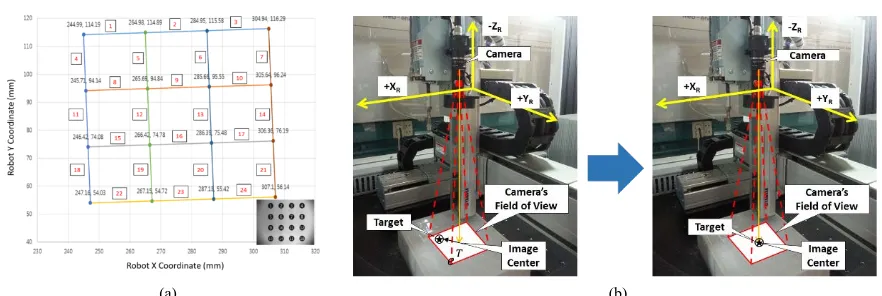
im-The automatic alignment is regarded as a substitute for image corrections. im-The Jacobian is adopted from Wata-nabe et al. [4]. The accuracy is tested first using a custom-designed pattern, consisting of 16 solid dots on a piece of white paper. The dot diameter is 10 mm with the dot spacing of 20 mm. Solid dots are used for the test, because of its robustness in image segmentation. The overall size fits the Channel 1 FOV. The optical center is set as (320, 240), and aligned with the center pixels of each dot. When two centers coincide below the pre-set threshold of 0.1 pixel, the robot coordinates are recorded. Our test shows that the accuracy doesn’t improve no-ticeably below this value. In Figure 4(a), the dot center coordinates are connected, and a total of 24 line seg-ments is identified. It should be noted that the lines are slightly slanted in reference to the robot axes. The pat-tern is placed under the camera without the use of measuring instruments, in order to simulate a shop floor en-vironment. The accuracy is tested by calculating the gradient and length for each line segment. The results show a very little variation among the numbers. Figure 4(b) graphically illustrates the alignment process. This study differs from Watanabe et al. [4]. Once the alignment is complete, a line pattern is constructed, which is referred to as Grid Map. Its main purpose is to rectify the lens distortion. By connecting the centers of adjacent target
[image:4.595.90.540.369.544.2](a) (b)
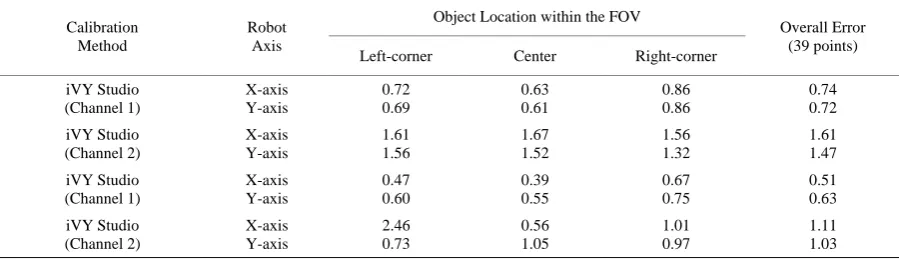
Figure 3. The calibration errors of both cameras using a single scale-factor. (a) Robot X-axis errors; (b) Robot Y-axis errors.
Table 1. Average errors (mm) along the robot X and Y-axis.
Calibration Method
Robot Axis
Object Location within the FOV
Overall Error (39 points)
Left-corner Center Right-corner
[image:4.595.88.538.592.722.2][image:5.595.93.534.80.228.2]
(a) (b)
Figure 4. Alignment pattern and the robot sequence. (a) The inlet showing the test pattern image; (b) The alignment
( )
Te
process.
objects, a set of equilateral triangles can be delineated. We calculate the scale factors for each triangle and cali-brate the robot in accordance with the triangle that the robot is positioned within.
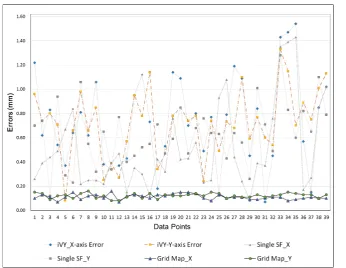
When the optical center is aligned with each target object, an image distortion becomes negligible. This can be viewed as the straightening of curved lines. Since it contains very little distortion, the subsequent vision guidance becomes much more accurate with the Grid Map (see Figure 5).
4. Experimental Verification
The proposed method effectively rectifies the distortion problem. In terms of standard deviation, the method significantly reduces the spread of data points. The scale factor method is only able to reduce slightly for the Y-axis, yet the X directional spread even increases by 5%. In Tables 2 and Table 3, the process capability (Cp) analysis is presented. As the average calibration errors shift towards the left (to zero), the calibration positioning accuracy improves. It should be noted that the Cp values represent the capability of the process in terms of error reduction, without regard to the mean shift (Cpk). The Cp is given as following Equation (1) [5]:
[
–]
/ 6p
C = USL LSP σ (1)
where σ = a standard deviation of positioning errors, USL (upper specification limit) = 4 mm, LSL (lower specification limit) = 0 mm, and the average (µ) = 2 mm. It explains that the average positioning error centers around at 2 mm, while the range of positioning errors = [0, 4 mm], which seems inadequate for most precision assembly tasks. Even so, the Channel 2 camera with the scale factor method as well as the iVY Studio method can barely satisfy this range.
With the calibration data, the robot’s positioning error is reassessed in terms of range values. The notion of worst case (WC) approach in tolerance stack-up is employed, which stipulates that all tolerances simultaneously occur at their worst limits [6]. This is a highly pessimistic analysis by adding up absolute values of the tolerance [7]. It is expressed as Equation (2):
: ASM i
WC T = ΣT (2)
where TASM= a sum of assembly tolerance, Ti = a tolerance of each component, and i = a component number. The range of positioning errors resides in an interval [0.046 mm, 0.178 mm] along the robot X-axis, and [0.063 mm, 0.181 mm] along the robot Y-axis, with the probability of 99.73%. This range should be simultaneously considered with the robot’s own repeatability. In worst cases like Equation (2), the positioning errors can be in-flated to [0.046 mm, 0.198 mm], and [0.063 mm, 0.221 mm] for X and Y-axis, respectively. Given the robot’s worst repeatability ranges including the calibration errors, the production engineer can accurately assess the ro-bot’s positioning capability, which in turn may substantially reduce the chance of producing defective products. Table 4 compares the improvement of positioning errors in tune with the process capability numbers.
5. Conclusion
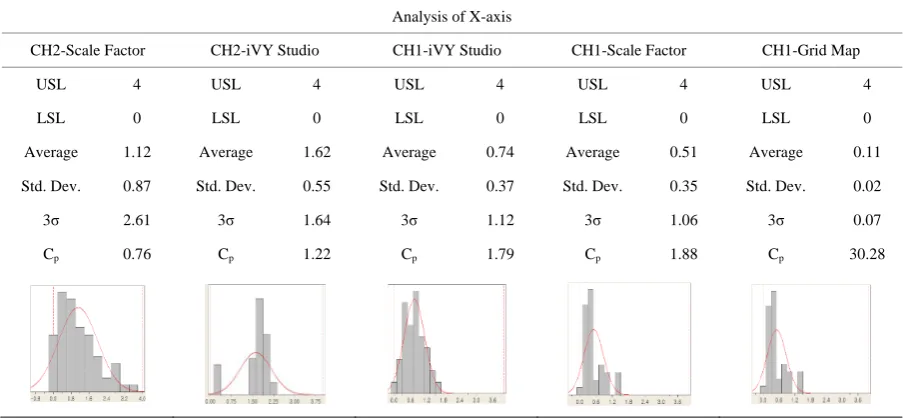
3σ 2.61 3σ 1.64 3σ 1.12 3σ 1.06 3σ 0.07
[image:6.595.87.539.102.311.2]Cp 0.76 Cp 1.22 Cp 1.79 Cp 1.88 Cp 30.28
Table 3. Comparison of process capability for robot Y-axis.
Analysis of X-axis
CH2-Scale Factor CH2-iVY Studio CH1-iVY Studio CH1-Scale Factor CH1-Grid Map
USL 4 USL 4 USL 4 USL 4 USL 4
LSL 0 LSL 0 LSL 0 LSL 0 LSL 0
Average 1.03 Average 1.46 Average 0.72 Average 0.63 Average 0.12
Std. Dev. 0.70 Std. Dev. 0.55 Std. Dev. 0.27 Std. Dev. 0.25 Std. Dev. 0.02
3σ 2.10 3σ 1.63 3σ 0.82 3σ 0.74 3σ 0.06
Cp 0.95 Cp 1.22 Cp 2.44 Cp 2.70 Cp 33.80
Table 4. Comparison of process capability improvement.
Calibration
Method Robot Axis Process Capability Improvement
Scale Factor (Channel 2)
X-axis Y-axis
0.76 0.95
N/A N/A
iVY Studio (Channel 2)
X-axis Y-axis
1.22 1.22
61% 28%
iVY Studio (Channel 1)
X-axis Y-axis
1.79 2.44
136% 157%
Scale Factor (Channel 1)
X-axis Y-axis
1.88 2.70
147% 184%
Grid Map (Channel 1)
X-axis Y-axis
30.28 33.80
[image:6.595.89.542.339.558.2] [image:6.595.89.538.587.720.2]Figure 5. Robot positioning errors due to calibration (Channel 1).
sion-guided robot. Depending on the calibration accuracy, the process capability varies widely, which renders the precise control of assembly tasks difficulty. Furthermore, some vision sensors prohibit the programming access to rectify the lens distortion effects, which even complicates the problem. This study proposes a method of circumventing the lack of programming access by implementing the lens optical center alignment. Three dif-ferent calibration methods are compared as to the process capability, and the proposed method shows a very good accuracy. The method can be easily adopted on the shop floor since it doesn’t require a complex setup and mathematical derivation process. Therefore, the practitioners can benefit from the proposed method, while maintaining a high level of precision in terms of robot positioning accuracy.
Acknowledgements
This research was supported by the Basic Science Research Program through the National Research Foundation (NRF), funded by the Ministry of Education, Republic of Korea (Grant No. NRF-2013R1A1A2006108). The authors wish to express sincere gratitude for the financial support.
References
[1] Kwon, Y. and Park, Y. (2013) Improvement of Vision Guided Robotic Accuracy Using Kalman Filter. Journal of Computers & Industrial Engineering, 65, 148-155.http://dx.doi.org/10.1016/j.cie.2011.11.018
[2] Oitzman, M. and Campbell, J. (2000) High Accuracy Positioning System Implements Robotic Applications with Guaran-teed Placement Accuracy. Journal of Industrial Robot, 27, 274-278.http://dx.doi.org/10.1108/01439910010372091
[3] iVY System User’s Manual (2012) Yamaha Robot Vision System, Shizuoka, Japan.
[4] Watanabe, A., Sakakibara, S., Ban, K., Yamada, M. and Shen, G. (2005) Autonomous Visual Measurement for Accu-rate Setting of Workpieces in Robotic Cells. CIRP Annals—Manufacturing Technology, 54, 13-18.
http://dx.doi.org/10.1016/S0007-8506(07)60039-0
[5] Montgomery, D.C. (2005) Introduction to Statistical Quality Control. John Wiley & Sons, Inc., Hoboken.
[6] Pawar, S. and Chavan, H. (2011) Tolerance Stack up Analysis and Simulation Using Visualization VSA. Journal of Advanced Engineering Technology, 2, 169-175.