Bing Zhang1,2,3, Jing Zhang2,1, and Takafumi Yoshida1
1Northwest Pacific Region Environmental Cooperation Center, 930-0856, Toyama, Japan
2Earth and Environmental System, Graduate School of Science and Engineering, University of Toyama, 930-8555,
Toyama, Japan
3Tianjin Key Laboratory of Water Resources and Environment, Tianjin Normal University, 300387, Tianjin, China
Correspondence to:Jing Zhang ([email protected]) Received: 12 March 2017 – Discussion started: 14 March 2017
Revised: 6 June 2017 – Accepted: 6 June 2017 – Published: 11 July 2017
Abstract.Fresh submarine groundwater discharge (SGD) is the key pathway of flux and nutrients for the groundwater from land to the ocean. SGD flux is a current issue of discus-sion and a means to clarify the coastal marine system under climate change. SGD flux accounts for about one-quarter of the river runoff in the Katakai alluvial fan in Uozu, Toyama, Japan, which is an ideal area to study SGD flux considering the need for a rapid response to climate change and the prior research on SGD there. In this paper, the monthly groundwa-ter table’s condition over 30 years is analyzed using monthly rainfall, snowfall, and the climate change index. Rainfall has been on an upward trend, but the snowfall has decreased over 40 years. Furthermore, the groundwater table at mon-itoring wells in the coastal area increased, as a result of the increased rainfall. However, the relationship between snow-fall and groundwater is negative. As expected by Darcy’s law, SGD flux was controlled by the hydraulic gradient of the coastal groundwater. The estimated historic SGD flux by groundwater table variation shows an upward trend of SGD. Considering the increase in precipitation and the groundwa-ter table, SGD flux may increase under climate change.
1 Introduction
Fresh submarine groundwater discharge (SGD) is the di-rect flow of groundwater into the ocean. The groundwater flows down a gradient, and SGD occurs wherever a coastal aquifer is connected to the sea (Chen et al., 2005; Zhang and Mandal, 2012). SGD has been recognized as not only an important source of freshwater discharge into the ocean, but also a valuable component of the hydrological cycle be-tween the terrestrial groundwater system and the marine en-vironment (Church, 1996; Taniguchi et al., 2002; Hatta and Zhang, 2013; Liu et al., 2014). The estimation of global SGD varies from 0.2 to 10 % of the river flow (Burnnet et al., 2001). SGD may be both volumetrically and chemically im-portant to coastal water and chemical budgets (Taniguchi et al., 2002). Thus, an accurate estimate of SGD flux is essential to predict future coastal environments under climate change conditions.
Figure 1.Locations of groundwater wells in the Katakai River alluvial fan.
source of the freshwater is the precipitation in the Toyama region. Furthermore, this area has shown a rapid response to climate change, with a recent reduction in the year-round snow extent on the top of nearby mountains, which is shown here to affect SGD flux into the coastal environment (Hatta and Zhang, 2013).
Groundwater is the linkage between precipitation and SGD. In this paper, we describe the temporal variations in the monthly groundwater table, rainfall, and snow from 1985 to 2015. Furthermore, we analyzed the relationship between rainfall, snowfall, and El Niño and La Niña events. The re-lation between SGD flux and the groundwater table was also studied. Finally, we discuss the impact of climate change on rainfall, the coastal groundwater system, and SGD.
2 Study area
2.1 Study site description
Toyama Bay, a semi-enclosed bay in central Japan, connects to the Sea of Japan at its northern boundary. There is buried forest and submarine groundwater seepage off Uozu, on the eastern side of Toyama Bay (Zhang and Satake, 2003). The Katakai River alluvial fan is located at Uozu, Toyama prefec-ture (Fig. 1). The SGD area of the Katakai River alluvial fan occurs 150–200 m seaward of the coastline at water depths of 8 and 22 m. The average fluxes were 0.8–1.3 L min−1m−2at 8 m and 0.5–0.8 L min−1m−2at 22 m from April to Decem-ber 2003 (Zhang et al., 2005).
The Katakai River alluvial fan is a coastal well-watered fan into which the Katakai River is deposited. The total area of the Katakai River catchment is 169 km2. The length of the
main river is 27 km from the water source in the Kekachi Mountains (2414 m). The average slope of the Katakai River bed is 8.5 %, which is the most steeply sloped river of the seven rivers in Japan. The average flux of the Katakai River is 10.2 m3s−1. Annual precipitation is 2500 mm in Uozu, and it is about 4000 mm in the mountainous area. The annual av-erage temperature is 14◦C. The annual potential evapotran-spiration is 765 mm.
2.2 Hydrogeology setting
Linear regression between groundwater table (y) and month (x).
3 Methods 3.1 Data source
The groundwater table monitoring data (from 1985 to 2015) were obtained from the Water Information Database, Uozu, Toyama Prefecture, Japan. The precipitation data (from 1976 to 2015) and historical El Niño/La Niña events were obtained from the website of the Japan Meteorological Agency (http: //www.jma.go.jp/jma/index.html). The Oceanic Niño Index (ONI) was from the Center for Weather and Climate Predic-tion (CPC), NaPredic-tional Oceanic and Atmospheric Administra-tion (NOAA), U.S. Department of Commerce. The ONI val-ues are calculated by the monthly Niño 3.4 index. The sta-tistical characteristics and linear regression of the monthly groundwater table, rainfall and snowfall were analyzed by SPSS software.
3.2 Analytical methods
Wavelet transforms are a very powerful tool in which to analyze non-stationary signals. It allows for the identifica-tion of the main periodicity in a time series and the evolu-tion at the time of each frequency (Liang et al., 2011). The cross wavelet transform is used to examine relationships in time frequency space between two time series (Labat, 2010). Phase angle statistics can be used to gain confidence in causal relationships between the time series (Grinsted et al., 2004; Zhang and Wang, 2016).
The methods of continuous wavelet transform (CWT) and cross wavelet transform (XWT) provide the basis for wavelet coherence analysis (Grinsted et al., 2004). The wavelet co-herence (WTC) of two time series was defined as
Rn2(s)=
S(s−1WnXY(s)) 2
S(s−1 WnX(s)
2
)·S(s−1 WnY(s)
2
)
, (1)
whereS is a smoothing operator. The wavelet coherence is a localized correlation coefficient in time frequency space
(Grinsted et al., 2004). The arrows→ and← in the WTC figures indicate the positive and negative relationships be-tween two time series, respectively. Meanwhile, the arrows↓ and↑show that time series 1 is a one-quarter period earlier and later, respectively, than time series 2 (Zhang and Wang, 2016).
4 Results
4.1 Groundwater table variation
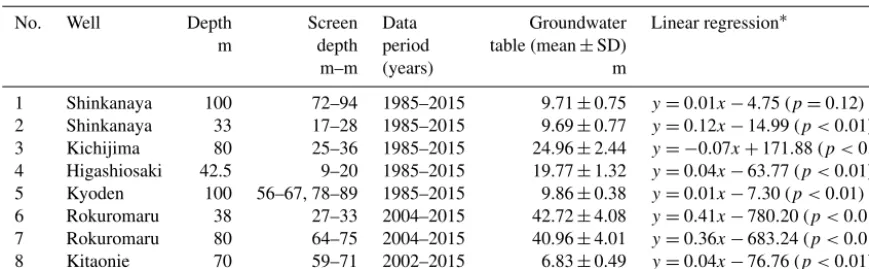
There are six groundwater monitoring sites, including eight monitoring wells in the Katakai River alluvial fan (Table 1). The average groundwater table decreased from the moun-tain area to the coastal plain area; the groundwater table of Rokuromaru is the highest, with average values of 42.72 and 40.96 m, respectively. The groundwater of Kichijima (24.96 m) is the second highest, followed by that of Higash-iosaki (19.77 m). The groundwater tables of Shinkanaya and Kyoden are about 10 m. The groundwater level of Kitaonie, which is the nearest to Toyama Bay, is the lowest (6.83 m). The range variations of Rokuromaru and Kichijima are the largest, while that of Kyoden is the smallest. The standard deviation of shallow groundwater is larger than the deep groundwater at the same site.
The groundwater table trends of the monitoring wells are similar (Fig. 2). Linear regression was applied to analyze the trends of the groundwater variation. The standardized coef-ficients of most groundwater wells are significantly positive, indicating an increase in groundwater table (Table 1). How-ever, the groundwater table of Kichijima may decline, since the standardized coefficient is significantly negative. 4.2 Rainfall and snowfall variations
[image:3.612.78.513.85.219.2]Figure 2.Monthly groundwater table, rainfall, and snowfall from 1985 to 2014(a), and from 2010 to 2014(b).
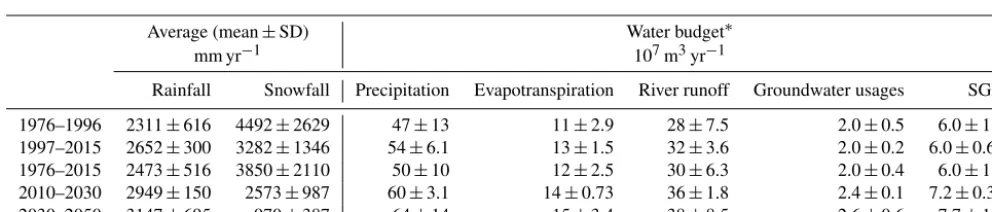
Table 2.Description and prediction of rainfall, snow, and the water budget.
Average (mean±SD) Water budget∗
mm yr−1 107m3yr−1
Rainfall Snowfall Precipitation Evapotranspiration River runoff Groundwater usages SGD
1976–1996 2311±616 4492±2629 47±13 11±2.9 28±7.5 2.0±0.5 6.0±1.6 1997–2015 2652±300 3282±1346 54±6.1 13±1.5 32±3.6 2.0±0.2 6.0±0.68 1976–2015 2473±516 3850±2110 50±10 12±2.5 30±6.3 2.0±0.4 6.0±1.2 2010–2030 2949±150 2573±987 60±3.1 14±0.73 36±1.8 2.4±0.1 7.2±0.37 2030–2050 3147±695 970±387 64±14 15±3.4 38±8.5 2.6±0.6 7.7±1.7
∗Water budget is calculated by percentage of evapotranspiration (24 %), river runoff (60 %), groundwater usages (4 %), and submarine groundwater discharge (SGD, 12 %) to
precipitation from 1976 to 2015 in Uozu.
decreased by 26.94 % over the past 20 years, compared to the 20 years from 1976 to 1996. The linear regression of annual rainfall is y=18.322x−34088.74 (p <0.01), in-dicating increased rainfall in the future. However, the an-nual snowfall amount decreased, with a linear regression of
y= −6.712x+13792.71 (p <0.05). Furthermore, the per-centage of snow in total precipitation was 19.44 % from 1976 to 1996, and this declined to 12.38 % from 1997 to 2015. 4.3 Relationship between rainfall, snowfall, and
groundwater
The groundwater table in summer (June to August) is the highest, while the groundwater table in early spring (March to May) is the lowest (Fig. 2a, b). The groundwater table de-clined sharply during winter, especially after snowfall. The groundwater table is the lowest 1 or 2 months after the end of snowfall. Comparing the peaks of rainfall and the ground-water table, the rainfall in August 2010 was the largest, and the highest groundwater table occurred 2 months later. The groundwater table also increased to its peak 2 months af-ter the peak rainfall in December 2012 and August 2013 (Fig. 2b).
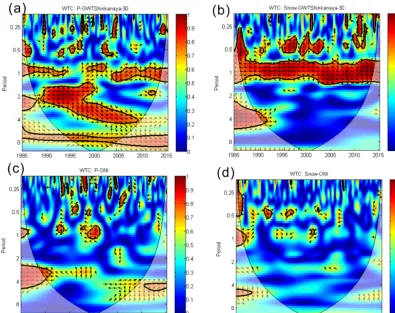
The relationships among rainfall, snowfall, and ground-water table were analyzed by wavelet coherence. Taking the Shinkanaya (30 m) monitoring well as an example, the re-lationship between groundwater table and rainfall was posi-tive from 1990 to 2010, with a period of 2–4 years (Fig. 3a), while the groundwater lagged behind by about a quarter year from 1985 to 1995, 1998 to 2002, and 2003 to 2015, with a 1-year period. However, the groundwater table is negatively correlated with snowfall from 1985 to 2015, with a 1-year pe-riod (Fig. 3b). This result coincides with that in Fig. 2b. The groundwater table decreased when snowfall began in winter. 4.4 Relationships among rainfall, snowfall, and climate
change index
[image:4.612.50.546.283.389.2]Figure 3.Squared wavelet coherence between rainfall and groundwater table(a), snowfall and groundwater table(b), rainfall and the ONI(c), and snowfall and the ONI(d).
For the analysis of the relationship between climate change and rainfall, snowfall is the basis used to determine the impact of climate change on groundwater. We used the Oceanic Niño Index (ONI) to estimate the climate changes associated with the El Niño and La Niña events.
There were six El Niño and six La Niña events from 1985 to 2015 (Fig. 4). The seasonal rainfall and snowfall during El Niño events were 642 mm and 155 cm, and those during La Niña events were 635 mm and 157 cm, respectively. The ratios of snowfall and rainfall during El Niño and La Niña events were 1.17 and 1.39, respectively. The most extreme El Niño event was from spring 1997 to spring 1998 (ONI=2.3). The most extreme La Niña events occurred during spring 1988 to spring 1989 (ONI= −1.7). The La Niña events may have caused more snowfall and more extreme monthly snow-fall than El Niño.
4.5 Relationship between groundwater and SGD
The submarine groundwater discharge off Uozu is controlled by the potential of the geomorphologic gradient (Zhang and Satake, 2003). Darcy’s law describes the water flow through a porous medium (sand). The groundwater aquifer in Uozu is sand. Thus, according to Darcy’s law, the groundwater flow
rate is correlated with the hydraulic gradient (Mulligan and Charette, 2006). The SGD flux is positive for the groundwa-ter table. Using the monitoring SGD flux over April to Au-gust 2003 (Zhang et al., 2005), we established the relation-ship between monthly SGD flux (y, m month−1) and ground-water variation (x, m month−1).
Here,x is the summarized daily groundwater table varia-tion (daily groundwater table above 5.5 m).
Figure 4.Rainfall (P), snowfall (Snow), Oceanic Niño Index (ONI), and El Niño and La Niña events.
easy to determine, the fresh SGD flux could be estimated by Eqs. (2) and (3) in the coastal sand aquifer.
5 Discussion
5.1 Impact of climate change on rainfall
The annual precipitation at Uozu, Toyama prefecture, is about 2500 mm, and it is in an increasing trend. The pre-cipitation is 1.52 times the mean prepre-cipitation (1634 mm) in Japan (Xu et al., 2003). This high precipitation is caused by high seawater temperature, which is maintained by the warm Tsushima current moving at 2.6 million m3s−1 from
the southwest to the northeast along the Japan Sea coast (Zhang and Satake, 2003). The cold northwesterly wind gath-ers much water vapor from the Sea of Japan, bringing heavy snow to the Sea of Japan side (Kawase et al., 2013). Fur-thermore, the precipitation patterns are dominated by shifts as sea-surface temperatures change, e.g., El Niño and La Niña (Trenberth, 2011). Climate change, with warming con-ditions and increased moisture, may produce more intense precipitation events. More precipitation occurs as rain in-stead of snow, and snow melts earlier (Emori, 2005; Tren-berth, 2011; Fischer and Knutti, 2015). The impact of cli-mate change on precipitation is changing the precipitation amount and type, causing an increase in precipitation (about 0.1 to 24.5 mm decade−1) (Wang et al., 2017) and a decrease
[image:6.612.314.542.65.223.2]in snow at Toyama. The annual precipitation may increase to about 3000 mm by 2030; and annual snowfall will decrease to less than 1000 mm by 2050 (Table 2). Moreover, the El Niño and La Niña events influence regional anomalous cir-culation features (Leung et al., 2017) and the frequency of extreme precipitation.
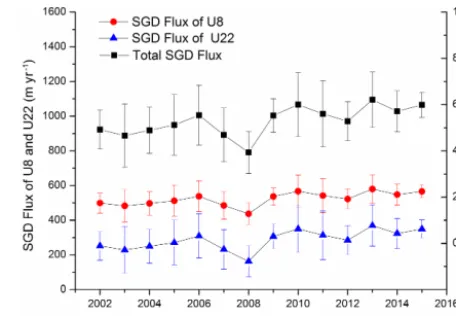
Figure 5.Estimated SGD flux by groundwater table.
5.2 Implication for coastal groundwater systems The groundwater table variation is not only determined by precipitation, but also by human activities. The utilization of snowmelt for groundwater may cause the lowest groundwa-ter table in wingroundwa-ter at Uozu (Kokusai Kogyo Co. Ltd., 2002). Moreover, climate change in combination with increased an-thropogenic activities will affect coastal groundwater sys-tems (Oude Essink et al., 2010). In a warmer world, less winter precipitation falls as snow, and the melting of winter snow occurs earlier in spring. Meanwhile, much of the winter runoff will immediately be lost to the oceans (Barnett et al., 2005). Furthermore, the groundwater extraction may cause groundwater depletion. The contribution of groundwater de-pletion to global sea-level rise amounted to 0.27 mm yr−1in 2000 (Wada et al., 2016). The impact of groundwater ex-traction on coastal aquifers was more significant than the impact of sea-level rise on groundwater recharge (Fergu-son and Glee(Fergu-son, 2012). Due to the increased precipitation, the groundwater recharge amount increased in Uozu. With snowfall decreasing, the portion of groundwater provided by snowmelt may decline. Furthermore, the El Niño and La Niña events change the groundwater table pattern. The El Niño events increase the groundwater table in winter, while the La Niña events increase the groundwater table sharply in summer (Fig. 2). Under climate change and the influence of human activities (Han et al., 2016), the groundwater table may increase with an irregular pattern in the future.
highly permeable Holocene and Pleistocene layers (Kokusai Kogyo Co. Ltd., 2002; Oude Essink et al., 2010). The av-erage concentration of NO−3 in fresh SGD (0.69 mg L−1) is
larger than riverine input (0.18 mg L−1) (Hatta and Zhang, 2013). The estimated SGD flux is described in Table 2 and Fig. 5. The SGD flux increases over 3 decades; the dissolved inorganic nitrogen (DIN) flux in the SGD to Toyama Bay may increase. Thus, the submarine groundwater discharge is a significant source of nutrition, more than river water, to the coastal marine ecosystem of Toyama Bay (Zhang and Satake, 2003; Lee et al., 2010).
Moreover, SGD flux may affect the availability of plank-tonic food for fish larvae. Fish production appears to be con-trolled by the climatic factors governing the processes in up-welling systems (Walther et al., 2002). Due to the increased precipitation and groundwater table, SGD flux may increase under climate change in the future. However, the annual SGD flux may be around 7×10⁷ and 8×10⁷m3 by 2030 and 2050, respectively (Table 2), as a result of the increase in the groundwater table (Table 3). The increased amount of SGD is less than river runoff, since most increased precipitation changes into river runoff to the ocean.
6 Conclusions
Groundwater table, rainfall, and snowfall datasets from 1985 to 2015 were collected to analyze their variations. The rela-tionships among groundwater table, rainfall, snow, and cli-mate change events were analyzed by wavelet coherence to discuss the implications for climate change. The results are summarized as follows.
1. The groundwater table is the highest in summer and the lowest in spring. The average groundwater table decreased from the mountainous area to the coastal plain area. Linear regression reflected the increase in the groundwater table in almost all monitoring wells. Rain-fall increased and snowRain-fall declined over 40 years. 2. The relationship between the groundwater table and
rainfall is positive. The groundwater tables increased
This study demonstrates that groundwater is the linkage be-tween climate change and submarine groundwater discharge with long time datasets. Due to increases in precipitation and the groundwater table, the flux of submarine groundwater discharge will increase under climate change. In addition, the quality of submarine groundwater discharge should be clarified under climate change conditions worldwide in the future.
Data availability. The groundwater table data are available in the Annual Groundwater Report (http://www.pref.toyama. jp/cms_sec/1706/kj00000960.html, last access: 3 July 2017). The Oceanic Niño Index (ONI) is shown on the web-site (http://www.cpc.ncep.noaa.gov/products/analysis_monitoring/ ensostuff/ensoyears.shtml, last access: 3 July 2017). The detailed data source is explained in Sect. 3.1.
Competing interests. The authors declare that they have no conflict of interest.
Acknowledgements. This research was supported by the Grant-in-Aid for Scientific Research on Innovative Areas grant (25110505 and 15H00973), the JSPS KAKENHI grants (JP26241009), and the Environment Research and Technology Development Fund (S-13) of the Ministry of the Environment, Japan.
Edited by: Ying Fan
Reviewed by: two anonymous referees
References
Barnett, T. P., Adam, J. C., and Lettenmaier, D. P.: Po-tential impacts of a warming climate on water avail-ability in snow-dominated regions, Nature, 438, 303–309, https://doi.org/10.1038/nature04141, 2005.
Chen, C.-T. A., Zhang, J., Peng, T.-R., and Hagiwara, T.: Ex-ploratory Sampling of Submarine Groundwater Discharge in Tai-wan, Chikyukagaku(Geochemistry), 39, 165–171, 2005. Church, C. M.: An underground route for the water cycle, Nature,
380, 579–580, https://doi.org/10.1038/380579a0, 1996. Cong, Z. T., Yang, D. W., and Ni, G. H.: Does evaporation
para-dox exist in China?, Hydrol. Earth Syst. Sci., 13, 357–366, https://doi.org/10.5194/hess-13-357-2009, 2009.
Emori, S.: Dynamic and thermodynamic changes in mean and ex-treme precipitation under changed climate, Geophys. Res. Lett., 32, L17706, https://doi.org/10.1029/2005GL023272, 2005. Ferguson, G. and Gleeson, T.: Vulnerability of coastal aquifers to
groundwater use and climate change, Nature Climate Change, 2, 342–345, https://doi.org/10.1038/nclimate1413, 2012.
Fischer, E. M. and Knutti, R.: Anthropogenic contribution to global occurrence of heavy-precipitation and high-temperature extremes, Nature Clim. Change, 5, 560–564, https://doi.org/10.1038/nclimate2617, 2015.
Fujii, S., Nasu, N., Smith, A. J., Fuji, N., Mizutani, Y., Shi-makura, M., Konishi, K., Igarashi, C., Muramoto, J., Take-mura, T., Shimoda, T., Boggs, S., Jr., Fujioka, K., Mappa, H., Kawahata, H., Kong, Y. S., and Tanaka, T.: Submerged for-est off Nyuzen, Kurobegawa alluvial fan, Toyama Bay, Cen-tral Japan, Boreas, 15, 265–277, https://doi.org/10.1111/j.1502-3885.1986.tb00931.x, 1986.
Grinsted, A., Moore, J. C., and Jevrejeva, S.: Application of the cross wavelet transform and wavelet coherence to geophys-ical time series, Nonlin. Processes Geophys., 11, 561–566, https://doi.org/10.5194/npg-11-561-2004, 2004.
Han, D., Song, X., and Currell, M. J.: Identification of anthro-pogenic and natural inputs of sulfate into a karstic coastal groundwater system in northeast China: evidence from major ions,δ13CDICandδ34SSO4, Hydrol. Earth Syst. Sci., 20, 1983– 1999, https://doi.org/10.5194/hess-20-1983-2016, 2016. Hatta, M. and Zhang, J.: Temporal changes and impacts of
sub-marine fresh groundwater discharge to the coastal environment: A decadal case study in Toyama Bay, Japan, J. Geophys. Res.-Oceans, 118, 2610–2622, https://doi.org/10.1002/jgrc.20184, 2013.
Ito, T. and Fuji, S.: Water budget of groundwater in Toyama basin, Mem. Toyama Geogr. Soc., 10, 3–14, 1993 (in Japanese). Kawase, H., Hara, M., Yoshikane, T., Ishizaki, N. N., Uno, F.,
Hatsushika, H., and Kimura, F.: Altitude dependency of future snow cover changes over Central Japan evaluated by a regional climate model, J. Geophys. Res.-Atmos., 118, 12444–12457, https://doi.org/10.1002/2013JD020429, 2013.
Kokusai Kogyo Co. LTD: Report on the groundwater appropriate utilization in Uozu, Uozu, 2002.
Labat, D.: Cross wavelet analyses of annual continental freshwater discharge and selected climate indices, J. Hydrology, 385, 269– 278, https://doi.org/10.1016/j.jhydrol.2010.02.029, 2010. Lee, Y.-W., Kim, G., Lim, W.-A., and Hwang, D.-W.: A
relation-ship between submarine groundwater borne nutrients traced by Ra isotopes and the intensity of dinoflagellate red-tides occur-ring in the southern sea of Korea, Limnol. Oceanogr., 55, 1–10, https://doi.org/10.4319/lo.2010.55.1.0001, 2010.
Leung, M. Y.-T., Cheung, H. H. N., and Zhou, W.: Merid-ional displacement of the East Asian trough and its
re-sponse to the ENSO forcing, Clim. Dynam., 48, 335–352, https://doi.org/10.1007/s00382-016-3077-8, 2017.
Liang, L., Li, L., and Liu, Q.: Precipitation variability in North-east China from 1961 to 2008, J. Hydrol., 404, 67–76, https://doi.org/10.1016/j.jhydrol.2011.04.020, 2011.
Liu, Q., Charette, M. A., Henderson, P. B., McCorkle, D. C., Martin, W., and Dai, M.: Effect of submarine groundwater discharge on the coastal ocean inorganic carbon cycle, Limnol. Oceanogr., 59, 1529–1554, https://doi.org/10.4319/lo.2014.59.5.1529, 2014. Mulligan, A. E. and Charette, M. A.: Intercomparison
of submarine groundwater discharge estimates from a sandy unconfined aquifer, J. Hydrol., 327, 411–425, https://doi.org/10.1016/j.jhydrol.2005.11.056, 2006.
Nakaguchi, Y., Yamaguchi, Y., Yamada, H., Zhang, J., Suzuki, M., Koyama, Y., and Hayashi, K.: Characterization and origin of chemical components in the submarine groundwater discharge in Toyama Bay, Geochemistry, 39, 119–130, 2005 (in Japanese with English abstract).
Oude Essink, G. H. P., van Baaren, E. S., and de Louw, P. G. B.: Ef-fects of climate change on coastal groundwater systems: A mod-eling study in the Netherlands, Water Resour. Res., 46, W00F04, https://doi.org/10.1029/2009WR008719, 2010.
Shimizu, T., Kumagai, T. O., Kobayashi, M., Tamai, K., Iida, S. I., Kabeya, N., Ikawa, R., Tateishi, M., Miyazawa, Y., and Shimizu, A.: Estimation of annual forest evapotranspiration from a conif-erous plantation watershed in Japan (2): Comparison of eddy co-variance, water budget and sap-flow plus interception loss, J. Hy-drol., 522, 250–264, 2015.
Taniguchi, M. and Iwakawa, H.: Submarine groundwa-ter discharge in Osaka Bay, Japan, Limnology, 5, 25–32, https://doi.org/10.1007/s10201-003-0112-3, 2004.
Taniguchi, M., Burnett, W. C., Cable, J. E., and Turner, J. V.: Inves-tigation of submarine groundwater discharge, Hydrol. Process., 16, 2115–2129, https://doi.org/10.1002/hyp.1145, 2002. Trenberth, K. E.: Changes in precipitation with climate change,
Clim. Res., 47, 123–138, https://doi.org/10.3354/cr00953, 2011. Wada, Y., Lo, M.-H., Yeh, P. J. F., Reager, J. T., Famiglietti, J. S., Wu, R.-J., and Tseng, Y.-H.: Fate of water pumped from under-ground and contributions to sea-level rise, Nature Clim. Change, 6, 777–780, https://doi.org/10.1038/nclimate3001, 2016. Walther, G.-R., Post, E., Convey, P., Menzel, A., Parmesan, C.,
Bee-bee, T. J. C., Fromentin, J.-M., Hoegh-Guldberg, O., and Bair-lein, F.: Ecological responses to recent climate change, Nature, 416, 389–395, 2002.
Wang, L., Wu, Z., He, H., Wang, F., Du, H., and Zong, S.: Changes in summer extreme precipitation in Northeast Asia and their relationships with the East Asian summer monsoon during 1961–2009, Int. J. Climatol., 37, 25–35, https://doi.org/10.1002/joc.4683, 2017.
Xu, Z. X., Takeuchia, K., and Ishidaira, H.: Monotonic trend and step changes in Japanese precipitation, J. Hydrol., 279, 144–150, https://doi.org/10.1016/S0022-1694(03)00178-1, 2003. Zhang, B. and Wang, Z.-L.: Trend and multi-time scale
cross-wavelet analysis on precipitation and temperature in Tianjin area, Journal of Tianjin Normal University (Natural Science Edition), 36, 32–39, 2016 (in Chinese with English abstract).