Hydrol. Earth Syst. Sci., 17, 3159–3169, 2013 www.hydrol-earth-syst-sci.net/17/3159/2013/ doi:10.5194/hess-17-3159-2013
© Author(s) 2013. CC Attribution 3.0 License.
EGU Journal Logos (RGB)
Advances in
Geosciences
Open Access
Natural Hazards
and Earth System
Sciences
Open AccessAnnales
Geophysicae
Open AccessNonlinear Processes
in Geophysics
Open AccessAtmospheric
Chemistry
and Physics
Open AccessAtmospheric
Chemistry
and Physics
Open Access DiscussionsAtmospheric
Measurement
Techniques
Open AccessAtmospheric
Measurement
Techniques
Open Access DiscussionsBiogeosciences
Open Access Open Access
Biogeosciences
Discussions
Climate
of the Past
Open Access Open Access
Climate
of the Past
Discussions
Earth System
Dynamics
Open Access Open Access
Earth System
Dynamics
DiscussionsGeoscientific
Instrumentation
Methods and
Data Systems
Open Access
Geoscientific
Instrumentation
Methods and
Data Systems
Open Access DiscussionsGeoscientific
Model Development
Open Access Open Access
Geoscientific
Model Development
DiscussionsHydrology and
Earth System
Sciences
Open AccessHydrology and
Earth System
Sciences
Open Access DiscussionsOcean Science
Open Access Open Access
Ocean Science
DiscussionsSolid Earth
Open Access Open Access
Solid Earth
Discussions
The Cryosphere
Open Access Open Access
The Cryosphere
DiscussionsNatural Hazards
and Earth System
Sciences
Open Access
Discussions
Application of a model-based rainfall-runoff database as efficient
tool for flood risk management
L. Brocca1, S. Liersch2, F. Melone1, T. Moramarco1, and M. Volk3
1Research Institute for Geo-Hydrological Protection, National Research Council, Perugia, Italy 2Potsdam Institute for Climate Impact Research (PIK), Potsdam, Germany
3UFZ – Helmholtz Centre for Environmental Research, Department Computational Landscape Ecology, Leipzig, Germany
Correspondence to: L. Brocca ([email protected])
Received: 22 January 2013 – Published in Hydrol. Earth Syst. Sci. Discuss.: 18 February 2013 Revised: 30 June 2013 – Accepted: 3 July 2013 – Published: 6 August 2013
Abstract. A framework for a comprehensive synthetic
rainfall-runoff database was developed to study catchment response to a variety of rainfall events. The framework sup-ports effective flood risk assessment and management and implements simple approaches. It consists of three flexi-ble components, a rainfall generator, a continuous rainfall-runoff model, and a database management system. The sys-tem was developed and tested at two gauged river sections along the upper Tiber River (central Italy). One of the main questions was to investigate how simple such approaches can be applied without impairing the quality of the results. The rainfall-runoff model was used to simulate runoff on the ba-sis of a large number of rainfall events. The resulting rainfall-runoff database stores pre-simulated events classified on the basis of the rainfall amount, initial wetness conditions and initial discharge. The real-time operational forecasts follow an analogue method that does not need new model simula-tions. However, the forecasts are based on the simulation re-sults available in the rainfall-runoff database (for the specific class to which the forecast belongs). Therefore, the database can be used as an effective tool to assess possible streamflow scenarios assuming different rainfall volumes for the follow-ing days. The application to the study site shows that mag-nitudes of real flood events were appropriately captured by the database. Further work should be dedicated to introduce a component for taking account of the actual temporal distri-bution of rainfall events into the stochastic rainfall generator and to the use of different rainfall-runoff models to enhance the usability of the proposed procedure.
1 Introduction
3160 L. Brocca et al.: Application of a model-based rainfall-runoff database
weather prediction (NWP) models (1–4 days) are fundamen-tal tools and should represent the core of an FFS (Barbetta et al., 2012). The NWP models can be linked to continu-ous hydrological modelling which has the potential advan-tage to explicitly represent the dependence of runoff response on antecedent soil moisture conditions of basins (Brocca et al., 2008a). Therefore, FFSs would represent a fundamen-tal component of preparedness plans for preventing the dis-astrous flood events (Werner et al., 2005). However, large uncertainties are still involved in precipitation forecasts due to limited understanding on complex atmospheric processes. And although the use of NWPs is becoming a widespread activity, many further improvements are required (Cloke and Pappenberger, 2009). Beside the issue of rainfall spatial variability forecast, rainfall-runoff transformation to produce river discharge predictions is another source of uncertainty (Beven and Binley, 1992; Gabellani et al., 2007; Vaze et al., 2010; Van Steenbergen and Willems, 2012). Moreover, deci-sion makers demand for well-designed, but simple FFSs. On the one hand, such FFSs should have the advantage of run-ning with less computer power over the complex systems. On the other hand, they should be able to incorporate the uncertainty estimation in the forecast to enhance the reliabil-ity of both the forecasting and warning system in real-time flood management. In fact, quantifying uncertainty within the flood forecasting would enable the authorities to set risk-based criteria for flood warning, furnish information for mak-ing rational decisions and offer potential for additional eco-nomic benefits of forecasts to every rational decision maker (Krzysztofowicz, 2001).
In this context, this paper proposes a comprehensive rainfall-runoff database (RR-DB) to be used as an integrated tool of an FFS which takes the discharge forecast uncer-tainty into account. The RR-DB is based on the coupling of a stochastic rainfall and temperature generator tool and a continuous hydrological model (Asquith et al., 2004; Lier-sch and Volk, 2008). This coupling enables the simulation of both the soil moisture conditions of the basin and the cor-responding streamflow (Camici et al., 2011). The results of these simulations are stored in the database and include large numbers of rainfall-runoff scenarios which allow for the un-certainties of rainfall forecasts and soil moisture conditions of the basin. Consequently, the decision maker can easily in-quire which stream flow values might result from defined rainfall amounts or vice versa. The decision maker will re-trieve the discharge hydrograph scenarios without having to run any kind of coupled models – this is advantageous with regard to considerable time savings to issue warnings. The system has been developed and tested at two gauged river sections along the upper Tiber River (central Italy). The case study area has been and still is affected by severe flooding events that caused considerable damages in the region.
The paper is organized as follows: Sect. 2 outlines the method for developing the RR-DB along with an overview of the rainfall and temperature scenario generator and the
continuous hydrological model, which are used for develop-ing the database. Furthermore, Sect. 2 underlines the struc-ture of the RR-DB and highlights the cluster analysis adopted for the simulated streamflow and corresponding initial soil moisture data. Section 3 describes the study area. Section 4 explains the RR-DB implementation while its employment for the two river sites is described in Sect. 5. Finally, conclu-sions are drawn in the last Sect. 6.
2 Methods
The operational system of the RR-DB consists of three main model components: (1) a weather generator (rainfall and tem-perature), (2) a continuous rainfall-runoff model, and (3) a relational database management system (RDBMS) used to store and manage simulation data.
The steps required to develop the RR-DB are:
1. Generation ofN flood-relevant rainfall events accom-panied byN temperature scenarios.
2. Calibration and validation of a continuous rainfall-runoff model based on observed rainfall, temperature, and runoff data.
3. Identifying classes of season-specific initial discharge (Q) and antecedent catchment wetness conditions (AWC), respectively. These preconditions were ob-tained from runoff simulations based on the historical time series by applying a clustering approach (kmeans algorithm).
4. For each selected rainfall event and initial catch-ment condition in terms of discharge and wetness, the rainfall-runoff model is used to simulate the discharge hydrograph at the basin outlet. Therefore, the database consists ofN×Q×AWC discharge records represent-ing the response of the basin at different storms actrepresent-ing under different initial discharge and wetness conditions. The following subsections in this chapter describe in detail the specific models used in this study.
2.1 Stochastic rainfall generator
a brief description of the model is given here. The NSRP model supposes that each storm origin follows a Poissonian process. Then, a random number of cell origins is displaced from the storm origins by exponentially distributed distances. A rectangular pulse is associated with each cell origin, with duration and intensity expressed by two other independent random variables assumed exponentially distributed. The to-tal intensity at any point in time is then the sum of all the active cell intensities at that particular point.
The NSRP model has a total of five parameters that can be estimated by minimizing an objective function evaluated as the weighted sum of the normalized residuals between the statistical properties of the observed time series and their theoretical expression derived from the model. As showed by previous studies (Rodriguez-Iturbe et al., 1987; Cowpert-wait, 1991a, b), the main feature of the model is its ability to preserve statistical properties of a rainfall time series over a range of time scales.
2.2 Stochastic temperature generator
The rainfall scenarios are accompanied by temperature scenarios generated by using the fractionally differenced ARIMA model (FARIMA) (Montanari et al., 1997). Un-like classical ARIMA models that are a powerful tool for modelling stationary time series, the FARIMA models are able to fit autocorrelation functions characterized by a slow decay, suggesting the presence of a long-term persistence. This dependence, namely the Hurst effect (Hurst, 1951), has been detected in many temporal series of hydrological data and very often in air temperature series (Moretti and Mon-tanari, 2008). The procedure for the implementation of the FARIMA model is not straightforward, particularly in the identification phase for the preliminary evaluation of model parameters. The method employed in this study is the one suggested by Montanari et al. (1997). We note that the cor-relation between rainfall and temperature is not taken into account as we found a non-significant correlation between the two variables in the observed data.
2.3 Continuous rainfall-runoff model
The “Modello Idrologico SemiDistribuito in continuo” (MISDc, Brocca et al., 2011a) is selected as continuous rainfall-runoff model. The model was developed for the sim-ulation of flood events at half-hourly time scale and con-sists of two components: the first is a soil water balance model (Brocca et al., 2008a) that simulates the soil mois-ture temporal pattern and sets the initial conditions for the second component, which is an event-based rainfall-runoff model for flood hydrograph simulation. The two models are coupled through a simple linear relationship that was de-rived from an intense monitoring activity of soil moisture and runoff over experimental catchments located in central Italy (Brocca et al., 2009). The model incorporates a limited
number of parameters and it is characterized by low com-putational efforts which make it very attractive for the hy-drological practice. For that, the MISDc model can be con-veniently adopted for the generation of long discharge time series (e.g. 1000 or more years). For a detailed description of the model the reader is referred to Brocca et al. (2011a) and Camici et al. (2011). MISDc has already been successfully applied in several catchments in Italy (Brocca et al., 2010, 2011a; Camici et al., 2011) and across Europe (Brocca et al., 2011b). In this study, we used the lumped version of the model and added a simple component for the simulation of baseflow in order to simulate the discharge during non-flood conditions (Brocca et al., 2008b, 2011b). Specifically, a non-linear power function between the soil moisture storage of the model and the baseflow is adopted. Finally, we note that the model is currently employed operational within the Civil Protection Centre of the study region for real-time flood fore-casting in the study area. It is freely available at the following website: http://hydrology.irpi.cnr.it/people/l.brocca.
2.4 Relational DataBase Management System
(RDBMS)
The RDBMS consists basically of three tables: (1) the weather scenarios (rainfall and temperature), (2) catchment preconditions at time stept0 to initialize the rainfall-runoff model, and (3) runoff scenarios.
2.4.1 Precondition table
Usually, rainfall-runoff models require rather long “warm-up” periods before they provide reasonable results. In or-der to avoid this, the runoff simulations based on each rain-fall/temperature scenario are starting with different initial model states. These states represent a variety of possible catchment saturation preconditions (wet to dry) at time step zero (t0). The parameters required for model initializations are the antecedent wetness index (AWC0) and initial dis-charge (Q0). These combinations are stored in the catchment precondition table in the database. This table could show, for instance, that the first combination isQ0= 30 m3s−1and AWC0=0.8, that the second combination isQ0=30 m3s−1 and AWC0=0.9, and so on. Q×AWC precondition com-binations for each rainfall scenario were used in this study. Thus, N×Q×AWC runoff scenarios are stored in the database.
2.4.2 Selecting runoff scenarios
Thekmeans (Hartigan and Wong, 1979) clustering method was used to generate a number of meaningful classes ofQ
3162 L. Brocca et al.: Application of a model-based rainfall-runoff database
23 Figures
1
2
3
Figure 1. Terrain conditions of the Upper Tiber River Basin and location of the 4
hydrometeorological monitoring network. 5
Fig. 1. Terrain conditions of the Upper Tiber River Basin and loca-tion of the hydrometeorological monitoring network.
the observed actual dischargeQ0at the gage site and the an-tecedent wetness condition (AWC0). The range for the latter is obtained from the seasonal classification described above. Information about the future is determined by the weather forecast representing a range of expected rainfall depths. Thus,Q0, AWC0of current month, along with rainfall fore-casts are used as criteria to select runoff scenarios from the database. In order to account for uncertainties in observed discharge measurements at time stept0, the range of initial Q0 values in the precondition table that bracket the current observation is used.
It is worth noting that the RR-DB was finalized to support applied flood risk management with a useful and simple tool, providing a large set of flood-relevant rainfall-runoff simu-lations (Liersch and Volk, 2008). Once the RR-DB has been developed for a gauged river site, it can be applied by users without or with limited hydrologic modelling expertise.
3 Study area
[image:4.595.310.547.115.179.2]The study area is situated in an inland region of central Italy and it includes two sub-catchments of the Upper Tiber River Basin: Tiber at Santa Lucia (935 km2) and Ponte Felcino
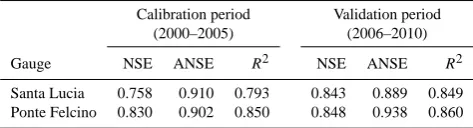
Table 1. Performance of the MISDc model in the calibration and validation periods for Santa Lucia and Ponte Felcino river sections (NSE: Nash–Sutcliffe efficiency, ANSE: NSE for high flow condi-tions,R2: determination coefficient).
Calibration period Validation period (2000–2005) (2006–2010)
Gauge NSE ANSE R2 NSE ANSE R2
Santa Lucia 0.758 0.910 0.793 0.843 0.889 0.849 Ponte Felcino 0.830 0.902 0.850 0.848 0.938 0.860
(2035 km2), respectively (see Fig. 1). The main features of the two investigated catchments are reported in Table 1.
The climate is Mediterranean with mean annual precipita-tion of about 950 mm, ranging from 700 mm at lower eleva-tions to 1600 mm along the ridges. Higher monthly precipita-tion values are generally observed during the autumn-winter period when widespread rainfalls cause flood events in the region. Mean annual temperature ranges between 5.5◦C at higher elevations to 16◦C in the lowlands. Snowfall repre-sents a low percentage of precipitation and is unusual and ephemeral at altitudes below 500 m a.s.l.
In the study area, a dense hydro-meteorological monitor-ing network (1 station every 150 km2) has been operating for more than 25 yr and the data are recorded with a time inter-val of 30 min. With regard to runoff data, the two gauging sta-tions are equipped with remote ultrasonic water level gauges, while the measurements of flow velocity are performed by current meter from cableways also during high floods – thus warranting a reliable rating curve. For this study eleven years of rainfall, temperature and discharge data recorded from 2000 to 2010 were considered.
Three significant flood events occurred in this period that caused widespread flooding (Berni et al., 2009a, b; Brocca et al., 2011a). Specifically, the flood events occurred in Novem-ber 2005, DecemNovem-ber 2008 and January 2010. They provoked significant economic losses and constitute the main test-cases for the application of the RR-DB.
4 Rainfall-runoff database implementation
In the following, the analyses performed for the two selected basins are reported. For each basin, the estimation of the pa-rameters of the rainfall and temperature stochastic models, the calibration/validation of the rainfall-runoff model, and the analysis of their performance is described.
4.1 Synthetic weather scenario generation
4.1.1 Rainfall generator
24
1
[image:5.595.94.502.65.240.2]2
Figure 2. Comparison of the observed, obs, and simulated, sim, time series generated through
3
the NSRP model (10 runs) for Santa Lucia basin considering: A) the monthly statistical
4
properties, and B) the rainfall annual maxima values for durations between 1 and 24.
5
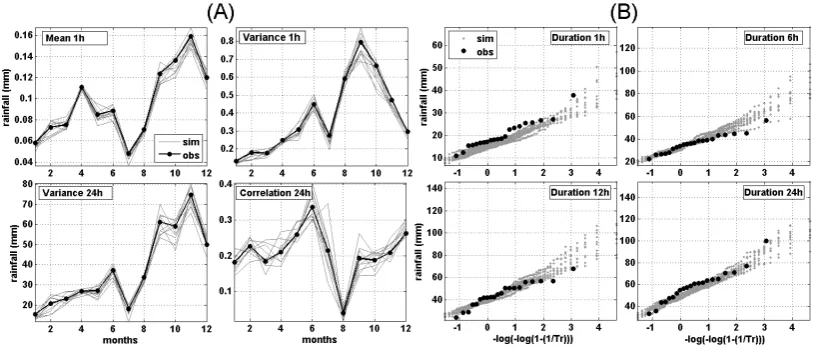
Fig. 2. Comparison of the observed, obs, and simulated, sim, time series generated through the NSRP model (10 runs) for Santa Lucia basin considering: (A) the monthly statistical properties, and (B) the rainfall annual maxima values for durations between 1 and 24.
previous studies (e.g. Camici et al., 2011), the NSRP model calibration was carried out for each month of the year on the basis of four sampling statistics at different temporal aggre-gation levels: the hourly mean, the hourly and daily variance and the lag-one autocorrelation of daily data. Therefore for each month, the NSRP parameters were estimated by min-imizing a weighted sum of normalized residuals between the sample and theoretical moments. The weights were as-signed as in Camici et al. (2011) with greatest values for the hourly mean and the lag-one autocorrelation of daily data (Cowpertwait et al., 1996).
In Fig. 2a, the observed and simulated monthly values of the most significant statistical properties for the mean areal rainfall series are plotted for Santa Lucia basin as an exam-ple. The curves show a substantial agreement for all the sta-tistical properties, also for those not considered in the cal-ibration process. The frequency of annual maximum rain-fall for four selected durations (between 1 and 24 h) of the same basin is shown in Fig. 2b. It becomes obvious that the observed extreme values are fairly well reproduced by the NSRP model as well, except for a slight underestimation of hourly values and overestimation of 6 h and 12 h values. Therefore, it can be concluded that the NSRP model can be used to represent both the observed statistical properties and the extreme values. For Ponte Felcino basin, similar results are obtained (not shown for brevity).
After its calibration, the NSRP model was used with the optimal parameter set to simulate 1000 yr of continuous half-hourly rainfall values. From this time series, the rainfall events were extracted by adopting a specific procedure. A flood-relevant rainfall event was defined if the total rainfall is greater than 10 mm; each event is distinguished from another one if a total rainfall less than 1 mm occurred for at least 10 h. Following this procedure,N=10 000 rainfall events were extracted for the two basins and used for building the
25 1
2
Figure 3. Comparison of the observed, Qobs, and simulated, Qsim, discharge (lower panel) for 3
the calibration (a) and validation (b) periods at Santa Lucia river section. The temporal pattern 4
of soil saturation and rainfall is also shown in the upper panels. 5
Fig. 3. Comparison of the observed,Qobs, and simulated,Qsim, discharge (lower panel) for the calibration (a) and validation (b) periods at Santa Lucia river section. The temporal pattern of soil saturation and rainfall is also shown in the upper panels.
RR-DB. As none of the selected events exceeded the fore-seen five days, they were extended with zero value rainfall values.
4.1.2 Temperature generator
[image:5.595.310.544.291.457.2]3164 L. Brocca et al.: Application of a model-based rainfall-runoff database
26 1
2
Figure 4. Comparison of the observed, Qobs, and simulated, Qsim, discharge for the four
3
largest flood events occurred in the study period for Santa Lucia and Ponte Felcino river 4
sections: A) December 2000, B) November 2005, C) November 2008, and D) January 2010. 5
The mean areal rainfall pattern for Ponte Felcino basin is also shown. 6
Fig. 4. Comparison of the observed,Qobs, and simulated,Qsim, discharge for the four largest flood events occurred in the study period for Santa Lucia and Ponte Felcino river sections: (A) December 2000, (B) November 2005, (C) November 2008, and (D) January 2010. The mean areal rainfall pattern for Ponte Felcino basin is also shown.
1000 yr of synthetic daily mean temperature values. Finally, the synthetic series were disaggregated at half-hourly tem-poral resolution using a sine-cosine wave function (Hashemi et al., 2000). Half-hourly temperature values were accom-panied to rainfall values by considering the same synthetic dates previously obtained in the extraction of rainfall events.
4.2 MISDc model calibration/validation
The MISDc model was calibrated and tested through its ca-pability to simulate discharge for the two river sections of Santa Lucia and Ponte Felcino. To this end, the study period was divided into two parts: from 2000 to 2005 for model pa-rameter calibration and from 2006 to 2010 for model vali-dation. As objective functions, the Nash–Sutcliffe efficiency (NSE) (Nash and Sutcliffe, 1970), the NSE adapted to high flow conditions (ANSE) (Hoffmann et al., 2004), and the determination coefficient R2 were used for model valida-tion. Figure 3 shows the model results for the Santa Lucia river section in the calibration and validation period (sim-ilar findings are observed for the Ponte Felcino river sec-tion). The agreement between observed and modelled dis-charge is quite good, both in the calibration and validation periods, with NSE values greater than 0.75 and 0.83 for Santa Lucia and Ponte Felcino, respectively (see Table 1).
In particular, the model was found reliable in reproducing both the peak and the shape of the observed hydrographs, mainly during high flow conditions that are of much interest for the implementation of the RR-DB (see ANSE values in Table 1). The unexpected better performance of the model in the validation period, mainly for Santa Lucia, is dependent on the higher variability of discharge in that period that facil-itates the achievement of higher performance score. For high-lighting the MISDc performance during flood events, Fig. 4 shows the model results for the four largest floods occurred in the study period: December 2000, November 2005, De-cember 2008 and January 2010. The good results of the hy-drological model confirm the selection for its use within the RR-DB.
[image:6.595.118.479.63.350.2]27 1
2
Figure 5. Frequency distribution of annual maximum discharges obtained from the observed, 3
Qobs, and simulated, Qsim, data for the Ponte Felcino river section. 4
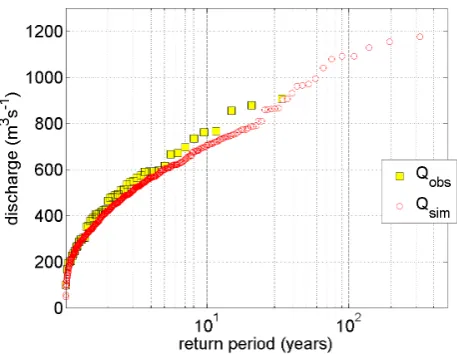
Fig. 5. Frequency distribution of annual maximum discharges ob-tained from the observed,Qobs, and simulated,Qsim, data for the Ponte Felcino river section.
2011), a fairly good agreement with observations is obtained, thus allowing the assumption that the proposed procedure could also be able to reproduce extreme discharge conditions.
4.3 Precondition table
Based on the simulation of the rainfall-runoff model, the classes of antecedent wetness condition, AWC, and dis-charge,Q, of the two river basins were identified. Specifi-cally, AWC values range between 0.24 and 0.98 with a step of 0.02 andQvalues between 0 and 200 m3s−1with step of 10 m3s−1(see Table 2).
Successively, thekmeans cluster analysis was applied to identify the AWC ranges that correspond to season-specific
Qvalues. While the initial discharge is known as it is ob-served at the gauging station, AWC values are usually not known. Therefore, initial AWC ranges are derived from the discharge range for each month of the year using Table 3. In this study, 12 clusters are considered and an example for three months and for Santa Lucia river section is reported in Table 3. From this table, the saturation intervals correspond-ing to specificQvalues of a particular month can be easily identified. This helps to limit the number of streamflow sim-ulations selected by a database query implemented in SQL (Structured Query Language), see below.
[image:7.595.52.281.63.240.2]It is worth noting that instead of computing the AWC val-ues as a function of discharge, initial soil moisture condi-tions can be also obtained by in situ and/or remote sensing data (e.g. Brocca et al., 2010; Matgen et al., 2012) and/or by continuously applying the rainfall-runoff model that requires continuous and real-time rainfall and temperature data. These further options will be investigated in a future study.
Table 2. Number of rainfall-runoff scenarios and model initializa-tion states within the RR-DB.
MIN MAX STEP #
AWC [–] 0.24 0.98 0.02 38
Q[m3s−1] 0 200 10 21
Rainfall-temperature scenarios 10 000
Runoff scenarios 7 980 000
5 Application of the rainfall-runoff database
The calibration and analysis of the different models/tools em-ployed in developing the RR-DB was described in the previ-ous section. Once the framework of the RR-DB has been im-plemented, its application is rather easy and does not require specific hydrological modelling skills.
By way of example we consider the outlet of basin at Santa Lucia. Let us assume the month is January and, for a sched-uled time, the rainfall forecast for the next 24 h is 40 mm and the actual discharge at Santa Lucia is 24 m3s−1. Considering the precondition table (Table 3), in terms ofQ0the interval of interest is 20.28–29.65 m3s−1, corresponding AWC0 values ranging between 0.852 and 0.884 (according to the seasonal classification for January), and rainfall scenarios are selected in the range±10 % (36 to 44 mm) from the expected value (40 mm). Based on SQL, the query is formulated as follows: SELECT all runoff simulations FROM runoff simula-tion table that were generated based on rainfall scenarios
>= 36 AND <= 44 mm AND were started with Q0 val-ues >= 20.28 AND <= 29.65 m3s−1 AND AWC
0 values >= 0.852 AND<= 0.884.
A result set of runoff simulations will be obtained that rep-resents the runoff forecasts for the gauge.
3166 L. Brocca et al.: Application of a model-based rainfall-runoff database
Table 3. Example of the precondition table obtained through thekmeans cluster analysis for Santa Lucia river section and for the months of January, April and September (AWC: Antecedent Wetness Conditions,Q: discharge).
Clusters AWC range Qrange AWC range Qrange AWC range Qrange
January April September
1 0.665–0.846 0–2 0.664–0.802 0–1 0.289–0.355 0–0
2 0.799–0.846 2–4 0.782–0.817 1–2 0.366–0.400 0–0
3 0.818–0.851 4–8 0.802–0.832 2–4 0.400–0.429 0–0
4 0.831–0.867 8–13 0.815–0.844 4–6 0.429–0.460 0–0
5 0.843–0.880 13–20 0.825–0.867 6–9 0.460–0.506 0–0
6 0.852–0.884 20–30 0.834–0.875 9–13 0.506–0.588 0–0
7 0.860–0.891 30–43 0.842–0.882 13–17 0.593–0.675 0–0
8 0.868–0.898 43–62 0.848–0.888 17–23 0.675–0.803 0–1
9 0.875–0.910 62–91 0.854–0.892 23–31 0.807–0.822 1–3
10 0.878–0.925 92–164 0.860–0.894 31–43 0.809–0.827 3–5 11 0.886–0.932 172–290 0.867–0.898 44–63 0.821–0.841 5–8 12 0.898–0.933 297–390 0.876–0.897 63–85 0.832–0.847 8–13
28 1
2
Figure 6. Results of the Rainfall-Runoff (RR) database (DB) for the three largest flood events 3
in the study period for Santa Lucia and Ponte Felcino river sections (Qobs: observed discharge, 4
median Qsim: median of simulated discharge through the RR-DB). 5
Fig. 6. Results of the rainfall-runoff (RR) database (DB) for the three largest flood events in the study period for Santa Lucia and Ponte Felcino river sections (Qobs: observed discharge, median Qsim: median of simulated discharge through the RR-DB).
i.e., by considering the time when the rainfall starts. The results show that all flood events are captured by the 90% rainfall-runoff result set, except for a short period along the rising limb of the 2008 flood event at Ponte Felcino gauging station (see Fig. 6). For the event observed at Santa Lucia in 2008, a range between 170 and 560 m3s−1with an observed
peak value of∼300 m3s−1was found. Considering the 50 % of the ensemble, the simulated range strongly reduces (240– 400 m3s−1for the 2008 flood at Santa Lucia) even though, overall, a slight underestimation of the peak values was ob-tained for the floods of 2005 and 2010 at Ponte Felcino. By inspecting in-depth Fig. 6, for some floods it can be observed that the rising limb is anticipated (earlier) compared to the observed one. Considering the performance of the different components of the database, this drawback can be ascribed to the rainfall generator that usually produces rainfall scenar-ios starting before and that are shorter than the actual rainfall events. This issue can be solved by introducing a component for taking account of the actual temporal distribution of rain-fall events into the stochastic rainrain-fall generator. This aspect will be tested in a further study. However, considering the simplicity and the capability of reproducing quickly reliable flood scenarios with a lead time of 24 h, the RR-DB is defi-nitely of considerable interest as a tool of a flood forecasting systems.
[image:8.595.51.287.289.568.2]29 1
2
Figure 7. Cumulative Distribution Function (CDF) for the observed and simulated discharge 3
for Santa Lucia (upper panels) and Ponte Felcino (lower panels) river sections (Qobs: observed 4
discharge, 25-75°, median Qsim: 25-75 percentiles and median of simulated discharge through 5
the RR-DB) 6
7
Fig. 7. Cumulative distribution function (CDF) for the observed and simulated discharge for Santa Lucia (upper panels) and Ponte Fel-cino (lower panels) river sections (Qobs: observed discharge, 25– 75◦, medianQsim: 25–75 percentiles and median of simulated dis-charge through the RR-DB).
that,Mrainfall events are randomly selected from the total number of events, withMranging between 100 and 10 000 (N=10 000). For each subsample of the RRDB, and for the two investigated basins, the RRMSE is computed for the three flood events of 2005, 2008 and 2010. As a result, the database performance with∼4000 rainfall events is found to be very close to the one with the complete database.
6 Conclusions
Results of this study confirm the findings of other authors that simple approaches can succinctly represent the response of a catchment to precipitation (Jakeman et al., 1993; Kirchner, 2006; Perrin et al., 2007). Based on this principle, the pro-posed RR-DB might be an alternative to complex data- and parameter-intensive model frameworks for flood risk man-agement.
The main benefits of the RR-DB can be thus identified: (1) it is open source and self-contained: no runs of RR mod-els are required (only for the database development); (2) it is easy to use with the considerable advantage of getting as quickly as possible discharge scenarios for the following days and without requiring hydrologic modelling skills; but for the database development, modelling skills are required, of course; (3) it can be coupled with any hydraulic model providing the corresponding flooding scenarios; (4) due to the parsimonious approach to data requirements, it can be applied in many data-poor catchments; (5) uncertainties in rainfall measurements and forecasting as well as uncertain-ties relating to model predictions are implicitly taken into account.
By using database queries, one is able to produce flood risk scenarios depending on short-term rainfall forecasts. The database can be used by persons who are not familiar with hydrological modelling and one will retrieve the dis-charge hydrograph scenarios without having to run any kind
of models with a considerable time saving to warning issues. Moreover, the possibility for the stakeholders involved in the FFS to have a direct control on the database (through queries) allows them to really trust the forecasting tool they are using. The proposed procedure to develop a RR-DB can be ap-plied to any catchment where good performance of discharge simulations can be achieved with a rainfall-runoff model. Due to the parsimonious parameterization of the model used and its minimal data requirements, runoff simulations can be performed very quickly on a standard PC. These are opti-mal conditions to realize thousands of simulations within a short period of time, thus embracing also the uncertainty as-sociated to the model forecasts. In order to always provide fairly accurate flood scenario assessments, the database re-quires updating through novel flood events.
Further work should be dedicated to further improve the performance and usability of the proposed procedure. Specif-ically, the following modifications are foreseen: (1) introduc-tion of a component for taking account of the actual temporal distribution of rainfall events into the stochastic rainfall gen-erator, (2) addition of historical rainfall events in the database to improve the representativeness of the rainfall patters, (3) use of different rainfall-runoff models, (4) implementation of a real-time bias correction procedure (Brocca et al., 2010), and (5) use of satellite and/or in situ soil moisture observa-tions for setting up the antecedent wetness condiobserva-tions.
Acknowledgements. We would like to acknowledge the Umbria
Region for providing the analyzed rainfall-runoff data. We are also grateful to P. Willems and one anonymous reviewer for their comments and suggestions. This work was partly funded by the POR-FESR Project, 2010,“Flooding Scenarios”, Umbria Region. With this work we wish to memorialize co-author Florisa Melone, who passed away on 28 October, 2012. The only consolation we have is that we had the honor and privilege of working with her and had her in our life as colleague and mainly as friend.
Edited by: N. Verhoest
References
Asquith, W. H., Thompson, D. B., Cleveland, T. G., and Fang, X.: Synthesis of Rainfall and Runoff Data used for Texas Department of Transportation Research Projects 0-4193 and 0-4194, US Ge-ological Survey, Open File Report 2004-103, p. 50, 2004. Bae, D. H., Georgakakos, K. P., and Nanda, S. K.: Operational
fore-casting with real-time databases, J. Hydraul. Div.-ASCE, 121, 49–60, 1995.
Barbetta, S., Moramarco, T., Brocca, L., Franchini, M., and Mel-one, F.: Confidence interval of real-time forecast stages provided by the STAFOM-RCM model: the case study of the Tiber River (Italy), Hydrol. Process., online first, doi:10.1002/hyp.9613, 2012.
[image:9.595.53.286.64.195.2]3168 L. Brocca et al.: Application of a model-based rainfall-runoff database
in the Upper-Medium Tiber River basin, Geophys. Res. Abstr., EGU2009-9498-3, EGU General Assembly 2009, Vienna, Aus-tria, 2009a.
Berni, N., Pandolfo, C., Ponziani, F., Stelluti, M., and Viterbo, A.: Umbria Region Forecasting/Decision Support fr Hydraulic Risk Mitigation Purposes, in: Proceedings of the Tenth International Conference on Computing and Control in the Water Industry, CRC Press, Sheffield (UK), 6 pp., 2009b.
Beven, K. J. and Binley, A. M.: The future of distributed models: model calibration and predictive uncertainty, Hydrol. Process., 6, 279–298, 1992.
Bras, R. L. and Rodriguez-Iturbe, I.: Random function and hydrol-ogy, Addison-Wesley Publishing Company, 1985.
Brocca, L., Melone, F., and Moramarco, T.: On the estimation of an-tecedent wetness conditions in rainfall-runoff modelling, Hydrol. Process., 22, 629–642, 2008a.
Brocca, L., Melone, F., Moramarco, T., and Singh, V. P.: A con-tinuous rainfall-runoff model as tool for the critical hydrological scenario assessment in natural channels, in: Taniguchi, M., Bur-nett, W. C., Fukushima, Y., Haigh, M., and Umezawa, Y., From headwater to the ocean. Hydrological changes and managements, Taylor & Francis Group, London, 175–179, 2008b.
Brocca, L., Melone, F., Moramarco, T., and Singh, V. P.: Assimila-tion of observed soil moisture data in storm rainfall-runoff mod-elling, J. Hydrol. Eng., 14, 153–165, 2009.
Brocca, L., Melone, F., Moramarco, T., Wagner, W., Naeimi, V., Bartalis, Z., and Hasenauer, S.: Improving runoff prediction through the assimilation of the ASCAT soil moisture product, Hydrol. Earth Syst. Sci., 14, 1881–1893, doi:10.5194/hess-14-1881-2010, 2010.
Brocca, L., Melone, F., and Moramarco, T.: Distributed rainfall-runoff modelling for flood frequency estimation and flood fore-casting, Hydrol. Process., 25, 2801–2813, 2011a.
Brocca, L., Melone, F., Moramarco, T., Penna, D., Borga, M., Mat-gen, P., and Heitz, S.: Investigation of the hydrologic response of three experimental basins across Europe, Journal for Land Man-agement, Food and Environment, 62, 31–37, 2011b.
Camici, S., Tarpanelli, A., Brocca, L., Melone, F., and Moramarco, T.: “Design soil moisture” estimation by comparing continuous and storm-based rainfall-runoff modelling, Water Resour. Res., 47, W05527, doi:10.1029/2010WR009298, 2011.
Chao, Z., Hua-sheng, H., Wei-min, B., and Luo-ping, Z.: Robust re-cursive estimation of auto-regressive updating model parameters for real-time flood forecasting, J. Hydrol., 349, 376–382, 2008. Cloke, H. and Pappenberger, F.: Ensemble flood forecasting: A
re-view, J. Hydrol., 375, 613–626, 2009.
Cowpertwait, P. S. P.: Further developments of the Neyman-Scott clustered point process for modelling rainfall, Water Resour. Res., 27, 1431–1438, 1991a.
Cowpertwait, P. S. P.: The stochastic generation of rainfall time se-ries, Ph.D. Thesis, University of Newcastle upon Tyne, 1991b. Cowpertwait, P. S. P., O’Connell, P. E., Metcalfe, A. V., and
Mawd-sley, J. A.: Stochastic point process modelling of rainfall. I. Single-site fitting and validation, J. Hydrol., 175, 17–46, 1996. Damle, C. and Yalcin, A.: Flood prediction using Time Series Data
Mining, J. Hydrol., 333, 305–316, 2007.
de Roo, A. P. J., Gouweleeuw, B., Thielen, J., Bartholmes, J., Bongioannini-Cerlini, P., Todini, E., Bates, P. D., Horritt, M., Hunter, N., Beven, K., Pappenberger, F., Heise, E., Rivin, G.,
Hils, M., Hollingsworth, A., Holst, B., Kwadijk, J., Reggiani, P., Van Dijk, M., Sattler, K., and Sprokkereef, E.: Development of a European flood forecasting system, Int. J. River Basin Manage., 1, 49–59, 2003.
Gabellani, S., Boni, G., Ferraris, L., von Hardenberg, J., and Provenzale, A.: Propagation of uncertainty from rainfall to runoff: A case study with a stochastic rainfall generator, Adv. Water Resour., 30, 2061–2071, 2007.
Georgakakos, K. P., Carpenter, T. M., Cramer, J. A., Sperfslage, J. A., Sweeney, T. L., and Fread, D. L.: National system for threshold runoff estimation, in: Engineering Hydrology, edited by: Kuo, C. Y., American Society of Civil Engineers, New York, 952–957, 1993.
Hartigan, J. and Wong, M.: Algorithm AS 136: A K-Means Clus-tering Algorithm, J. Roy. Stat. Soc. C-App., 28, 100–108, 1979. Hashemi, A. M., Franchini, M., and O’Connell, P. E.: Climatic
and basin factors affecting the flood frequency curve: PART I – A simple sensitivity analysis based on the continuous simulation approach, Hydrol. Earth Syst. Sci., 4, 463–482, doi:10.5194/hess-4-463-2000, 2000.
Hoffmann, L., Idrissi, A. E., Pfister, L., Hingray, B., Guex, F., Musy, A., Humbert, J., Drogue, G., and Leviandier, T.: Development of regionalized hydrological models in an area with short hydrolog-ical observation series, River Res. Appl., 20, 243–254, 2004. Hurst, H. E.: Long-term storage capacity of reservoirs, T. Am. Soc.
Eng., 116, 770–799, 1951.
Jakeman, A. J., Littlewood, I. G., and Whitehead, P. G.: Computa-tion of the instantaneous unit hydrograph and identifiable com-ponent flows with application to two small upland catchments, J. Hydrol., 117, 275–300, 1993.
Kirchner, J. W.: Getting the right answers for the right rea-sons: Linking measurements, analyses, and models to advance the science of hydrology, Water Resour. Res., 42, W03S04, doi:10.1029/2005WR004362, 2006.
Krzysztofowicz, R.: Integrator of uncertainties for probabilistic river stage forecasting: precipitation-dependent model, J. Hy-drol., 249, 69–85, 2001.
Liersch, S. and Volk, M.: A rainfall-runoff database to support flood risk management, in: Proceedings of the iEMSs Fourth Biennial Meeting: International Congress on Environmental Modelling and Software (iEMSs 2008), edited by: S`anchez-Marr`e, M., B´ejar, J., Comas, J., Rizzoli, A. E., and Guariso, G., International Environmental Modelling and Software Society, Barcelona, Cat-alonia, 494–502, 2008.
Matgen, P., Fenicia, F., Heitz, S., Plaza, D., de Keyser, R., Pauwels, V. R. N., Wagner, W., and Savenije, H.: Can ASCAT-derived soil wetness indices reduce predictive uncertainty in well-gauged ar-eas? A comparison with in-situ soil moisture gauges in an assim-ilation application, Adv. Water Resour., 44, 49–65, 2012. Montanari, A., Rosso, R., and Taqqu, M. S.: Fractionally
differ-enced ARIMA models applied to hydrologic time series: identifi-cation, estimation and simulation, Water Resour. Res., 33, 1035– 1044, 1997.
Moretti, G. and Montanari, A.: Inferring the flood frequency dis-tribution for an ungauged basin using a spatially distributed rainfall-runoff model, Hydrol. Earth Syst. Sci., 12, 1141–1152, doi:10.5194/hess-12-1141-2008, 2008.
290, 1970.
Perrin, C., Oudin, L., Andreassian, V., Rojas-Serna, C., Michel, C., and Mathevet, T.: Impact of limited streamflow data on the effi-ciency and the parameters of rainfall-runoff models, Hydrolog. Sci. J., 52, 131–151, 2007.
Reggiani, P. and Weerts, A.: A Bayesian approach to decisionmak-ing under uncertainty: An application to real-time forecastdecisionmak-ing in the river Rhine, J. Hydrol., 356, 56–69, 2008.
Rodriguez-Iturbe, I., Febres De Power, B., and Valdes, J. B.: Rect-angular pulses point process models for rainfall: analysis of em-pirical data, J. Geophys. Res., 92, 9645–9656, 1987.
Romanowicz, R. J., Young, P. C., Beven, K. J., and Pappenberger, F.: A data based mechanistic approach to nonlinear flood routing and adaptive flood level forecasting, Adv. Water Resour., 31, 1048– 1056, 2008.
Smith, K. and Ward, R.: Floods: Physical Processes and Human Impacts, John Wiley, Chichester, 1998.
Tiwari, M. K. and Chatterjee, C.: Uncertainty assessment and en-semble flood forecasting using bootstrap based artificial neural networks (BANNs), J. Hydrol., 382, 20–33, 2010.
Van Steenbergen, N. and Willems, P.: Method for testing the accu-racy of rainfall- runoff models in predicting peak flow changes due to rainfall changes, in a climate changing context, J. Hydrol., 414–415, 425–434, 2012.
Vaze, J., Post, D. A., Chiew, F. H. S., Perraud, J. M., Viney, N. R., and Teng, J.: Climate nonstationarity – Validity of calibrated rainfall-runoff models for use in climatic change studies, J. Hy-drol., 394, 447–457, 2010.
Villarini, G., Krajewski, W. F., Ntelekos, A. A., Georgakakos, K. P., and Smith, J. A.: Towards probabilistic forecasting of flash floods: the combined effects of uncertainty in radar-rainfall and flash flood guidance, J. Hydrol., 394, 275–284, 2010.