Hydrol. Earth Syst. Sci., 14, 2671–2679, 2010 www.hydrol-earth-syst-sci.net/14/2671/2010/ doi:10.5194/hess-14-2671-2010
© Author(s) 2010. CC Attribution 3.0 License.
Hydrology and
Earth System
Sciences
Investigating changes over time of annual rainfall in Zimbabwe
D. Mazvimavi
Institute for Water Studies, University of the Western Cape, Private Bag X17, Bellville, 7535, South Africa Received: 30 May 2008 – Published in Hydrol. Earth Syst. Sci. Discuss.: 10 July 2008
Revised: 15 November 2010 – Accepted: 15 December 2010 – Published: 22 December 2010
Abstract. There is increasing concern in southern Africa
about the possible decline of rainfall as a result of global warming. Some studies concluded that average rainfall in Zimbabwe had declined by 10% or 100 mm during the last 100 years. This paper investigates the validity of the as-sumption that rainfall is declining in Zimbabwe. Time series of annual rainfall, and total rainfall for (a) the early part of the rainy season, October-November-December (OND), and (b) the mid to end of the rainy season, January-February-March (JFM) are analysed for the presence of trends using the Mann-Kendall test, and for the decline or increase dur-ing years with either high or low rainfall usdur-ing quantile re-gression analysis. The Pettitt test has also been utilized to examine the possible existence of change or break-points in the rainfall time series. The analysis has been done for 40 rainfall stations with records starting during the 1892– 1940 period and ending in 2000, and representative of all the rainfall regions.
The Mann-Kendal test did not identify a significant trend at all the 40 stations, and therefore there is no proof that the average rainfall at each of these stations has changed. Quan-tile regression analysis revealed a decline in annual rainfall less than the tenth percentile at only one station, and increas-ing of rainfall greater than the ninetieth percentile at another station. All the other stations had no changes over time in both the low and high rainfall at the annual interval. Cli-mate change effects are therefore not yet statistically signif-icant within time series of total seasonal and annual rainfall in Zimbabwe. The general perception about declining rain-fall is likely due to the presence of multidecadal variability characterized by bunching of years with above (e.g. 1951– 1958, 1973–1980) and below (e.g. 1959–1972, 1982–1994 ) average rainfall.
Correspondence to: D. Mazvimavi ([email protected])
1 Introduction
There are several instances when the occurrences of floods or droughts in southern Africa are considered as evidence of effects of climate change due to increased emissions of greenhouse gases. Some studies concluded that rainfall had decreased in Zimbabwe due to global warming. For exam-ple, Unganai (1996) suggested that areal annual rainfall in Zimbabwe had declined by 10% between 1900 and 1994; and Makarau (1995) made a similar observation. Mason and Jury (1997) suggested that there was some evidence of desic-cation and increased rainfall variability. Chamaille-Jammes et al. (2007) carried out quantile regression of rainfall at three stations in north-western Zimbabwe and concluded that rain-fall during years with below average rainrain-fall was declining at two stations, and this was attributed to global warming. Van Wageningen and du Plessis (2007) made a similar conclu-sion regarding the 1961–2003 rainfall for Cape Town, South Africa. If these conclusions are valid, then planning and management of water resources systems have to adapt to the change of rainfall.
The decline in rainfall over the years as concluded by Makarau (1995), Unganai (1996), and Chamaille-Jammes et al. (2007) has however not been established in other studies carried out in Zimbabwe and other parts of Africa. Nichol-son (2000) noted that multidecadal variations of rainfall dur-ing the 1950–1989 period were similar to variations that oc-curred during the nineteenth century. Hulme et al. (2001) and Faucherean et al. (2003) did not find evidence of progressive desiccation in Africa. The presence of cyclic behaviour in southern African rainfall (Tyson, 1986), and the linkages be-tween rainfall and El Nino events (Mason and Jury, 1997; Nicholson, 2000; Nash and Endfield, 2008) are considered to explain partly the occurrence of droughts. What is un-certain is whether the general perception about the progres-sive desiccation in Zimbabwe is valid. Nash and Endfield (2002) noted that perceptions about the increasing severity
2672 D. Mazvimavi: Investigating changes over time of annual rainfall in Zimbabwe of droughts are often influenced by the tendency for humans
to compare recent drought years to previous wet periods dur-ing their lifetimes. Thus perceptions about droughts increas-ing in their frequencies and severity in Zimbabwe may be due to a comparison of the dry 1980’s and 1990’s to the wet 1970’s. The decline in agricultural output in Zimbabe dur-ing the 2000’s was suggested as evidence for increasdur-ing fre-quency and severity of droughts, but Richardson (2007) was of the view that this decline was mainly due to inappropriate government policies.
Previous studies (Makarau, 1995; Unganai, 1996) investi-gating the possible decline of rainfall in Zimbabwe used lin-ear regression which reflects changes around the mean value. Climate change effects may be noticeable through changes in the mean, or the variability of rainfall. New et al. (2006) es-tablished that changes of daily temperatures during the 1961 to 2000 period were much more evident in the tails of the distributions (hot and cold days) than in the average temper-atures of stations in west and southern Africa. A study that examines possible changes over time of rainfall during years with low and high rainfall will contribute towards the devel-opment of appropriate adaptation measures for such changes (Aguilar et al., 2009). This paper investigates the presence or absence of change points or trends in the rainfall received during (a) the early part of the wet season, (b) mid to end of the season, and (c) at the annual level. New et al. (2006) and Aguilar et al. (2009) highlighted that some changes in rain-fall over time may not be detectable at the annual interval, hence this study is also examining rainfall at the sub-annual interval. The outputs of this study will assist agricultural and water resources planners and managers to determine whether current problems of water availability are due to effects of natural climate variability, effects of enhanced greenhouse effects, or poor water resources management practices.
2 Material and methods
The annual time series investigated are the total rainfall for (a) the early part of the rainy season, October-November-December (OND), (b) middle to end of the rainy season, January-February-March (JFM), and (c) the whole year. The sub-annual rainfall times series have been selected since some changes may not be detectable in the total annual rain-fall. Rainfed crop production in Zimbabwe is done during the October to April period. Planting of most crops is done during the October to December period. Thus changes of the OND rainfall will affect the early stages of crop develop-ment, while changes of the JFM rainfall will affect the late stages of plant development. Thus the OND and JFM peri-ods were selected as they are critical for rainfed crop produc-tion. Annual and monthly rainfall data for 40 stations with records starting during the 1892 to 1941 period, and ending in 2000 have been used in this study (Fig. 1). The stations were selected in order to represent all the rainfall regions in
Zimbabwe. These rainfall regions were identified by Un-ganai and Mason (2001) who did principal component and cluster analysis of rainfall for several locations throughout the country. The regions reflect the influence of the moisture bearing airstreams from the west (Congo Air), north-east, and the south easterlies on the spatial patterns of rain-fall. Elevation does also affect rainfall distribution in Zim-babwe. The stations selected had data that had been quality controlled by the Department of Meteorological Services us-ing the standard methods recommended by the World Mete-orological Organization (WMO). Tyson (1986) identified an 18–20 year cycle in time series of annual rainfall for parts of southern Africa including Zimbabwe. The presence of cyclic behaviour or multidecadal variability in a short time series can be mistaken for a trend. Rainfall stations with over 60 years of data were therefore selected in order to minimize the risk of any cyclic behaviour being identified as a trend. Rainfall data for the period after the year 2000 was not read-ily available for some of the stations, and therefore the period of record considered in this study was up to the year 2000.
Changes in rainfall over time have the potential to change the median rainfall or introduce a trend. Therefore, statistical tests for determining a change in the median rainfall and the presence of a trend were used in this study. The Pettitt test for detecting changes in the median was used for this purpose. A description of this test is given in several references (Pettitt, 1979; Nechval and Nechval, 2000; Kundzewicz and Robson, 2004; Mazvimavi and Wolski, 2006) and is not repeated in this paper. Nechval and Nechval (2000) modified this test so that the location within a time series of the change point is identifiable. The non-parametric Mann-Kendall test which is capable of detecting both linear and non-linear trends (Kendall, 1976; Kundzewicz, 2004; Kundzewicz and Rob-son 2004) has been used in this study. Both the Pettitt test and Man-Kendal test have been used in other studies inves-tigating possible changes in rainfall over Africa (New et al., 2006; Conway et al., 2008).
D. Mazvimavi: Investigating changes over time of annual rainfall in Zimbabwe 2673
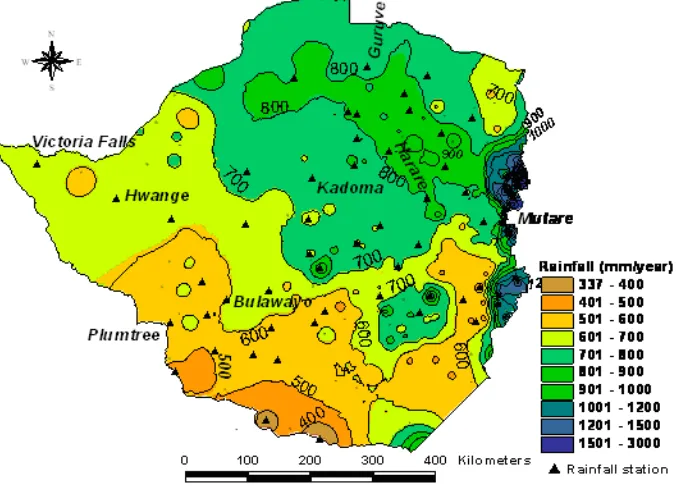
[image:3.595.130.468.66.309.2]Figure 1: Location of the 40 stations selected for analysis and the spatial variation of average annual rainfall in Zimbabwe.
Fig. 1. Location of the 40 stations selected for analysis and the spatial variation of average annual rainfall in Zimbabwe.
low rainfall. Quantile regression which was developed by Koenker and Basset (1978) is capable of identifying changes over time of any percentile value. Chamaille-Jammes et al. (2007) used the same method to investigate whether an-nual rainfall had changed over time. A full description of the quantile regression technique is given in Koenker and Bas-set, (1978), Buchinsky (1998), Koenker and Hallock (2001), Cade and Noon (2003), and Yu et al. (2003). In this method, we letY be a random variable which is the time series of an-nual rainfall, andθwith values in the 0≤θ≤1 range is the probability ofY being less than or equal toτ. Thereforeτ is theθth quantile or percentile ofY.We defineXas a covari-ate ofY, andτ or Y(θ|x) is theθth conditional quantile of
Y given thatX=x.Then the first order quantile regression model relatingY(θ|x) toXhas the following form;
Y (θ|x )=β (θ )0+β (θ )1X+ξ (1) whereβ(θ )0 is the intercept,β(θ )1is the slope coefficient and both vary depending on the value ofθth quantile or per-centile being considered. ξ is the error with the expectation of zero. The θth quantile regression estimate is obtained by minimizing the following function (Koenker and Basset, 1978; Buchinsky, 1998);
minimize1
n
( X
i:y≥xiβ
θ|yi−xiβ| +
X
i:yihxiβ
(1−θ )|yi−xiβ|
)
(2)
wheren= sample size,i= 1,2,...,n,yi= value of random vari-ableY,xi= value of random variableX. Koenker (2006) de-veloped the software, “quantreg”, written in R language for
undertaking quantile regression and is available for down-loading from http://www.r-project.org/. The parameters of the quantile regression model, which are the intercept and slope coefficients in Eq. (1) are estimated using the rank inverse method. Standard errors, confidence intervals, t -statistics, and p-values for these coefficients are also esti-mated by this software package.
For the purpose of detecting the presence or absence of trends of quantiles of OND, JFM, and annual rainfall,Xis the year of record in this study. Aβ(θ )1that is negative (pos-itive) and significantly different from zero is an indication that the θth quantile of rainfall is decreasing (increasing). For each rainfall station, the 10th, 20th, and 30th percentiles were considered to be indicators of low rainfall, while the 70th, 80th, and 90th percentiles were regarded as indicators of high rainfall. If the slope coefficient was significantly dif-ferent from zero at the 5.0% significance level, this was con-sidered as evidence of the decline or increase of rainfall. The quantreg software can derive intercepts and slope coefficients for anyθ value at each station. Quantile regression has the desirable attribute of being able to describe responses of both homoscedastic and heteroscedastic variables. If the depen-dent variable is homoscedastic, the slope parameter,β(θ )1, is constant for all quantiles (Fig. 2). For a heteroscedastic dependent variable, the slope parameter, β(θ )1, differs for different quantiles (θ) (Fig. 2).
2674 D. Mazvimavi: Investigating changes over time of annual rainfall in Zimbabwe
Figure 2: Quantile regression is capable of modelling a homoscedastic relationship
(left graph) with constant slope coefficient, β(θ)
1, for all quantile values, and a
heteroscedastic relationship which has different values of the slope coefficient for
different quantile values. The plotted lines show relationships for the 0.1, 0.2, 0.5,
0.7, and 0.9 quantiles.
Y
0.9
0.5
0.7
0.2
0.1
X
Y
X
0.5
0.9
0.7
0.2
0.1
Figure 2: Quantile regression is capable of modelling a homoscedastic relationship
(left graph) with constant slope coefficient, β(
θ
)
1, for all quantile values, and a
heteroscedastic relationship which has different values of the slope coefficient for
different quantile values. The plotted lines show relationships for the 0.1, 0.2, 0.5,
0.7, and 0.9 quantiles.
Y
0.9
0.5
0.7
0.2
0.1
X
Y
X
0.5
0.9
0.7
0.2
0.1
Fig. 2. Quantile regression is capable of modelling a homoscedas-tic relationship (top graph) with constant slope coefficient,β(θ )1, for all quantile values, and a heteroscedastic relationship which has different values of the slope coefficient for different quantile values. The plotted lines show relationships for the 0.1, 0.2, 0.5, 0.7, and 0.9 quantiles.
3 Results and discussion
Average annual rainfall (P )¯ at the selected stations varies
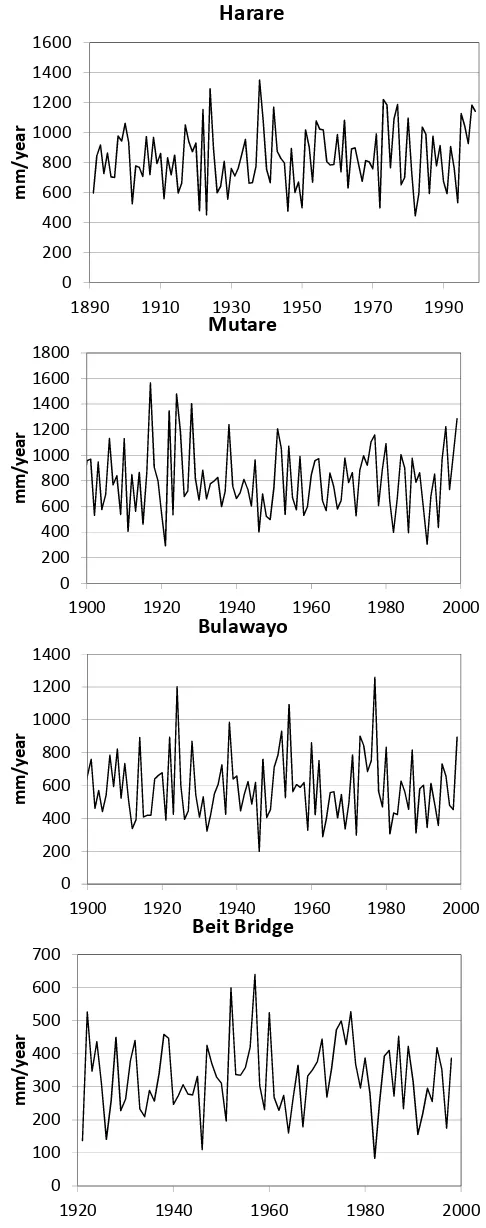
from 337 mm year−1 in the extreme southern part of the country to 1110 mm year−1 on the Eastern Highlands lo-cated along the eastern border of Zimbabwe and Mozam-bique (Fig. 1). Annual rainfall has high inter-annual vari-ability (Fig. 3), with the coefficient of variation being 23% to 40%. Figure 3 also shows the tendency for bunching of years with generally above average (e.g. 1951–1958, 1973– 1980) and below average (e.g. 1959–1970, 1982–1994). The annual rainfall at all the stations has however no significant
0 200 400 600 800 1000 1200 1400 1600
1890 1910 1930 1950 1970 1990
mm/y
ear
Harare
0 200 400 600 800 1000 1200 1400 1600 1800
1900 1920 1940 1960 1980 2000
mm/y
ear
Mutare
0 200 400 600 800 1000 1200 1400
1900 1920 1940 1960 1980 2000
mm/y
ear
Bulawayo
0 100 200 300 400 500 600 700
1920 1940 1960 1980 2000
mm/y
ear
Beit
Bridge
Figure 3: Variation of annual rainfall for Harare (
P
= 830 mm/year) in the northern central
part, Mutare (
P
= 801 mm/year) in the Eastern Highland, Bulawayo (
P
= 587 mm/year )in
the west, and Beit Bridge (
P
= 337 mm/year) in the southern most part.
Fig. 3. Variation of annual rainfall for Harare (P¯= 830 mm year−1) in the northern central part, Mutare (P¯= 801 mm year−1) in the
Eastern Highland, Bulawayo (P¯m= 587 mm year−1) in the west, and Beit Bridge (P¯= 337 mm year−1) in the southern most part.
D. Mazvimavi: Investigating changes over time of annual rainfall in Zimbabwe 2675
Table 1. Record lengths at stations selected for analysis with records beginning during the 1892 to 1941 period and ending in 2000.
Record Length (Years) No. of Stations
60–70 1 71–80 7 81–90 11 91–100 15 101–109 6 Total 40
[image:5.595.85.248.110.204.2]autocorrelation even for lags up to 20 years. Over 86% of the selected stations have rainfall data longer than 61 years, while 40% of the stations have over 100 years of data (Table 1).
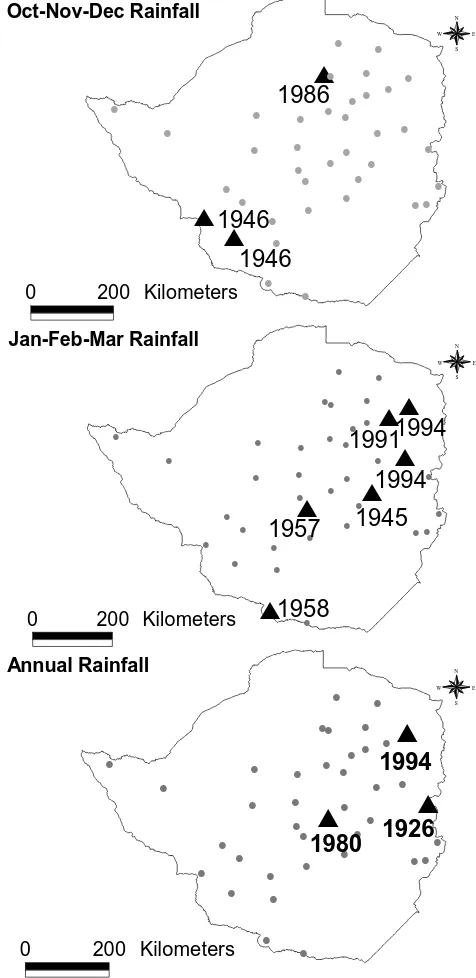
The Pettitt test identified significant change points or change of the median of the OND rainfall at three out of the 40 stations (Fig. 4). These change points were identified for the 1946/1947 season at two stations (Plumtree, Kezi) lo-cated on the western part, and in 1986/1987 for a northern station (Banket). Conway et al. (2008) also found a change point occurring in 1945 for the annual rainfall at Victoria Falls which is in the northwest. Significant change points for the JFM rainfall were identified at six stations with four of these being located on the eastern part of the country (Fig. 4). These change points have been identified for different years with the exception of two stations. The occurrence of change points in different years suggests that these changes are not due to a regional change of physical processes responsible for rainfall formation such as the atmospheric circulations. These change points could be due to changes in the exposure of rain gauges (Stott, et al., 2010). No significant change points in annual rainfall were identified except for three stations for the following periods 1926/1927, 1980/1981, 1994/1995 (Fig. 4). Stations for which change points have been identified in the OND, JFM, and in annual rainfall time series, are not located in geographically contiguous areas, while neighbouring stations do not have similar changes in the median. The change points have been identified at few stations, 7 to 14% of the total number of stations analysed which raises doubts about the physical significance of these changes.
The Mann-Kendall test did not identify any trend in the OND, and annual time series. A significant trend was identi-fied in the JFM time series at two out of 40 stations. Aguilar et al. (2009) also found no significant trend in several rain-fall indices derived from daily rainrain-fall including the total an-nual precipitation at stations in Zimbabwe. Similarly, New et al. (2006) found that very few stations in 14 African coun-tries studied had statistically significant trends in their rain-fall. The lack of trends in rainfall time series does not support
#
$
# # # # # # # # # # # # # # # # # # #$
# # # # # # # # #$
# # # # # # #1946
1946
1986
N E W S Oct-Nov-Dec Rainfall0 200 Kilometers
# # # # #
$
# # # # # # # # # # # # # # # # # # #$
#$
# # # #$
$
$
# # # #1994
1958
1957
1945
1994
1991
N E W S Jan-Feb-Mar Rainfall0 200 Kilometers
# # # # # # # # # # # # # # # # # # # # # # # # # #
$
$
$
# # # # # # # # # #1980
1994
1926
N E W S Annual Rainfall0 200 Kilometers
Figure 4: Location of stations (triangles) where change points were identified and
the year for which this change occurred is shown adjacent to the station.
Fig. 4. Location of stations (triangles) where change points were identified and the year for which this change occurred is shown ad-jacent to the station.
the conclusion that annual rainfall in Zimbabwe had decline by 10% between 1900 and 1994 (Unganai, 1996) or 100 mm from 1900 to 1992 (Makarau, 1995). Unganai and Maka-rau made this conclusion after analysing data that were then available up to 1994 and 1992 respectively. Both authors did not state the statistical significance level they used when ar-riving at these conclusions. It seems that the period of record
2676 D. Mazvimavi: Investigating changes over time of annual rainfall in Zimbabwe
1
0200 400 600 800 1000 1200
1930 1950 1970 1990
mm
/y
e
ar
1933
‐
1992
0 200 400 600 800 1000 1200
1930 1950 1970 1990
mm/
ye
ar
[image:6.595.51.287.63.376.2] [image:6.595.322.531.109.384.2]1933
‐
2000
Figure 5: Trend analysis of annual areal rainfall for Zimbabwe for the 1933-1992 and
1933 – 2000 period. The 1933-1992 period trend line is described by
Y
=772.6 – 1.01
X
(
r
2= 0.01) while the 1933-2000 period trend line is
Y
= 729.8 – 0.20
X
(
r
2= 0.0)
1
0200 400 600 800 1000 1200
1930 1950 1970 1990
mm
/y
e
ar
1933
‐
1992
0 200 400 600 800 1000 1200
1930 1950 1970 1990
mm/
ye
ar
1933
‐
2000
Figure 5: Trend analysis of annual areal rainfall for Zimbabwe for the 1933-1992 and
1933 – 2000 period. The 1933-1992 period trend line is described by
Y
=772.6 – 1.01
X
(
r
2= 0.01) while the 1933-2000 period trend line is
Y
= 729.8 – 0.20
X
(
r
2= 0.0)
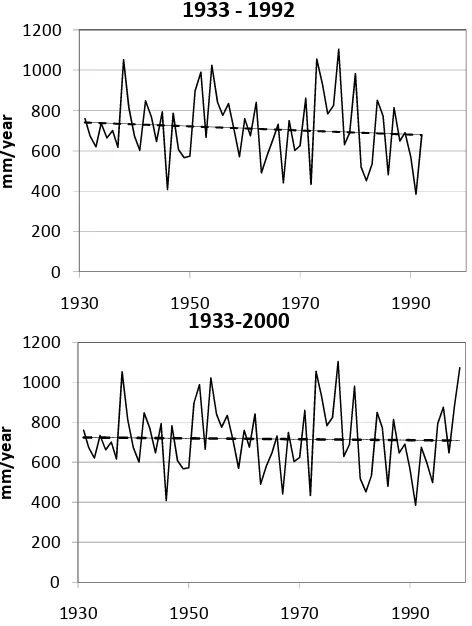
Fig. 5. Trend analysis of annual areal rainfall for Zimbabwe for the 1933–1992 and 1933–2000 period. The 1933–1992 period trend line is described byY= 772.6–1.01X(r2= 0.01) while the 1933– 2000 period trend line isY= 729.8–0.20X(r2= 0.0).
used influenced the result obtained. Figure 5 shows a trend analysis done using linear regression of average annual rain-fall for the whole country based on the period up to 1992 as was done by Makarau, and up to 2000. Based on the 1933– 1992 data the relationship between annual rainfall and year of record is
Y=772.6−1.01X r2=0.01 (3) Using the 1933–2000 data the relationship is
Y=729.8−0.20X r2=0.00 (4) whereY= average annual rainfall for Zimbabwe based on the 40 stations used in this study,X= number of years since 1900 following the definition of X in the Makarau study,
r2= coefficient of determination.
The slope coefficient in Eq. (3) has a value approximating that obtained by Makarau (0.8). The decline of areal annual rainfall that both Makarau and Unganai observed was heav-ily influenced by the low rainfall received during the 1982 to 1994 period. After this period, high rainfall was expe-rienced resulting in the decline no longer noticeable. This analysis illustrates one of the major difficulties of making
Table 2. Values of the slope coefficient (β(θ )1),t-statistic, and p-values for quantile regression of OND, JFM, and annual rainfall against year of record for stations where trends were significant.
Station θ β(θ )1 t-statistic p-value
OND (Oct-Nov-Dec)
Hwange 0.10 0.56 2.00 0.048 Plumtree 0.10 0.86 3.11 0.003 Wedza 0.20 −1.63 −2.32 0.023 Guruve 0.80 −1.10 −2.14 0.035 Guruve 0.90 −2.30 −3.16 0.002
JFM (Jan-Feb-Mar)
Mutare 0.10 −1.21 −2.03 0.045 Gutu 0.20 −2.03 −2.83 0.006 Gutu 0.30 −1.71 −2.11 0.037 Kadoma 0.30 −2.27 −2.34 0.022 Thuli 0.30 −1.19 −2.66 0.009 Mt Darwin 0.30 1.72 2.08 0.041 Buhera 0.90 −4.55 −2.67 0.009
Annual
Guruve 0.70 −2.74 −2.22 0.029 Guruve 0.80 −3.41 −2.50 0.014 Harare 0.80 2.04 2.37 0.020 Harare 0.90 2.06 2.41 0.018 Middle Save 0.80 3.69 2.17 0.033
inferences regarding changes of hydrological time series in that the record length may influence the conclusion made. Caution has therefore to be exercised regarding the presence of change and trends in hydrological time series particularly short time series.
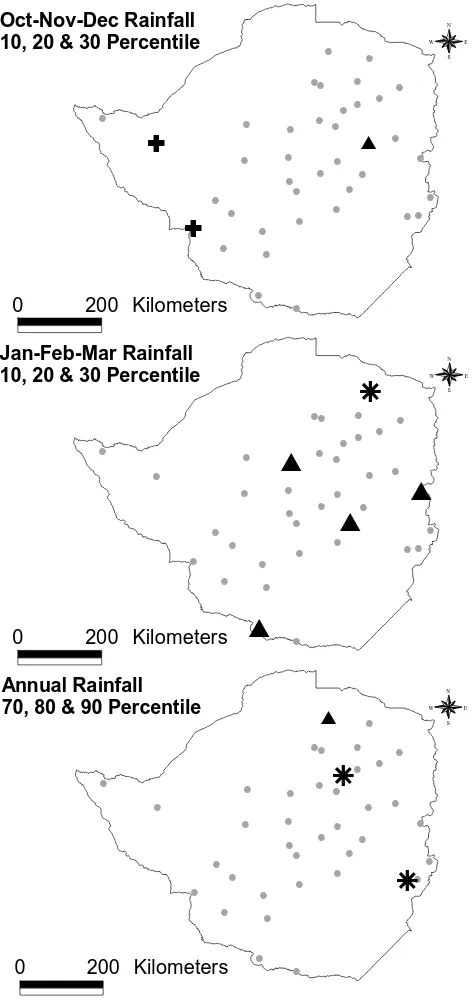
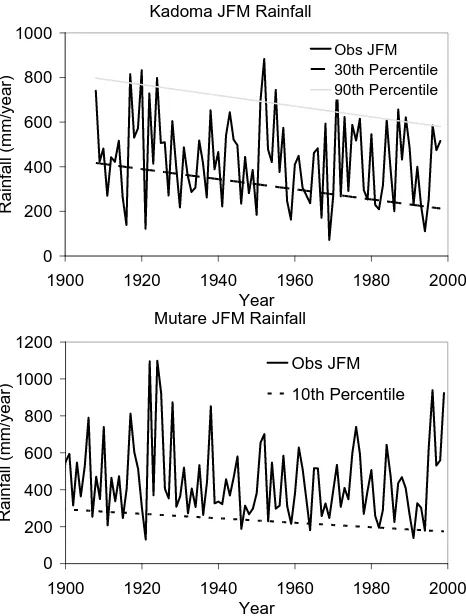
Quantile regression results show that the 10th percentile of the OND rainfall increased over time at two stations, Hwange and Plumtree, while the 20th percentile decreased at one sta-tion, Wedza (Figs. 6 and 7, Table 2). A decline in the 80th and 90th percentiles of OND rainfall was detected at one sta-tion (Guruve). Some decline of 10th to 30th percentiles of JFM rainfall were identified at five stations (Figs. 6 and 8), and a change in high JFM rainfall at one station, Buhera. The 70th and 80th percentiles of the annual rainfall were identi-fied as decreasing at one station (Guruve) on the northern part. An increasing trend of the 80th and 90th percentiles for annual rainfall at Harare was detected. (Fig. 9, Table 2).
The decline of the 20th percentile of OND rainfall was de-tected at one station. Four stations had significant decline in 10th, 20th and 30th percentiles of the JFM rainfall. The 80th and 90th percentiles of the OND rainfall decreased at one sta-tion, while the 90th percentile of the JFM rainfall decreased at one station. A decline in the 70th and 80th percentiles of total annual rainfall was detected at one station. The total
D. Mazvimavi: Investigating changes over time of annual rainfall in Zimbabwe 2677 # # # # # # # # # # # # # # # # # # #
Ñ
# # # # # # # # # # #Ñ
# # # #$
# # N E W S Oct-Nov-Dec Rainfall 10, 20 & 30 Percentile0 200 Kilometers
# # # # # # # # # # # #
r
# #$
# # #$
# # # # #$
# # # # # # #$
# # # # N E W S Jan-Feb-Mar Rainfall 10, 20 & 30 Percentile0 200 Kilometers
# # # # # # # # # # # # # # #
$
# #r
# # # # #r
# # # # # # # # # # # # # # N E W S Annual Rainfall 70, 80 & 90 Percentile0 200 Kilometers
Figure 6: Location of stations for which quantile regression identified a decreasing
(triangle) or increasing (cross or star) trend for low (10%, 20%, & 30% percentile)
and high (70%, 80% & 90% percentile) rainfall
# # # # # # # # # # # # # # # # # # #
Ñ
# # # # # # # # # # #Ñ
# # # #$
# # N E W S Oct-Nov-Dec Rainfall 10, 20 & 30 Percentile0 200 Kilometers
# # # # # # # # # # # #
r
# #$
# # #$
# # # # #$
# # # # # # #$
# # # # N E W S Jan-Feb-Mar Rainfall 10, 20 & 30 Percentile0 200 Kilometers
# # # # # # # # # # # # # # #
$
# #r
# # # # #r
# # # # # # # # # # # # # # N E W S Annual Rainfall 70, 80 & 90 Percentile0 200 Kilometers
Figure 6: Location of stations for which quantile regression identified a decreasing
(triangle) or increasing (cross or star) trend for low (10%, 20%, & 30% percentile)
and high (70%, 80% & 90% percentile) rainfall
Fig. 6. Location of stations for which quantile regression identi-fied a decreasing (triangle) or increasing (cross or star) trend for low (10%, 20%, and 30% percentile) and high (70%, 80% & 90% percentile) rainfall.
number of stations examined in this study is 40. Changes in percentiles have been detected at very few stations which does not provide convincing evidence that rainfall in Zim-babwe is declining due to global warming. Similarly, the evidence that high rainfall has declined is very weak, since only one station for OND and another for JFM rainfall show
Hwange OND Rainfall
0 200 400 600
1900 1920 1940 1960 1980 2000 Year Ra in fa ll ( m m /y e a r) OND 10th
Plumtree OND Rainfall
0 100 200 300 400 500 600 700
[image:7.595.50.286.62.563.2] [image:7.595.309.546.64.375.2]1910 1930 1950 1970 1990 Year Ra in fa ll ( m m/ y e ar ) OND 10th
Figure 7: An increasing trend detected for the 10
thpercentile of OND rainfall at
Hwange, and Plumtree.
Hwange OND Rainfall
0 200 400 600
1900 1920 1940 1960 1980 2000
Year Ra in fa ll ( m m /y e a r) OND 10th
Plumtree OND Rainfall
0 100 200 300 400 500 600 700
1910 1930 1950 1970 1990
Year Ra in fa ll ( m m/ y e ar ) OND 10th
Figure 7: An increasing trend detected for the 10
thpercentile of OND rainfall at
Hwange, and Plumtree.
Fig. 7. An increasing trend detected for the 10th percentile of OND rainfall at Hwange, and Plumtree.
such changes. The results of this study do not support the conclusion made by Chamaille-Jammes et al. (2007) that rainfall was declining in Zimbabwe due to global warming. Chamaille-Jammes et al. (2007) made this conclusion on the basis of quantile regression results at one station in Hwange National Park, in the north-western part of the country.
4 Conclusions
Rainfall records for the 1892 to 2000 period at 40 stations in Zimbabwe do not demonstrate evidence of changes in the median, high or low rainfall during the beginning (October to December), mid-to-end (January to March) of the rainy sea-son, and for the whole year. The very few stations which had evidence of changes of the median and some percentiles were located in different parts of the country, which is an indica-tion that the changes identified are not likely to be physically significant but could be due to changes of the exposure of rain gauges, e.g. increase in the built up area over time. Effects of global warming on rainfall that may have occurred are not yet statistically identifiable within the available rainfall time series. Other studies in Africa and Zimbabwe (New et al., 2006; Conway et al., 2008; Aguilar et al., 2009) made the
2678 D. Mazvimavi: Investigating changes over time of annual rainfall in Zimbabwe
Kadoma JFM Rainfall
0 200 400 600 800 1000
1900 1920 1940 1960 1980 2000 Year
Ra
in
fa
ll (mm/yea
r)
Obs JFM 30th Percentile 90th Percentile
Mutare JFM Rainfall
0 200 400 600 800 1000 1200
1900 1920 1940 1960 1980 2000 Year
R
a
in
fa
ll (m
m/ye
ar
)
Obs JFM
[image:8.595.51.284.63.371.2] [image:8.595.309.546.64.375.2]10th Percentile
Figure 8: A decreasing trend in the 30
thand 90
thpercentiles at Kadoma, and 10
thpercentile at Mutare for the JFM rainfall
.
Kadoma JFM Rainfall
0 200 400 600 800 1000
1900 1920 1940 1960 1980 2000 Year
Ra
in
fa
ll (mm/yea
r)
Obs JFM 30th Percentile 90th Percentile
Mutare JFM Rainfall
0 200 400 600 800 1000 1200
1900 1920 1940 1960 1980 2000 Year
R
a
in
fa
ll (m
m/ye
ar
)
Obs JFM
10th Percentile
Figure 8: A decreasing trend in the 30
thand 90
thpercentiles at Kadoma, and 10
thpercentile at Mutare for the JFM rainfall
.
Fig. 8. A decreasing trend in the 30th and 90th percentiles at Kadoma, and 10th percentile at Mutare for the JFM rainfall.
same conclusion. This does not imply that global warming will not cause changes of rainfall in Zimbabwe, but the ef-fects are not yet statistically significant within the available historical rainfall record. Effects of climate change on annual rainfall may not be statistically detectable due to the low sig-nal to noise ratio arising from the high interannual variability of rainfall in Zimbabwe.
The results of this study show that the long-term average input of rainfall into the land phase of the hydrological sys-tem has not changed. However, anthropogenic changes of land use and land cover, accelerated soil erosion resulting in increased siltation rates have in some cases adversely af-fected the available water resources (Schulze, 2000). These adverse effects are sometimes erroneously attributed to the decline of rainfall. Human and livestock populations in southern Africa increased tremendously during the twenti-eth century, but with no commensurate increase in resilience against droughts and floods. Consequently, the numbers of people and livestock adversely affected by droughts and floods have been increasing which is again perceived as evi-dence for increasing frequency and severity of droughts. The perception about gradual desiccation can also be a symptom of an environmental nostalgia resulting in the past being con-sidered to have been wetter than the current period.
Harare Annual Rainfall
0 200 400 600 800 1000 1200 1400 1600
1890 1910 1930 1950 1970 1990
Year
Ra
in
fa
ll (mm/yea
r)
Obs Annual 80th 90th
Middle Save Annual Rainfall
0.0 200.0 400.0 600.0 800.0 1000.0
1920 1940 1960 1980 2000
Year
Rainfall (mm/year) Obs Annual 80th percentile
Figure 9: An increasing trend for the 80
thand 90
thpercentiles of annual rainfall at
Harare and 80
thpercentile of annual rainfall at Middle Save.
Harare Annual Rainfall
0 200 400 600 800 1000 1200 1400 1600
1890 1910 1930 1950 1970 1990 Year
Ra
in
fa
ll (mm/yea
r)
Obs Annual 80th 90th
Middle Save Annual Rainfall
0.0 200.0 400.0 600.0 800.0 1000.0
1920 1940 1960 1980 2000
Year
Rainfall (mm/year) Obs Annual 80th percentile
Figure 9: An increasing trend for the 80
thand 90
thpercentiles of annual rainfall at
Harare and 80
thpercentile of annual rainfall at Middle Save.
Fig. 9. An increasing trend for the 80th and 90th percentiles of annual rainfall at Harare and 80th percentile of annual rainfall at Middle Save.
D. Mazvimavi: Investigating changes over time of annual rainfall in Zimbabwe 2679
Acknowledgements. The author is grateful for the data provided by the Department of Meteorological Services of Zimbabwe. Comments by the editor and reviewers assisted in improving the quality of this paper.
Edited by: A. Opere
References
Aguilar, E., Aziz Barry, E., Brunet, M., Ekang, L., Fernan-des, A., Massoukina, M., Mbah, J., Mhanda, A., do Nasci-mento, D. J., Peterson, T. C., Thamba Umba, O., To-mou, M., and Zhang, X.: 2009. Changes in temperature and precipitation extremes in wester, central Africa, Guinea Conakry, and Zimbabwe, J. Geophys. Res., 114(11p), 1955– 2006, doi:10.1029/2008JDO11010, also available: http://www. agu.org/journals/ABS/2009/2008JD011010.shtml, 2010 Buchinsky, M.: Recent advances in quantile regression models: A
practical guide for empirical research, J. Hum. Resour., 33(1), 88–126, 1998.
Cade, B. S. and Noon, B. R.: A gentle introduction to quantile regression for ecologists, Front Ecol. Environ., 1(8), 412–420, 2003.
Chamaille-Jammes, S., Fritz, H., and Murindagomo, F.: Detect-ing climate changes of concern in highly variable environments: Quantile regressions reveal that droughts worsen in Hwange Na-tional Park, Zimbabwe, J. Arid Environ., 71, 321–326, 2007. Conway, D., Persechino, A., Ardoin-Bardin, S., Hamandawana, H.,
Deulin, C., and Mahe, G.: Rainfall and water resources vari-ability in sub-Saharan Africa during the 20th century. Working Papaer 119, Tyndall Centre for Climate Change Research, Uni-versity of East Anglia, UK, 2008.
Fauchereau, N., Trzaska, S., Rouault, M., and Richard, Y.: Rainfall Variability and Changes in Southern Africa during the 20th Cen-tury in the Global Warming Context, Natural Hazards Journal, 29(2), 139–154, 2003.
Hulme, M., Doherty, R. M., Ngara, T., New, M. G., and Lister, D.: African climate change: 1900–2100, Clim. Res., 17, 145–168, 2001.
Kendall, M.: Time series, Griffin, London, 1976.
Koenker, R.: Quantile regression in R: A vignette, http://www.econ. uiuc.edu/∼roger/research/rq/vig.pdf, 2006.
Koenker, R. and Bassett, G.: Regression quantiles, Econometrica, 46(1), 33–50, 1978.
Koenker, R. and Hallock, K. F.: Quantile regression, J. Econ. Per-spect., 15(4), 143–1456, 2001.
Kundzewicz, Z. W.: Searching for change in hydrological data, Hy-drolog. Sci. J., 49(1), 3–6, 2004.
Kundzewicz, Z. W. and Kaczmarek, Z.: Coping with hydrological extremes, Water International, 25(1), 66–75, 2000.
Kundzewicz, Z. W. and Robson, A. J.: Change detection in hydro-logical records – a review of the methodology, Hydrol. Sci. J., 49(1), 7–19, 2004.
Kundzewicz, Z. W., Budhakooncharoen, S., Bronstert, A., Hoff, H., Lettenmaier, D., Menzel, L., and Schulze, R.: Coping with vari-ability and change: floods and droughts, Nat. Resour. Forum, 26, 263–274, 2002.
Mason, S. J. and Jury, M. R.: Climatic variability and change over southern Africa: a reflection on underlying processes, Prog. Phys. Geog., 21(1), 23–50, 1997.
Makarau, A.: Intra-seasonal oscillatory models of the southern Africa summer circulation, Unpublished PhD Thesis, University of Cape Town, 1995.
Mazvimavi, D. and Wolski, P.: Long-term variations of annual flows of the Okavango and Zambezi Rivers, Physics and Chem-istry of the Earth Journal, 31, 944–951, 2006.
Nash, D. J. and Endfield, G. H.: A 19th century climate chronology for the Kalahari Region of central southern Africa derived from missionary correspondence, Int. J. Climatol., 22, 821–841, 2002. Nash, D. J. and Endfield, G. H.: Splendid rains have fallen: links between El Nino and rainfall variability in the Kalahari, 1849– 1900. Climatic Change, 86, 257–290, 2008.
Nechval, N. A. and Nechval K. N.: Detecting a change point in a sequence of small area statistics, Statistics in Training, 4(4), 699–710, 2000.
New, M., Hewitson, B., Stephenson, D. B., Tsiga, A., Kruger, A., Manhique, A., Gomez, B., Coelho, C. A. S, Masisi, D. N., Ku-lulanga,, Mbambalala, E., Adesina, F., Saleh, H., Kanyanga, J., Adosi, J., Bulane, L., Fortunata, L., Mdoka, M. L., and Lajoie, R.: Evidence of trends in daily climate extremes over Southern and West Africa, J. Geophys. Res., 111, 1–11, 2006.
Nicholson, S. E.: The nature of rainfall variability over Africa on time scales of decades to millennia, Global Planet. Change, 26, 137–158, 2000.
Pettitt, A. N.: A non-parametric approach to the change-point prob-lem, Appl. Statist., 28(2), 126–135, 1979.
Radziejewski, M. and Kundzewicz, Z. W.: Detectability of changes in hydrological records, Hydrolog. Sci. J., 49(1), 39–51, 2004. Richardson, C. J.: How much did drought matter? Linking rainfall
and GDP growth in Zimbabwe, African Affairs, 106/424, 463– 478, 2007.
Schulze, R. E.: Modelling hydrological responses to land use and climate change: A southern African perspective, Ambio, 29(1), 12–22, 2000.
Stott, P. A, Gillett, N. P, Hegerl, G. C., Karoly, D. K, Stone, D. A., Zhang, X., and Zwiers, F.: Detection and attribution of climate change: a regional perspective, WIREs, Clim. Change, 1, 192– 211, 2010.
Tyson, P. D.: Climatic change and variability in southern Africa, Oxford University Press, Cape Town, 1986.
Unganai, L. S.: Historic and future climatic change in Zimbabwe, Clim. Res., 6, 137–145, 1996.
Unganai, L. S. and Mason, S. J.: Spatial characterization of Zim-babwe summer rainfall during the period 1920–1996, S. Afr. J. Sci., 97, 425–431, 2001.
Van Wageningen, A. and du Plessis, J. A.: Are rainfall intensities changing, could climate change be blamed and what could be the impact for hydrologists?, Water SA, 33(4), 571–574, 2007. Yu. K., Lu, Z., and Stander, J.: Quantile regression: Application and
current research areas, The Statistician, 52(3), 331–350, 2003.