A N E X P E R I M E N T A L I N V E S T I G A T I O N O F P R O P A G A T I O N O F W E A K SETOCI< W A V E S
IN A RANDOM MEDIUM
T h e s i s by
L a m b e r t u s H e s s e l i n k
I n Partial Fulfillkment of t h e R e y u i r e m e n t s F o r t h e D e g r e e of
D o c t o r of P h i l o s o p h y
C a l i f o r n i a I n s t i t u t e of Technology Pasadena, C a l i f o r n i a
ACKNOWLEDGEMENTS
The advice and wise counsel given by many people during the course of this experiment a r e gratefully acknowledged,
The author's advisor
,
P r o f e s s o r Hans Liepmann, and P r o f e s s o r Bradford Sturtevant, provided inspiration, guidai~ce and encouragement. 1 a m indebted to them f o r t h e i r help with this r e s e a r c h project, t h e i r invaluable contributions to m y education and t h e i r friendship.P r o f e s s o r Donald Coles' stimulating advice, En p a t t i c u l a r regarding experimental techniqu.es, his i n t e r e s t in the project and lais friendship a r e greatly appreciated.
The author wishes to thank P r o f e s s o r Nicholas George and Dr. Vijay Kulkarny; interesting discussions with them contributed to my unders tanding of the phenomenon under inves tigatioi?.
Special thanks go to the technical staff of CALCIT for their a s s i s t a n c e with the experimental apparatus, It i s a l s o a g r e a t pyeasure to thank Mrs. Jacquelyn Eeard and M r s . Karen Cheetham for t h e i r excellent typing, M r s . Betty Wood for h e r splendid dratv- ings, and P r o f e s s o r Bradford Sturtevant f o r his constructive
criticism during the preparation of the manuscript.
The financial a s s i s t a n c e of the California Institute of Technology- the Josephone de Karman t r u s t fund, and the A i r Fovce Office of
Scientific Research, which a l s o sponsored the project i s g r a t e f d l y acknowledged.
iii
ABSTRACT
An apparatus has been constructed f o r generating a 2 5 cm cube of randomly inhomogeneous gas in the GALCIT 17--inch
diameter shock tube. It consists of a two-dimensional 7 x 8 a r r a y of fine jets alternately of helium and freon-12 behind c o a r s e grids located on opposite sides of a box. The two other side walls of the box a r e fitted with optical windows f o r diagnostics. The up- s t r e a m and downstream faces of the box a r e movable and can be opened rapidly just before shock a r r i v a l . This p r o c e s s i s automated, and the a r r i v a l t i m e of the shock wave relative to the decay of the turbulent density field can be varied. The gas mixture i s made neutral1.y buoyaj~t s o that the mean interface between the scattering
region and the uniform ail- ia the shock tube i s p a r a l l e l to the plane of the incoming wave. F u r t h e r m o r e , the m e a n acoustic impedance of the mixture i s matched to that of the quiescent a i r i n the shock tube to minimize the effect of the a i r - g a s mixture interface on the shock wave.
In
this experiment shock waves of strengths varying f r o m M = 1 . 007 to 1. 1 s c a t t e r frorri randorn variations of acousticals
impedance and index of refraction (defined au the ratio of the sound speed in a i r tR, the local, variable, sound speed in the scattering medium) which occur during the turbulent mixing of the two different gases. The s c a l e and amplitude of the fluctuations before i n t e r - action with the shock wave a r e obtained f r o m optical and point den-
and schlieren pictures, and the Brown-Rebollo (Ref. 11) density probe i s used to m e a s u r e local mean and r m s density fluctuations, and space- and c r o s s - correlation functions.
To study the interaction of the shock with the turbulence, s p a r k shadowgraph and schlieren pictures have been taken and p r e s s u r e m e a s u r e m e n t s have been made. A.rrays of p r e s s u r e
t r a n s d u c e r s located in a f a l s e endwall downstream of the scattering volurne r e c o r d the shock front topology and the spatial variation of
shock amplitude.
The p r e s s u r e m e a s u r e m e n t s indicate a substantial modifica- tion of the unperturbed shock profile. Data a r e presented which indicate the effect of the Mach number on the scattering process.
v
T A B L E O F CONTENTS
C h a p t e r T i t l e
Acknowledgernents A b s t r a c t
T a b l e of C o n t e n t s L i s t of F i g u r e s L i s t of T a b l e s INTRODUCTION
1. 1 Motivation f o r t h e R e s e a r c h 1 . 2 R e s e a r c h G o a l s
DESIGN O F T H E E X P E R I M E N T 2. 1 O b j e c t i v e s
2. 2 T u r b u l e n t M i x e r
2. 2. 1 G e n e r a l D e s c r i p t i o n
2. 2. 2 R e f r a c t i v e I n d e x F l u c t u a t i o n s 2. 2. 3 F l o w C o n t r o l S y s t e m
2. 2. 4 T h e G r i d s 2. 2. 5 T h e S h u t t e r s
2. 2.
6
T h e O p t i c a l Windows 2. 2. 7 T h e C o o k i e - C u t t e r2 . 2 . 8 Shock T u b e F i r i n g M e c h a n i s m 2. 3 E l e c t r o n i c C o n t r o l S y s t e m f o r t h e
T u r b u l e n t M i x e r 2. 3. 1 O b j e c t i v e s
2. 3. 2 D e s c r i p t i o n of t h e E l e c t r o n i c C i r c u i t r y
P a g e
. .
11 iii v X xiv 1 [image:5.571.54.538.44.734.2]TA.BLE OF CONTENTS (Continued)
Chapter Title
2 . 4 Experimental P r o c e d u r e
2, 5 Performance of the Experimental Facility
3 . 1 Scope
3. 2 Aspirating Density P r o b e
3. 3 Optical Measurements
3. 3. 1 Optical P r o c e s s o r
3. 3. 2 Schlieren System
3 . 3 . 3 Shadowgraph System
3. 3. 4 Optical C o r r e l a t o r
3. 3, 5 Optical F o u r i e r T r a n s f o r m Photography
3 . 4 P r e s s u r e Measurements
3 , 4 . 1 P r e s s u r e T r a n s d u c e r Mounts 3. 5 Data A.cquisition System
DATA ACQUISITION AND PROCESSING 4. 1 Scope
4. 2 Point Density hleasuremente
4. 2. 1 Data Acquisition P r o c e d u r e
4 . 2. 2 Computer Calculation of the Mean
and rm s Concentration Profiles 4. 2. 3 Cornputer Calculation of C r o s s -
and Space- Correlation Functions 4. 3 Optical Ivleasurements
4. 3. 1 Measurement of the Shadowgraph and SchPieren P i c t u r e Correlation Function
T A B L E O F CONTENTS (C;ontin~.~ed)
Chapter Title
4. 3. 2 @alcrxIati.o~~ of the Micro.acale for the D e n s i t y Field Using the Sha.dowgraph P i c t u r e Correlation Function
4, 3. 3 Calc1~1;~tion of a. Length Scale f o r the Dtnsity Field 'LTsing Optical. Four-ie2 Tsrat~sform Photc3grapfiy 4.4 P r e s s u r e ,Measnrements
4,4. 1 Data Acquisition P r o c e d u r e 4.4,2 Data Reduction Scheme EOT
P r e s s u r e Signals in the Scattered "bVsve Field
V @I.IA.RPACTERIZA TION
OF
T.HE SCATTERING M E D I u n l5, S Scope
5. 2 Experirrsental P r o c e d u r e f o r T~mirmg the Flow Control. Sy-etem
5, 3. I. Mean a n d s m s l3en.ait.y P r o f i l e s
5.
3 . 2 Shutter Opening Effects5 . 3 , 3 C r o s s - a n d Space - C o r r e l a t i o n F w c t i e n s
5, 3. 4 Length Scales 0btai.iied f r o m the Optical Measurerne?its
5. 4 Surrlrnary of the Xesults C h a r a c t e r i z i n g the Selected Scattering Mectium
V l EFFECTS O F THE S C A T T E R I N G 3,&!3DIU$.ri ON T E E SHOCIC W A V E
6 . l
Scope6 . 2
Kepreeentative P r e s s u r e Data P r o f i l e sP a g e
[image:7.561.78.520.60.733.2]TA.BLE OF CONTENTS (Continued,)
Chapter Title
6.
3 C h a r a c t e r i s t i c s of the Scattered Wave Field6.
3. 1 Shock Amplitude Results6 .
3. 2 Peak Amplitude Results6.
3. 3 Shock Wave F r o n t Topology Results6.
3. 4 Wave F r o n t Thicknes r Resv-lts6.
3. 5 Peak Width Results6.
3 . 6
SchPieren and ShadowgraphP i c t u r e s
6 . 4 Comparison ~f the Shock F r o n t Topology R e s d t s with Geometrical A.coustics
Theory
VTI EFFECTS OF THE $1-IOCK WAVE ON THE
SCATTERING MEDIUM
7. 1 Scope
'7. 2 Scale Changes i.n the 1)ensity Field Induced by the Shock Wave
7. 2, 1 Data Obtained f r o m Schlieren P i c t u r e s
7. 2. 2 Data Obtained f r o m Shado~vgraph P i c t u r e s
VIII CONCLUSIONS
Appendix A Details of Experimental Apparatus
P a g e
C h a p t e r
T a b l e s F i g u r e s R e f e r e n c e s
TA.BLE O F CONTENTS (Continued) T i t l e
A.4 S h u t t e r Drive M e c h a n i s m
A5 T h e Shock Tube F i r i n g M e c h a n i s m A6 E l e c t r o n i c C o n t r o l C i r c u i t r y
A7 N o r m a l Operating Conditions Appendix B I n s t r u m e n t a t i o n
B l D e n s i t y P r o b e B2 S c h l i e r e n S y s t e m B3 Optical C o r r e l a t o r
B4 Data Acquisition S y s t e m
Page 88
88
88
LIST O F FIGURES N u m b e r
1 . 1
T i t l e P a g e
T y p i c a l T h e o r e t i c a l l y P r e d i c t e d Sonic Boom 3 P r e s s u r e P r o f i l e
T y p i c a l R e c o r d e d Soriic Boom P r e s s u r e P r o f i l e s 4 S c h e m a t i c of a n Optical P r o c e s s o r 25 P r e s s u r e T r a n s d u c e r Mounting Plug 103 F a l s e Endwall f o r P r e s s u r e T r a n s d u c e r s 104 Optical Setup f o r F o u r i e r T r a n s f o r m Photography
.
41 S c h e m a t i c P r e s s u r e P r o f i l e 43 Wave F r o n t Showing P r e c u r s o r 44 S c h e m a t i c P r e s s u r e P r o f i l e Showing a 45 P e a k e d Wave F r o n tDensity P r o b e Locations 105
Mean and R m s D e n s i t y P r o f i l e 1 06
Mean Concentration a s a Function of the Height 107 above the Bottom
Mean and K m s Density P r o f i l e Showing S h u t t e r 108 Effect
R a w D e n s i t y Data ( J e t s On) 109
R a w Density Data ( J e t s Off) 110
S p a c e - C o r r e l a t i o n Function 111 C r o s s - C o r r e l a t i o n Function (M = 3.2 c m ) 112 E x a m p l e of Shadowgraph C o r r e l a t i o n Function 113 T h e Effect of t h e Decay T i m e of the Density 114 F l u c t u a t i o ~ l s on the Shock Wave
R e p r e s e n t a t i v e P r e s s u r e T r a c e s M e a s u r e d i n 11 5 F a l s e Endwall (Horiz. 20 p s e c / c r n )
H i s t o g r a m s of N o r m a l i z e d Shock P r e s s u r e s as 11
6
LIST O F F I G U R E S (Continued)
Title Page
117 Histograms o.E Normalized Shock P r e s s u r e s
a s a Function of Mach N.urnber (Measured n e a r Endwall)
E x t r e m e Values of Normalized P r e s s u r e s a s a Function of Mach N u n b e r (Measured n e a r Downstream Shlutter)
E x t r e m e Values of Normalized P r e s s u r e s a s a Function of Mach Nurnber (Measured nea,r Endwall)
Histograrr~s of Normalized P e a k P r e s s u r e s a s a Function of Mach Nurnber (Measured n e a r Downstream Shutter)
Histograms of Normalized Peak P r e s s u r e s a s a Function of Mach Number (Measured n e a r Endwall)
Histograms f o r the Time Lag of the Peak P r e s s u r e behind the F r o n t (Measured n e a r D0wnstrea.m Shutter)
Mean Values for the Time Lag between Peak and Shock F r o n t P r e s s u r e s (Measured n e a r Downstream Shutter)
R m s A r r i v a l Time Fluctuations a s a Function of Mach N - m b e r
Histogram of Shock Rise Times (M
=
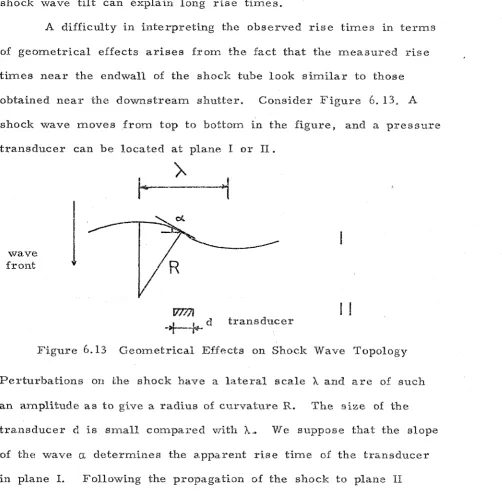
1. 007) sGeoinetrical Effects on Shock Wave Topology Schlieren Photograph of M = 1. 03 Unperturbed Shock Moving f r o m Right ?o Left
Shadotvgraph Photograph of 1aS = 1, 007 Shock Vthich i s 1ndistinguishabl.e f r o m the Turbulence Shadowgraph Photograph of Ms = 1. 03 Shock Moving f r o m Right to Left
LIST O F F I G U R E S (Continued) Number
6.
18A.. 8
A..
9
A. 1.0 A,. 11 A. 12 A.. 13 A.. 14
Title
Schlieren Photograph of hf = 1. 007 Shock Which i s Indistinguishable %rom the Turbulence Schlieren Photograph of Ms = 1. 03 Shock
Moving f r o m Right to Left
Schlieren Photograph of Ms = 1 . 1 Shock Moving f r o m Right to Left
Horizontal C r o s s Section and Top View of Turbulent Mixer
Schematic End View (Endplate Removed) Photograph of Turbuf ent Mixer Units Photograph of Shutter Assembly (Open] Photograph of Plenum Chamber and Grid Photograph of Turbulent Mixer
Schematic of Shutter Assembly ( F a c e P l a t e of Bottom Shutter Blade Kerrloved)
Schematic Flow Control. Sys t e m f o r Turbulent Mixer
Groove P a t t e r n in the Vertical Sidewalls of the Mixing Zone
Schematic of Grid Drive Mechanism Schematic of Shutter Drive M-echanism Window Locations
Shock Tube Firing Mechanism
Schematic of Electronic Control Systern for the Turbulent Mixer
Schematic of a Single Channel Density P r o b e
Side View Schlieren System
xiii
LIST O F F I G U R E S ( C o n t i n u e d )
N ~ z n b e r T i t l e
B. 3 D e t a i l s S c h l i e r e n S y s t e m B. 4 O p t i c a l C o r r e l a t o r
B. 5 P h o t o g r a p h of O p t i c a l C o r r e l a t o r B.
6
D a t a A c q u i s i t i o n SchemeP a g e 150 151.
1. Length Scales Obtained f r o m P i c t u r e Correlation Functions
2. Changes in Turbulence Length Scales Induced by the SIIOC!~ Wave 3. L i s t of T r a c e s with P r e c u r s o r s
4. Mean Value f o r the A r r i v a l T i m e Difference between P r e s s u r e Gauges Mounted in F a l s e Endwall
5. P e a k Widths Behind Amplified Shocks
I. INTRODUCTION
1 . 1 Motivation f o r the R e s e a r c h
With the i n c r e a s i n g need during the l a s t 30 y e a r s to u n d e r - stand the m e c h a n i s m s of acoustic -wave propagation i n the oceans and a t m o s p h e r e a n d / o r radio-wave propagation i n the atmosphere, the theory of wave propagation in random m e d i a h a s been exten- sively developed and verified by experiment. Contemporary
applications i n technology, incluaing propagation of sonic boom and b l a s t waves through the e a r t h ' s turbulent boundary layer, transonic
shock-boundary l a y e r interaction, and l a s e r corn-munications and energy conversion have fueled continuing i n t e r e s t in the field.
The m a j o r difficulty, of course, deriving f r o m the i m p o s s i - bility of c h a r a c t e r i z i n g the random rnediwn i n complete detail, i s the question of what p r o p e r t i e s of the medium m u s t be specified i n o r d e r to obtain d e s i r e d information about the wave field. F o r the c a s e in which fluctuations of index of r e f r a c t i o n in the medium and the resulting p e r t u r b a t i o n s of the wave field a r e small, the theory i s r a t h e r complete (Chernov, Ref. 1). This i s l i n e a r o r single- s c a t t e r i n g theory, i n which the s c a t t e r e d waves a r e of s~-nall
arnplifxde or, i n the alternative terminology of g e ~ m e t ~ i c a l acoustics, the deflection of the r a y s n o r m a l to the wave f r o n t s i s s m a l l ,
p r e d i c t shock amplitude (of p r i m a r y importance i n determining the environmental impact of the sonic boom), consideration of imultiple s c a t t e r i n g i s n e c e s s a r y . In the termiiiol.ogy of g e o m e t r i c a l acous
-
tics, the small-amplitude theory does not provide f o r focusing of wave fronts, which surely m u s t o c c u r when p e r t u r b a t i o n s of v a v e - front geometry become sufficiently l a r g e . It i s not knowri whats c a l e s of turbulence might lead to important focusing effects in any given situation, o r indeed, what the effect of focusing might be on the s t a t i s t i c s of wave f r o n t geometry and perturbation amplitude. I n particular, t h e r e a r e no experimenta,l. r e s u l t s available which provide any information about the effects of second - o r d e r s c a t t e r i n g o r gas-dynamic nonlinearity on the propagation of weak shock waves through random media.
Keller (Ref. 3 ) h a s reviewed the t h e o r i e s available f o r t r e a t i n g p r o b l e m s in which the randorn v a r i a t i o n s a r e not srnall. In m o s t a n a l y s e s averaged equations a r e f o r m e d which yield solu- tions i n t e r m s of the m o m e n t s of the unknowns. This procedure i s p r e c i s e l y analogous to the construction of the m e a n equations of motion for turbulence, and yields a hierarcliy of molneiit equations which m u s t be broken a t s o m e level by a c l o s u r e a p p r o x i ~ ~ i a t i o n ,
Conside ratjon of the sonic -boom p m b l en3 affords a conven- iex-rt point of view f o r illustrating the f e a t u r e s of shocli: propagation i n a randorn medium, Some r e s u l t s f r o m sonic-boom theory and e ~ p e r ~ n e n t , which a r e r e l e v a ~ t t o t h . ~ c u r r e n t study, will be briefly discussed.
An airplane which f l i e s zupersonically i n s uniform a t n ~ o s - g h e r e g e r l e ~ a t e s p r e s s u r e wave which a t l a r g c d j s t a n c c : ~ drorn the a i r c r a f t has an N - shap-rl: profiT+. f;Vhitlzam, Rc:f. 4
1,
coilsisting o f arz expansion wave sandwiched between two shcclr waves, An N-wave with amplitude and time s c a l e typical of that predicted to occur 0x1the e a r t h ' s s u r f a c e under a sujj~ersonic tr a n s p o r t flying at c r u i s e altitude i s shown in Figure I . I ,
F i g u r e 1. I Typical .rheoreticaPiy P r e d i c t e d Sonic boon^ P r e s s u r e P r o f i l c ,
c a t e g o r i e s (Fig. 1 . 2 a) peaked, b) rounded9 and c ) normal,
F i g u r e 1.2. Typical Recorded Sonic Boom P r e s s u r e P r o f i l e s .
F o r the purpose of studying the modifications of the N-wave, the interaction of a single shock with turbulence can be considered. Crow ( E k f . 2 ) f i r s t formulated a single-scattering theory which explained many f e a t u r e s of the flight-test observations. However, i n s o m e c a s e s documented by Maglieri, the r i s e t i m e of the initial d i s t u r b a n c e on the IV-wave i s observed to be up to t h r e e o r d e r s of magnitude g r e a t e r than the shock thickness predicted by the Navier-
[image:18.586.48.541.57.523.2]S e v e r a l i n v e s t i g a t o r s have proposed t h e o r i e s to explain t h e s e r e s u l t s , Crow pointed out that second - o r d e r s c a t t e r i n g theory
contains shock thickening, and George and Plotkin (Ref.
6 )
developed a s e c o n d - o r d e r perturbation s c h e m e which led to a B u r g e r s - t y p e equation f o r the wave s t r u c t u r e , with the m o l e c u l a r viscosity replaced by a viscosity-like t e r m depending on p r o p e r t i e s of the e a r t h ' s turbulent boundary l a y e r . P i e r c e (Ref. 7 ) suggested that the apparent r i s e t i m e s could be explained by g e o m e t r i c a l effects, but h i s idea h a s not been developed in any detail, He proposed that the peaked and rounded profiles m e a s u r e d i n s o n i c boom e x p e r i m e n t s can be explained i n t e r m s of fucusing and dcfocusing of the incident shock front. The i n c r e a s e d r i s e t i m e of the initia.1 disturbance i s a c c o u ~ t e d f o r by the o c c u r r e n c e of multiple fclded wave f r o n t s .Ffowcs Williams and Howe (Ref. 8 ) introduced a s t a t i s t i c a l a r g u m e n t to show that the shoclc thickness predicted by George and Plotkin i s a n i r r e l e v a n t upper bound and i s a r e s u l t of the apparent m e a n diffusion irlduced by random convection of a s h a r p wave front around i t s nominal position. F u r t h e r m o r e , they conclude that turbulence cannot be responsible f o r the observed shock thiclines s, and that a wave-front-folding m e c h a n i s m i s too slow to be effective i n the p r a c t i c a l sonic boom situation, They propose that the
unfortunately, this quantity i s not routinely m e a s u r e d during flight t e s t s .
This investigation was designed to provide additior1a.l infor- mation of the propagation of weak shock waves through a random medium, F o r this purpose a c l a s s i c a l scattering configuration i s chosen and waves s c a t t e r f r o m random variations of acoustical impedance and index of refraction (defined a s the r a t i o of the sound speed i n a i r t o the local, variable sound speed in the scattering medium) which occur during the turbulent mixing of the two dif- f e r e n t gases. In this experiment, the scattering is principally f r o m density fluctuations, and the contributions f r o m the turbulence to the index of refraction a r e small. The scale and amplitude of the fluctuations before interaction with the shock w a - ~ c s a r e ohtailled f r o m optical and point density m e a s u r e m e n t s ; the method of Uberoi and Kovasznay (Ref. 1 0 ) has been used to obtain length s c a l e s of the flow f r o m shadowgraph and schlieren pictures, and the Brown- Rebollo (Ref. 11) density probe i s used to m e a s u r e local. mean and r m s density fluctrlations and space-. and c r o s s - c o r r e l a t i o n functions.
To s k d y the interaction of the shock with the turbulecce, spark shadowgraph and schlieren pictures have been taken and p r e s s u r e m e a s u r e m e n t s have been made. A r r a y s of p r e s s u r e
t r a n s d u c e r s located in a false endwall downstream of the scattering volume r e c o r d the shock front topography and the spatial variation of shock arnylitude.
P.
2---
R e s e a r c h Goalsobjectives:
1. To m e a s u r e the scattered wave field azld in partlculzr i t s dependence on the strength of the incident vir,zve and the s t a t i s t i c a l p r o p e r t i e s of the scattering medium;
2 . To investigate the n ~ o d f fications, i f any, of the: r a n d c r l ~
medium due to t h e p ~ s p a g a i i n g s h o c k \ ~ a v e ; and
3 , To determine the i n f h ~ e n c e of nonlinear effects or^ f i e
interaction p r o c e s s ,
11. DESIGN OF THE E X P E R I M E N T 2. 1 Objectives
To study the propagation of weak shock waves through a random medium, a c l a s s i c a l scattering configuration is chosen. The
. ? ,
shock waves a r e generated in the GALCIT-" 17-inch d i a m e t e r shock tube. The random medium is produced in the turbulent m i x e r which i s mounted a t the end of the shock tube. Following a r e the design c r i t e r i a f o r this apparatus:
1. To achieve within a 27 cm cube of gas a randomly vary- ing acoustical index of refraction ( r a t i o of the speed of sound in a i r a t standard conditions to the local speed of sound),
2, To maxirnize the random perturbations of sound speed while s t i l l maintaining overall statistical homogeneity and isotropy,
3, To i n s e r t the nonuniform rnedium between regions of quiescent t e s t - section fluid,
4. To match the mean acoustic impedance and the mea-n, density of the interface between the gas in the t e s t section and in the turbulent m i x e r ,
5. To accommodate optical. diagnostic tools such a s schlieren and shadowgraph photography, and
6.
To insure repeatability of mechanical functions within0 . 5 % .
-
.I,
----
-6-
2. 2 Turbulent Mixer
---
2. 2, 1 G e n e r a l Descriptiorl
- -
The turbulent m i x e r , mounted a t the end of the 17-inch shock tube, g e n e r a t e s a r e c t a n g i ~ l a r volume of incompletely
~ n i y c d g a s ( F i g s . A . I anti A . 2). The appai-atus consists of an a r r a y of fine jets alter~;rtejly of helium an6 frcolz- 12 b;s!tirrd c o a r s e g r i d s located on opposite s i d e s of 2 box. The g r i d s a r e
rapidly retrsctec? f l ~ t s h with ths side walls before the shoc..k t u b e i s fired. T h e o t h e r two side walls a r e fitted xrrith. optical ~ ~ ~ i . n d o w s f o r diagnostics. 'The v e r t i c a l u p s t r e a m and downstrea TI walls of the box a r e fitted with s h u t t e r s which can be opened rapidly just before
shock arrivzl. This p r o c e s s i s aimf.~rnated, slid the a r r i v a l time of
the
shock relative t o the decay time of the turbulent density field c a n be varied. T h e g a s rriixttzre i s silarie neutrally buoyant s o thzt the m e a n interface between t!ie s c a t t e r i q g regjon and the m i f o r mg ~ t s ir, the shoclr tube r e m a i n s p a r a l l e l to the pParre of the incorning
2. 2 . 2 --- Refractive Index Fiuctuations -..,.---
-
The speed of p ~ o p a g a t i o n of a sound tvn-irc in s gas deperrdo an the thersnodynsrnic p r o p e r t i c s and the ~ n a c r o s c o p i c convection velocity, -iTs of the rnedium, i. e.
,
where y . 8 the r a t i o of the specific h e a t s , R the rz~ivctrsal g a s
0
Therefore, in principle a t l e a s t , acoustical index of refracticjn fluctuations m a y be generated by varying the t e m p e r a t u r e , velocity,
or density of the fluid.
In this experiment, a mixture of gases was used f o r two reasons:
1. By randomly mixing two gases with a l a r g e l y different molecular weight and s t r u c t u r e , the acoustical index of
refraction fluctuation could be maximized; and
2. The turbulent mixing p r o c e s s could be easily observed optically.
To exclude modification or scattering of the shock wave due to l a r g e - s c a l e variations of the mean index of refraction, the
average sound speed of the binary mixture rnust match the sound speed of a i r in the t e s t section of the shoc1.r tube. Furthermore, by matching in addition the mean density, the interface between the turbulence region and the quiescent fluid i s , on the average, parallel to the plane of the incoming shock wave. Consequently the mean acoustic impedance is matched a s well, which minimizes the gen- eration of reflected waves. Detaiis of this calculation a r e left to s disc.ussion in Appendix A 2.
u s e d i n t h i s experiment. T h e o r e t i c a l s t u d i e s s e e m to indicate t h a t the shock-wave s t r u c t u r e of the sonic boom i s p e r h a p s p a r t i a l l y d e t e r m i n e d by v i b r a t i o n a l relaxation e f f e c t s of n i t r o g e n and oxygen i n the e a r t h ' s a t m o s p h e r q but i n t h e c u r r e n t investigation this effect is excluded.
2. 2. 3 F l o w Control S y s t e m
A s c h e m a t i c of the flow c o n t r o l s y s t e m is shown in f i g u r e A. 7. S t a n d a r d purity, g a s e o u s h e l i u m is s t o r e d in f o u r g a s cylin- d e r s f o r a total capacity of 23 s t a n d a r d cubic m e t e r s . F o u r
Matheson A - 9 r e g u l a t o r s r e d u c e t h e cylinder p r e s s u r e t o t h e r e - q u i r e d working level. The g a s is conveyed f r o m t h e c y l i n d e r s t o two plenum c h a m b e r s via two 2. 5 nl long and 1. 25 c m d i a m e t e r c o p p e r pipe s y s t e m s . F r o m the plenum c h a m b e r , the helium is injected into t h e mixing zone through 28 j e t s i n the sidewall of the shock tube. J u s t u p s t r e a m of the plenunl c h a m b e r s , e a c h supply l i n e contains two contoured n o z z l e s i n p a r a l l e l , T h e flow in the t h r o a t is sonic under s t e a d y s t a t e running condi.tions. T h e r e f o r e , the Row r a t e through t h e j e t s is s o l e l y controlled by the p r e s s u r e u p s t r e a m of t h e nozzles ( a s s u m i n g constant r o o m t e m p e r a t u r e ) .
which r u n througl.1 t h e helium r e s e r v o i r s . T h e
56
h e l i u m andf r e o n - 1 2 j e t s in e a c h sidewall a r e a r r a n g e d in a c h e c k e r b o a r d con- figuratio~z, The g a s supply t o t h e s e jets i s ii^npulsfvely s t a r t e d and stopped by f a s t acting solenoid valves just upskr-ear? of the two c o n - t o u r e d nozzles. Inside the mixing zoxs, g r i d s can b e r e t r a c t e d
f l u s h with the sidewall allti i n d o i n g s o c o v e r u p the jets a o e x g l a i ~ e d in Section 2. 2. 4.
2, 2 . 4 T h e G r i d s
The p u r p o s e of the g-rids is twofold:
1 . To c o v e r the jets in t h e r e t r a c t e d position. T h e f ~ o n t s u r f a c e of the g r i d then f a l l s f l u s h with the sidewall, which m i n i m i z e s diffraction effects on the shock waxre,
i s o t r o p i c turbulent d r n o i t - ) ~ flezcku a t ' 10n3,
During t h e design p h a s e s f the p r o j e c t , e x t e n s i v e d o c u ~ n e n t a t i o n or, g r i d t u r b u l e n c e was consulte-:ij (13atct1elor, Ref. 5 ), An a result- ol t h i s effort, the mesh.c\iidtki .fvl =. 3. 2 ex12 was chosen l o i-r~a:ri;-nizc. t h e density flacl;uations, y e t k e e p the i n t e g r a l scale small coinpared wTth the s i z e of the r e c t a n g u l a r shock tube t e a t section ( 2 6 .
6
c m x26.
6
crn). T h e solidity of t h e g r i d , that i s the ratio of the c l o s e d a r e a t o the total a r e a , was designed t o be 0. 75. It was a l s othnug'r~t i m p o r t a n t t o zvoid head-on collision of t h e j e t s o n opposite sitlzs of the box. T h e r e f o r e , the g r i d s w e r e horizontally a n d v e r t i c a l l y offset by M / 2 = 1. 6 c m .
wall using an endmill specifically designed f o r this purpose ( s e e Appendix A 1 ). At each intersection a
d
3. 2 m m hole was drilled, for a total of seven rows and eight columns, The sidewalls were then used a s a rrlold f o r the grids themselves. F i r s t a support c o r e was constructed consisting of A1-2024 b a r s , with a c r o s ssection of 10, 2 x 4. 8 m m . This s t r u c t u r e was positioned 2. 5 m m f r o m the bottom of the grooves before the turbulent m i x e r was assembled. With the mold in the horizontal position, the grooves were then filled with a 50% mixture, by weight, of G E RTV-631 and RTV-632 rubber t o a depth of 5 mm. The rubber is bonded to the aluminum c o r e by GI3 p r i m e r SS 4155.
The remaining empty volume of the grooves was filled with E m e r s o n & C u ~ n m i n g s stycast FT4150. The aluminum oxide i m - pregnated epoxy was selected to match the A1-2024 coefficient of t h e r m a l expans ion. Subsequently, the sidewalls containing the grids in the r e t r a c t e d position w e r e grorcxd to the p r o p e r thickness t,o remove e x c e s s stycast. The discussion of the drive rr~echanism for the grids i s p ~ e s e n t e d in Appendix A3.
The gas injected into the mixirig zone i s exhausted into the atmosphere via removable walls, h e r e a f t e r r e f e r r e d to a s shutters. 2. 2. 5 The Shutters
The purpose of the shutters i s to s e p a r a t e the turbulence region f r o m the quiescent a i r in the shock tube t e s t section. This i s accomplished by a device v e r y much like a c a m e r a shutter.
connected to the scattering medium through 14
4
3, 2 m m holen. The plate adjacent to the shock tube t e s t gas is so1i.d. The shutter blades exhaust to the atrnospllere t h ~ o u g h ad
1 . 25 c m exhaust l i r ~ e . The shock tube t e s t sectioll a n d the turbulent rnising volurrle a r e both a t a t w l o s p h e ~ i c p r e s s u r e a f t e r the jets a r e turned o1f.Each blade rcitates arounc?. a pivot poiat. A f t e r a 45 degree t u r n f r o m the closed configuration, the diagonal side of each biadc
>I:
coincides with the sEioek tube sidev~all, T h e four blades of each shutter a r e linked together by a 1, 25 crn wide and 0. 5 ram t h i c k s t e e l band ( s e e Appendix A l ) . A four-linkage ri~echanianl connects t h e shutter blades t o a high-pressure a i r - d r i v e n l i n e a r actuator, (IJynan~atioe DM 35) which drivcs the a s eembly, The I c i ~ r e r n z Lice uf this s y s t e m insures a 45 d e g r e e rotation of the blades with zepo angular velocity a t the elld of the p i c t o n stroke ( s e e Appendi.7: A 4 f ,
This arrangerneqt prevents the f o u r blades from colllcling with each other with a n y appreciable aragilfar rnonlentum, The shutter opcning t i m e can be adjusted by v a r y i ~ l g the upstream p y e s s u r e i n the drive cylinders a s well a s monitoring the exhaust g a s f i o w rate. The s h c t t e r s a r e closer1 by reversing the flow direction through the actuators.
2. 2.
6
The Optical--
VTil~dowsThe top and bottorri horizontal sidewalls of the mixing region a r e fitted with optical x:rindov~s for diagnostics
( 6
1 5. 2 ern diameterand 3, 2 crn thick BE:-7 schlieren quality glass). C a r e was taken to
' his principle tvas Geveloped a.ccordi ng to a suggestion from Prof.
adjust the two plates p a r a l l e l in o r d e r to avoid ghost images due to multiple reflections between the plates. The windows can be located a t four stations in the mixing zone sidewall ( a s indicated in Appendix A l ) a s well a s u p s t r e a m and downstream of the shutters.
2. 2. 7 The Cookie-Cutter
The cookie-cutter was designed to facilitate the transition f r o m a c i r c u l a r c r o s s section to a square one. The u p s t r e a m edges a r e wedges with a 1 2 degree tip angle. The length of the tube,
which i s 122 cm, determines the t e s t time of the experiment. In the Mach number range Ms = 1. 007 to MS = 1. 1, this configilr~tion a s s u r e s that the reflected shock wave f r o m the endwall of the 17- inch shock tube and the reflected wave f r o m the endwall of the
turbulent m i x e r m e e t u p s t r e a m of the nonuniform gzs mixture. The t e s t time i s then defined a s the period i n which the shock wave travels twice the dista.nce f r o m this meeting point to the endwall of the turbulent m i x e r .
2. 2. 8 Shock Tube Firing Mechanism
-
The firing mechanism of the CALCIrT 17-inch shock tube had to be modified to p e r m i t automatic o p e r a t i ~ n (details of the modifi- cations a r e discussed in Appendix A 5 ) . The manual procedure previously used i s well documented (Liepmann, e t al. Ref. 1 3 ) and briefly summarized here.
In the c u r r e n t experiments, the d r i v e r can be p r e s s u r i z e d a t a n adjustable r a t e f o r a p r e s e t period of time. The knife blades a r e made movable a s well. Now the firing procedure h a s been altered t o the following:
Before a run is s t a r t e d , the d r i v e r p r e s s u r e i s p r e s e t to 0. 014 a t m below the bursting p r e s s u r e . Then a t a predetermined time in the experimental procedure ( s e e Section 2. 4) the d r i v e r p r e s s u r e i s monotonically i n c r e a s e d a t a r a t e of approximately
0. 06 a t m / s e c until the diaphragm f r a c t u r e s . F u r t h e r m o r e , the firing time of the weakest shocks, Ms = 1. 007, can be controlled by injecting the knife blades into the imembrane (0. 012'7 m m thick mylar). The timing of the knife blade motion a s well a s the posi- tion with r e s p e c t to the undeflected membrane was found to be v e r y crucial. When the d r i v e r p r e s s u r e i s too low the shocks do cot r e a c h t h e i r equilibrium s t a t e before the end of the t e s t section. On the other hand, i f the knife blades a r e injected into the dia- phragm when the d r i v e r p r e s s u r e is l e s s than 0. 001 a t m below the bursting p r e s s u r e , the a r r i v a l time of the shocks a t the mixing zone becomes e r r a t i c . The knife blades w e r e therefore displac2d when the d r i v e r p r e s s u r e was appruximate1.y 0. 003, a t m below the bursting p r e s s u r e . F u r t h e r m o r e , the knife blades should be located a s close a s i s convenient to the diaphragm, yet be f a r enough a w a y to insure a sufficiently high firing p r e s s u r e .
2. 3 Electronic Control System f o r the Turbulent Mi-xer 2. 3. 1
-
Objectivese l e c t r o n i c c o n t r o l s y s t e m (ECS):
1. To c o n t r o l the m e c h a n i c a l functions of the turbulent m i x e r , e i t h e r i n p r e p r o g r a m m e d o r d e r o r independently of each o t h e r ;
2. To f i r e the GALCIT 17-inch shock tube automatically;
3 . To supply the BETA signal ( s e e Section 4. 2. 1 ) to the
Analog-to-Digital C o n v e r t o r f o r c c m p u t e r controlled data zccjuisitioil; 4. To g e n e r a t e a g e n e r a l p u r p o s e T T L compatible t r i g g e r signal;
5. To g e n e r a t e a timing s i g n a l f o r the s p a r k gap contra1 c i r c u i t r y ;
6 .
To p r e v e n t actions which m a y d e s t r o y e l e m e n t s of the turbulent m i x e r , In particlJ.ar, t h e shock tube should n e i t h e r bc f i r e d with the s h u t t e r s closed n o r g a s injected into t h e mixing zone with the g r i d s r e t r a c t e d ;7. To provide a n option to bypass t h e s a f e t y checks; and 8. To optimize n o i s e immunity under 'I"I'L o p e r a t i ~ i g condi- tions axid to m e a s u r e repeatability of the output s i g n a l s within 0. 5%. 2. 3. 2
--
D e s c r i p t i o n of the Elect-sonic C i r c u i t r y--
T h e e l e c t r o n i c corltrol c e n t e r , a s indicated in Appendix A 6 ,
c o n s i s t s of nine channels which, control. the following functions: 1. the s p a r k g a p ,
2. the BETA s i g n a l ,
3 . a g e n e r a l p u r p o s e t r i g g e r signal,
5. the motion of grid 2,
6.
the gas flow through the helium and freon- 1 2 supply lines, 7. the motion of the shutters,8. the flow into the d r i v e r section of the 17-inch shock tube, ar,d
9,
the motion of the knife blades.Most channels consist of t h r e e basic elements: a delay, a t i m e r , and a n open collector inverter ( s e e Appendix A
6
). The delay and t i m e r a r e SN 74121 monostable v i b r a t o r s . An input t r i g g e r signal can be either delayed o r transmitted directly to the timer. The t i m e r output a s well a s the delay a r e adjustable in length. The t i m e r signal then passes through a n open collector inverter before i t is conveyed to the output device. Two 01. m o r ei n v e r t e r s connected in parallel a r e used a s a logic comparator. All inputs have to be in the s a m e (logical 0) s t a t e before a signal is transmitted to the common output line. This f e a t u r e i s used to check the status of elements in the turbulent m i x e r before executing the function of that particular channel.
solenoid valves in the supply lines to the grid drive mechanisni ( s e e Appendix A3). At the end of the translation, two limit-
switches signal the position of the grids to the control unit. Then, in the check mode with the safety checks operational, the trigger signal i s conveyed to a l l channels except 8 and
9.
T h e r e a f t e r , each channel executes its operation according t o the status of the toggle s w i t c l ~ e s and the values of the variable r e s i s t o r s which determine the duration of the delay and tjmer signals ( s e e Appendix A 6 ) . The on--off switches in a l l output lines conveniently offer the option whether or not to t r a n s m i t the com- mand signals to the output devices. After the g r i d s r e t r a c t and the shutters open, the 'limit switches indicate t h e i r positions to tlie control center. A t r i g g e r pulse i s then transmitted to channel 8 to p r e s s u r i z e the d r i v e r and move the linife blades, if desired. In the check mode, the shutters m u s t be f i r s t closed and then opened before the shock tube will f i r e . 111 the bypass mode, no checks a r e performed on the status of the sh-t:tters or grids. Then the main- switch t r i g g e r signal is immediate1.y transmitted to channel 8 a f t e r the grids have moved a w a y f r o m the sidewall. Under n o circa=- stances, however, can gas be injected into the mixing zojne when the grids cover the jets. The input to the open collector i n v e r t e r i s then high, thus preventing the t i m e r signal f r o m being t r a n s m i t - ted. The knife blades cannot be moved unless the drive?: is being p r e s s u r i z e d .
noise and spikes in the common 115 v power lines usually associated with mechanical relays. Noise immunity f r o m external s ources i s f u r t h e r enhanced by connecting a l l switching l i n e s in the T T L logic circuits to
+
5 v, using a differentiating circuit. The high orlogical 1 output level i s thereby r a i s e d f r o m 3. 3 v to 5 v increasing the noise immunity f r o m 2. 5 v to 4. 2 v f o r a negative pulse gcing f r o m high to low (logical 1 to logical 0).
2. 3. 3 P e r f o r m a n c e
All delays and t i m e r s w e r e a c c u r a t e and repeatable to a t l e a s t 2 m s e c p e r 2000 m s e c or 0. 1%. T h e r m a l stability was
better than 0. 1% a f t e r the unit was turned on f a r half an hour. The noise immunity and the use of solid s t a t e relays made the electronic control unit p e r f o r m excellently i n a potentially noisy environment, i, e.
,
a high voltage s p a r k source switching 4. 5 kv a c r o s s the electrodes and 115 v A C solenoid valves opening and closing. 2. 4 Experimental P r o c e d u r eA standard run i s characterized by the following sequence of events :
1 . The shock tube i s purged of gases o t h e r than room a i r ; 2. The shutters a r e closed;
3 . The diaphragm is clamped in a mounti.ng ring and
inserted into the shock tube;
4. The d r i v e r i s p r e s s u r i z e d to 0. 014 atrn below the bursting pressuye;
6.
The g r i d s t r a n s l a t e f r o m the r e t r a c t e d position 1. 14 cm toward the c e n t e r of the turbulent m i x e r . The end of the strolcesignifies t i m e t = 0;
7. The n o r m a l l y closed solenoid valves in the supply l i n e s to the plenum c h a m b e r s open f o r 1500 m s e c ;
8. The g r i d s s t a r t to r e t r a c t a t t = 1300 m s e c ;
9.
The g a s flow i s turned off a t t = 1500 m s e c ; 10. The s h u t t e r s a r e opened a t t = 1600 m s e c ;11. The shock tube is f i r e d a t the d e s i r e d t i m e in the decay p r o c e s s of the density fluctuations; and
12. The s p a r k gap is flashed when the shock wave a r r i v e s a t the c e n t e r of the optical windows.
2. 5 P e r f o r m a n c e of the E x p e r i m e n t a l F a c i l i t y ---.---- --,
The turbulent m i x e r p e r f o r m e d e x t r e m e l y s a t i s f a c t o r i l y and within the design c r i t e r i a during the c o u r s e of the e x p e r i m e n t s . Under n o r m a l operating eonditions, a s d e s c r i b e d in Appendix A 7 , the s h u t t e r s open in 200 m s e c f 0. 570 and the g r i d s t r a n s l a t e 1. 14
c m in and out of the sidewall in 400 m s e c C 0. 5%. The t i m e r e - quired t o activate the solenoid valves in the gas supply lines i s 4 - 8 m s e c according t o the manufacture?^ s p e c i f i c a t i o ~ s . E a c h valve was found to be repeatable within 1 m s e c . The variation in
a r r i v a l t i m e of the weakest shock waves, M = 1. 007, a t the mixing 9
zone was v e r y s m a l l , l e s s than 5 m s e c in 2000 m s e c f o r 2 typical
T h e s t r a n g e r shock waves callnot be fired s o a c c ~ r r a t e l y in time. The knife blades a r e stationary for the M = 5 . 03 and M = 3 . . 1
9 6
shocks, Theref o r e , vzriations iri the properties of the diaphragm m a t e r i a l and, f o r m y l a r , humidity and t e m p e r a t u r e conditiolis in the lahoratcsry i n f l u e ~ c e the exact firing time of the shock tube. F o r r,-ixns made the s a m e day, r z p e a t a b i l i ~ y of the firing mechanism was acceptable within Ihe design c r i t e r i a . F r o m one day t o the nexf, "L~le delay in c h a n n e l 8 had t o be adjustecl t o conlpeas,zte f o r
changing peripheral c orrditio~s, 'The shocl-, wave s trcngth i n all three c a s e s , however, w a s very repeatable, typic all^- better. t-han
1 % in the Mach nl~n-ilsar.
Tlre fluid rnechavlical propertics of the tur'xd.ernt m i x e r a r e discussed in Chapter V. H e r it SLI-ffices t o s a y that the overall p e r f o r m a n c e of fie experirnenial facilities jus tifie:+ ensemble:
111 INSTRUMENTATION
3 . 1 Scope
The i n s t r u m e n t s , which a r e d e s c r i b e d in this c h a p t e r , tirere used to m e e t the following objectives:
1. To c h a r a c t e r i z e the s c a t t e r i n g rnedium in the absence of a shock wave,
2. To investigate the modifications, i f any, of the random field due to the i n t e r a c t i o n with the shock wave, and
3. T o m e a s u r e the s c a t t e r e d wave field.
The s c a t t e r i n g medium was c h a r a c t e r i z e d using point density m e a s u r e m e n t s , and optical techniques. Two a s p i r a t i n g density probes, a s d e s c r i b e d in Section 3 . 2 , w e r e used to calculate nlegn values and r m s fluctuations, a s well a s space- c o r r e l a t i o n functions and s p a c e - t i m e c o r r e l a t i o n s . C h a r a c t e r i s t i c length s c a l e s in the density field could a l s o be obtained f r o m schlieren,shadowgraph and F o u r i e r t r a n s f o r m photographs, a s explained in Sections 3. 3 and 4. 3. F u r t h e r m o r e , with the shock photographed in the center of the observation window, the s c a t t e r i n g medium could be analyzed in front a s well a s behind the wave. The density probe was not suit- able f o r this purpose because the t e s t t i m e , in the p r e s c n t e x p e r i - m e n t , i s s h o r t compared with a l l but the highest frequencies in the fluctuating density field.
3 . 2 Aspirating Density P r o b e
An improved v e r s i o n of the Brown-Rebollo (Ref. 11) density probe was built and used to m e a s u r e local point densities. A Standard
c o n s t a n t - t e m p e r a t u r e hot-wire c i r c u i t , designed and built a t Caltech
-7. .v, 4.
by D r s . Anthony p e r r y T and Brian J,
cant well""'^,
was used to o p e r a t e the hot w i r e in the probe. The r e s p o n s e of the hot w i r e to a square-wave input indicates a w i r e frequency resolution of 1 0 0kHz. Konrad (Ref. l4), using a s i m i l a r density p r o b e , found that the frequency r e s p o n s e of the probe was a t l e a s t 45
kHz,
In the p r e s e n t application the spatial resolution i s a m a t t e r of definition. T h e r e i s no appreciable m e a n flow over the probe, although the instantaneous flow velocity m a y r e a c h 1 - 2 m / s e c .
T h e r e f o r e , the spatial resolution i s a r b i t r a r i l y defined a s the radius of a s p h e r i c a l sampling volume on which s u r f a c e the in-flow velocity i s equal to 1 m / s e c . The m a s s flux through this s u r f a c e c o r r e s - ponds to the sink strength of t h e sonic throat on the t i p of the density probe. Based on this definition, the s p a t i a l resolution i s
0. 2 rnrrl. A detailed account of the density p r o b e c o n s t r ~ c t i o n and r e s p o n s e e s t i m a t e s is given in Appendix B l .
3. 3 Optical M e a s u r e m e n t s
-
3. 3 . 1 Optical P r o c e s s o r--
The p r o p e r t i e s of the optical appara.tus used in t h e s e e x p e r i - m e n t s can probably be b e s t explained by describing a general f o r m
J, 'IC
R e a d e r , University of Melbourne, A u s t r a l i a .l,4.
.'.
of optical p r o c e s s o r in t e r m s which will be useful in subsequent sections. This s y s t e m consists of two double convex l e n s e s which image a point light source f r o m the focal plane of the f i r s t lens onto the back focal plane of the second one, which can be r e f e r r e d to a s the optical F o u r i e r t r a n s f o r m (OFT) plane (cf. Fig. 3. 1). F o r the purpose of describing the sys tem, without sacrificing the essential physics in the problem, the discussion will be r e s t r i c t e d h e r e to monochromatic so.urces. In principle, the r e s u l t s can be extended to polychromatic radiation, but the mathematics describing the setup becomes considerably m o r e involved.
1 I1 I11 IV
v
Figure 3. 1 Schematic of an Optical P r o c e s s o r
Consider the geometry of Figure 3. 1 with a rectangular co- ordinate sys tem (x, y), (u, v ) , ( r , s ) and (p, q ) attached to the planes I, 11, 111 and IV, respectively. The object, located a distance d
1
in front of the lens, i s illuminated by a normally incident plane wzve of unit amplitude. The transmittance of the object is denoted by E ( x , y ) , where the harmonic phase factor e -iW t
I i s omitted. In
[image:39.581.39.540.72.657.2]Ref. 15) using diffraction theory and i s given by
where P i s the pupil function for lens 2 , i. e.
,
p o x ! > D2/2.
Iy\>
~ , / 2 ) = 0 and P ( l x l g D2/2,l y l ~
IlZ/2) = 1.Applying this s a m e formula again to propagate the field distribution f r o m plane I11 to plane V, EV (xo, y o ) is found to be
k
e x p l
-
i-
( r x o 4 s y )0
where again P i s the pupil function f o r lens 3. In addition, if the c a m e r a focuses onto the object plane, then d l , d2, d3, F2 and F3 a r e related by using the lens law:
Combining equations 3-1, 3-2 and 3 - 3 , EV ( x y o ) can be expressed
0
'
in t e r m s of E ( x , y ) and geometrical p a r a m e t e r s . The result of I
3. 3. 2 , 3. 3. 4 and 3. 3. 5, the above discussion will be used a s a starting point f o r the treatment of the modifications of this basic scheme,
3 . 3 . 2 Schlieren System
The schlieren s y s t e m i s identical to that of the optical pro- c e s s o r described in Section 3. 3 . 1 , except that the frequency content of the signal in the O F T plane i s al.tered. This i s accomplished by inserting a knife blade into the focal spot or by blocking the low frequencies with a dot. A knife blade with the cutting edge oriented p a r a l l e l to the s coordinate and passing through the origin changes the l i m i t s of integration i n equation 3-2 to the following:
A dot with radius R centered around the origin modifies equation 3-2 to
00 00
E~
ixo. y o ) =i 3
-
?)jx:
+
y : ) / j ~ ~ ~ ~ ~ir,
S J
R K
(3-5) yo exp - i
-
S t 2
)
[
( r x o + s y ) d r d s
F3 F3 0
I
where r 2 + s 2 . R . 2
f o r e i t h e r r
>
0, in c a s e of the knife blade, o r r Z t s 2>
R~ f o r t h e dot with r a d i u s R. An account of t h e s c h l i e r e n s y s t e m that was s p e c i f i c a l l y designed and built f o r t h i s e x p e r i m e n t i s p r e s e n t e d in A.ppendix B2.3 . 3. 3 Shadowgraph S y s t e m
T h i s method r e c o r d s the shadows c a s t by the object onto a photographic plate. The c a m e r a and second l e n s a r e r e p l a c e d by a
single photographic p l a t e holder. T h e equattons, 3-1
-
3 - 3 , do nut d e s c r i b e t h i s s y s t e m adequately. T h i s configuration, however, bas b e e n analyzed i n s o m e d e t a i l by T a y l o r (Ref. 1 6 ) , f o r ' thec a s e of l i g h t propagating through turbulence. T h e s c h l i e r e n s e t u p , a s d e s c r i b e d in Appendix
B2,
can be e a s i l y modified into a shadow-. g r a p h s y s t e m by i n s e r t i n g a f i l m plate holder between t h e object and the second l e n s .3. 3. 4 Optical C o r r e l a t o r
Shadowgraph and s c h l i e r e n p i c t u r e s c a n be used to obtain s p a c e - c o r r e l a t i o n functions a s f i r s t d e s c r i b e d by Uberoi and
The analysis f o r correlation functions obtained f r o m
schlieren pictures i s given by Thompson and Taylor (Ref. 17), using r a y optics, and a n account of the physical setup of the c o r r e l a t o r i s given i n Appendix B3.
3. 3 . 5 Optical F o u r i e r T r a n s f o r m -- Photography
Length s c a l e s of turbulence can a l s o be obtained by position- ing the photographic film in the OFT plane of the optical p r o c e s s o r . Then equation 3-1 describes the e l e c t r i c field distributiori f r o m which the intensity can be computed using
where the :: denotes complex conjugation.
The analysis of the input response of the systern with a s l a b of turbulence located between the two l e n s e s i s given in Section
4. 3 . 3. As a r e s u l t of that calculation, the s i z e of the focal spot
can be directly related to length s c a l e s in the scattering m e d i m . 3.4 P r e s s u r e Measurements
3 . 4 . 1 P r e s s u r e Transducer
-
MountsThe Piezotronics PCB p r e s s u r e t r a n s d u c e r s w e r e found to be v e r y susceptible to s t r e s s waves when mounted according to the manufacturer's specifications. In the shock tube, s t r e s s waves in the sidewal.1 associated with the rupturing of the diaphragm reach the p r e s s u r e gauges in the t e s t section long before the shock waves do. Therefore, gauges would display a n output signal ahead of the shock. This problem was especially s e v e r e for the snlallest
found by mounting the t r a n s d u c e r s in a pltrg which i s i l l u s t r a t e d in F i g u r e 3.2. The c e n t r a l b r a s s cylincler contains the p r e s s u r e gauge and is vibration i s o l a t e d f r o m the wall in which i t i s rnounted by a G.E. RTV 632 r u b b e r ring. Grooves i n the s u r f a c e s a d j a c e n t to the r u b b e r , a s w e l l a s s m a l l pins p r o t r u d i n g out of the sidewall of the c e n t r a l b r a s s cylinder, i n s u r e t h a t the t r a n s d u c e r r e m a i t i s in position u n d e r the p r e s s u r e f o r c e s f r o m the shock wave.
Seven t r a n s d u c e r s w e r e used in the experirnent, A K l s t l e r p r e s s u r e gauge, m o d e l 606A, w a s mounted in the 17-.ji1ch shock tube n e a r the endwall. J u s t u p s t r e a m of the mixing zone, a 2.5 rrlm P C B m o d e l 105A t r a n s d u c e r w a s l o c a t e d in the sidewall of the turbulent m i x e r , using the above d e s c r i b e d mounting plug. D o w n - s t r e a m of the s c a t t e r i n g region, t h r e e P C B 113 A 21 gauges, one P C B 112 A 21, and one K i s t l e r 606A t r a n s d u c e r w e r e mounted in a m o v a b l e f a l s e endwall a s indicated in Figure 3.3. With the K i s t l e r gauge in the c e n t e r , the P C B t r a n s d u c e r s w e r e positioned 3.2 c m r a d i a l l y outward in a c r o s s configuration. F o u r
$
1.25 crn s t a ~ z d - offs l o c a t e d the p l a t e with r e s p e c t to the d o w n s t r e a m s h u t t e r and provided s u f f i c i e n t v i b r a t i o n isolation to negate the need for the3 . 5 Data Acquisition
-
S y s t e mShort r u n times, typically 1.6 s e c . f o r the e n t i r e experiment f r o m s t a r t to finish, and the d e s i r e to reduce the density data on-. line r e q u i r e d the use of a high-speed data acquisition system. The GALCIT mobile computer-controlled data acquisition system, called Solo System, was u s e d for this purpose. The P r e s t o n analog-tn- digital c o n v e r t e r (ADC) i s capable of taking data with a resolution
4
of 14 b i t s plus s i g n on 16 channels a t a r a t e of 4x10 conversions 5
I V , DATA ACQUISITTON AND PROCESSING 4. l - Scope
Turbulence can oaly be d e s c r i b e d in s t a t i s t i c a l t e n n s .
Consequently, m e a s u r e r n c n t s i n u s t be a v e r a g e d ovzr a l a r g e number of realizations of the randorm field. Alternatively, when the crgoclic theorem i s applicable, t i m e z v e r a g i ~ l g m a y b e substituted f o r e n - s e m b l e averaging. Unfortunately, in ahoc:k tu.he r e s e a r c h test t i m e s tend t o be short. T h e r e f o r e , emphasis has been placecl on rneaa -
urement techniques which obtain and s t o r e a s many daki a s ar.e
conveniently. possible p e r run. In this context, photographic methods a r e especially appealing because of t h e i r l a r g e space-bandwidth
p coducts. F u r t h e r m o r e , f o r the p~.lrpus e of studying the s c a t t e ring mci-fiurn, t h e space-averaging p r o p e r t y of t h e s e s y s t e m s can be used advan+:ageously, a s explained in Section 4, 3. For the d a t a areductiol? of the point density m e a s u r e m e n t s , s cnmbinatictn of iirnc- aact
ensemble averzging was applied. 4, 2 Point Density bdeasurerc-ents
L----"-
---
-.--4. 2. 9 Data Acquisition , - P r o c e d u r e
One of the f e a t u r e s of the A.DC i s that c o n v e r s i o n s take place under control of a n e x t e r n a l clock. F o r this e x p e r i m e n t the clock s i g n a l is derived f r o m a 20 kHz p u l s e t r a i n coining f r o m a p r e s e t counter built into the Solo System. Based on this clock signal, data conversions t a k e place on e a c h channel a t the r a t e of one p e r 100 psec. Conversions can be prevented by a n input to the A D C called BETA. If the BETA signal, which i s d e r i v e d f r o m the electrorlic control system, is held f a l s e , no c o n v e r s i o n s will o c c u r independently of tlie s t a t u s sf the signal on the clock line.
Data f r o m the ADC a r e p r o c e s s e d in the c o m p u t e r by a
F o r t r a n IV p r o g r a m . Input v a r i a b l e s to the p r o g r a m a r e the n m h e r of r e c o r d s p e r t a p e file, the n u m b e r of ADC, channels, and the
identification word f o r the run. An a s s e m b l y - l a n g u a g e suhroutille, written by P r o f . D. Coles, is u s e d f o r data acquisition. It u s e s two data buffers of 4096 words each. While the second data buffer is filling, the f i r s t data b u f f e r is being w r i t t e n onto magnetic tape, and s o on. At the data r a t e of 20,000 conversions p e r second, no data a r e Post while writing gaps between r e c o r d s . The sequence of events c o m p r i s i n g a typical run is now a s follows:
1. The s h u t t e r s a r e closed a f t e r the shock tube has been purged of f o r e i g n g a s , and the p r o g r a m is initiated by feeding data c h a r a c t e r i z i n g the run into the computer. BETA i s held f a l s e , and the p r e s e t - c o u n t e r clock i s running. The e l e c t r o n i c control s y s t e m i s s w i t c h - p r o g r a m m e d f o r the d e s i r e d sequence of events with the m a i n switch in the r e s e t position.
the r u n position, the g r i d s move away f r o m the sidewall. At the end of the s t r o k e , BETA is m a d e t r u e and c o n v e r s i o n i n t h e A D C t a k e s place until the p r e p r o g r a m m e d n u m b e r of r e c o r d s a r e w r i t t e n on tape. The p r o g r a m checks f o r f o r m a t e r r o r s , i. e . , whether o r not a data block did end on l a s t channel. No p r e c a u t i o n s a r e taken t o d e t e c t o r c o r r e c t p a r i t y e r r o r s when writing.
3. At t h e end of the r u n , a f t e r the g a s flow i s t u r n e d off, the p r o g r a m s t a r t s p r o c e s s i n g the data. Resident i n c o r e i s a c a l i - bration c u r v e of a nondimensionalized density p r o b e output
( V m a x
-
V
P
)I(Vmax - V m in ) a s a function of the c o n c e a t r a t i o n by volume of h e l i u m ( s e e Appendix B l ) . Vm a x and V m i n a r e the hot- w i r e a n e m o m e t e r output voltages f o r helium and f r e o n - 1 2 r e s p e c t - ively, and they w e r e m e a s u r e d twice a day by filling the mixing zone with e i t h e r p u r e helium o r freon-12. I t was found t h a t t h e s e values did not change within t h e edxperimental a c c u r a c y of the m e a s - u r e m e n t s a s long a s the h o t - w i r e s e t was not t u r n e d off and the vacuum pump w a s n o t disconnected f r o m the density probe. V
P the output of the a s p i r a t i n g p r o b e , is then t r a n s f o r m e d into a
helium concentration. A f t e r the data a r e s o r t e d into two hloclcs, one f o r e a c h p r o b e , t h e reduced data a r e w r i t t e n a s a f i l e on tape.