FREQUENCY BASED AUDIO FEATURE EXTRACTION FOR
RAGA BASED MUSICAL INFORMATION RETRIEVAL
USING LPC AND LSI
Ms.P.KIRTHIKA1, Dr. RAJAN CHATTAMVELLI 2
1
Research Scholar, Department of Computer Science and Engineering, Periyar Maniammai University, Thanjavur.
Assistant Professor, Department of Computer Science and Engineering, SNS College of Engineering, Coimbatore.
2
Associate Professor, Department of Information Technology, Periyar Maniammai University, Thanjavur. Email: [email protected] , [email protected]
ABSTRACT
This paper introduces the Audio Feature Extraction for classifying the music based on Raga which plays a major role in Music Information Retrieval (MIR) systems. The backbone Indian Classical Music is its Raga. A Raga is a particular blend of notes which follows specific laws. The existing MIR systems and audio search engines concentrate on content based audio mining and also the searches are made by Meta Data which needs human effort for tagging. The existing MIR systems also do not concentrate on Ragas . In this paper, we propose how the frequency can be used to determine a raga by using Linear Predictive Coding(LPC). We also propose a method to identify the Raga of the input audio clip using Latent Semantic Indexing(LSI).
Keywords: Musical Information Retrieval, Swara, Formants, LPC, LSI
1. INTRODUCTION
Due to large amount of data stored in the web, the multimedia data explosion created an overload. This may cause information pollution problem because the user may not get the proper data or may get the irrelevant data. In multimedia data like image, video etc., the audio plays an important role. Musical Information Retrieval which is also called as Musical Audio Mining relates to the identification of music which is needed by the user. Moreover the searches in the existing system are carried out manually by labeling filename or Metadata. Because some of them are either follows supervised or semi-supervised methods that require human input for tagging. These searches do not concentrate on audio feature. So, the content based approach should extract the information from audio without prior tags. The music is a well structured
audio which governs instruments and voice. So, the type of raga may also be determined by considering the instruments which is played back and by extracting the frequencies of those instruments. It can be used to identify the raga played by the singer(voice).
2. INDIAN CLASSICAL MUSIC
The backbone of Indian Classical Music is its Ragas. The different combinations of Swaras (musical notes) make different ragas of which each has a unique identity. Onset of the musical signal refers to Arohana and offset refers to Avarohana. Arohana[1] is the sequence of swaras used in a raga in the ascending passages and Avarohana[1] is the sequence of swaras to be used in the descending passage of the notes. The Arohana and Avarohana of a raga provide the emaciated outline upon which the rest of the raga is formed. Through this work,
we introduce a relatively new audio mining technique in which raga mining is emphasized for music information retrieval. Raga being a combination of swaras, the proposed work focuses on identification of different swaras in a input music signal. The work emphasis on fundamental frequency extraction and the various frequencies based on the fundamental frequencies which are detected for the categorization of the audio clips.
3. CHARACTERISTICS OF RAGA IN INDIAN CLASSICAL MUSIC
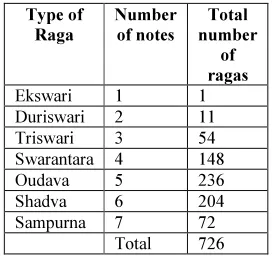
has 22 intervals (based on the notes) or shruthis as shown in Table III. These shruthis stands for the frequencies. A raga is standing on the amalgamation of frequencies selected out the 22 shruthis. There are 726 Ragas available in Indian classical Music[4]. They are shown in Table I .
Table I: Total Number of Ragas in Indian Classical Music
Type of Raga
Number of notes
Total number
of ragas
Ekswari 1 1
Duriswari 2 11
Triswari 3 54
Swarantara 4 148
Oudava 5 236
Shadva 6 204
Sampurna 7 72
Total 726
4. THE SAMPURNA RAGA
The Sampuna Raga is also called as Janaka Raga or the Melakarta Raga. These are the parent Ragas. The Sampurna Raga has the property of having all the seven notes. In those Ragas, the notes of the arohana or the ascending passage is same as of the avarohana or the descending passage. So the identification of the notes in the onset is similar to the offset. Hence for this type of raga it is sufficient to detect only the onset or the Arohana pattern which we have considered only this in our experiment. All the other raga having the notes lesser than 7 notes are called as Janya Ragas. These raga are the child Raga[5].
There are 72 Melakarta Ragas available in Indian Classsical Music. It is classified in Shudha Madhyama Ragas and Prathi Madhyama Ragas based upon the presence of M1 and M2 respectively. Some of the ragas which we have taken for testing is given below in Table II.
Tabe II: Some of the Melakarta Ragas
S.No Name of the Raga Swaras
1 Shanmugapriya S R2 G2 M2 P D1
N2
2 Kanakangi S R1 G1 M1 P D1
N1
3 Keeravani S R2 G2 M1 P
D1 N3
4 Shankarabaranam S R2 G3 M1 P
D2 N3
5. OPEN CHALLENGES
The existing MIR systems and audio search engines do not concentrate on ragas. It works by categorizing the audio data by means of keywords, metadata, manual audio tags. They are either supervised or semi-supervised methods that require human input. For a raga based unsupervised audio data clustering system, the following are the hurdles to cross over.
• How to extract and model “audio features"? • How to link audio signals to raga notes and get
the desired information of users?
• How to deal with a fast growing amount of
data?
6. RELATED WORK
Recent research in audio mining is based mostly on speaker analysis, query by humming, query by example, music information retrieval techniques and so on [6]. In biometrics, the speaker analysis plays a vital role whereas in the musical signal processing is playing its vital role in Music Information Retrieval. The Information Retrieval is processed by Manual Tagging, Metadata [7]. Some audio retrieval systems focus on track separation, chord extraction, frequency estimation and structural analysis [8]. But the music researchers and the person who loves to download music requires a well trained audio retrieval system. Indian Classical Music lovers and researchers require a music/audio retrieval system based on melody or ragas [9]. The fundamental elements of Indian Classical Music is its Ragas or the Melody, Thaala or the Rhythm of the music and Swara or the Note. The integration of these forms the music. [10].
Various distinguished properties of the audio input data should be extracted for classifying them. A content based audio retrieval uses a compact signature called as audio finger printing for extracting the relevant distinctiveness [11].
7. DEMERITS OF EXISTING SYSTEM AND ADVANTAGES OF PROPOSED SYSTEM
The musipedia [12] and shazam [11] searches audio data based on pitches, onset and offset detection and audio fingerprinting, rhythmic structure. Though it retrieves audio, it does not support on raga based information retrieval which are very much helpful for classical music lovers. They help in identifying pieces of music through various input methods, they do not support raga based music retrieval. Moreover the existing retrieval uses manual tags and meta data mainly, not on the notes[13]. The proposed system deals with only audio input and clusters the audio clips which of same raga based on the musical instrument used in the audio clip. This eradicates the manual tagging and text based audio search using Metadata.
8. INTERRELATIONSHIP BETWEEN 22 SHRUTHIS
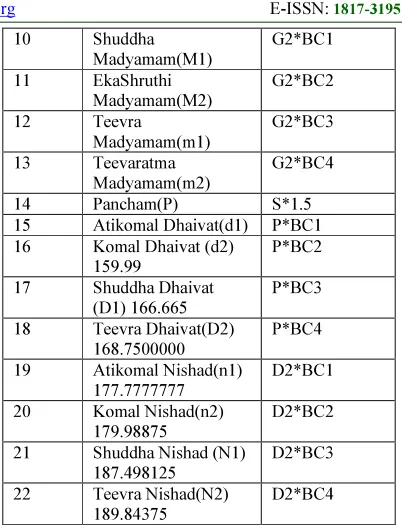
[image:3.595.307.508.113.379.2]The Indian Classical Music has the 22 shruthis or intervals which form the basis of the musical notes [14]. By detecting the fundamental frequency F0 we can compute all the shruthis and their interrelationship is given in the following Table III. It is easy to find the various shruthis if we are computing the fundamental frequency , that is the shruthi Sa. Here it is denoted as S. The Shruthis are interrelated with each other by some standard amount of percentage like 5.349742%, 6.66% , 11.11%, 12.50% based on the Fundamental frequency F0. For our convenience we are denoting the percentages as BC1=5.349742% , BC2=6.66%, BC3=11.11%, BC4=12.50%[14].
Table III: Computing the Interrelationship between 22 Shruthis
Shruthi No
Name Mathematical
Relation
1 Shadja(Sa)) Fundamental
Frequency of a signal(Say S) 2 Athikomal rishab(r1) S*BC1
3 Komal Rishab(r2) S*BC2
4 Shuddha Rishab(R1) S*BC3
5 Teevra Rishab(R2) S*BC4
6 Atikomal
Gandhar(g1)
R2*BC1
7 Komal Gandhar (g2) R2*BC2
8 Shuddha Gandhar
(G1)
R2*BC3
9 Teevra Gandhar (G2) R2*BC4
10 Shuddha
Madyamam(M1)
G2*BC1
11 EkaShruthi
Madyamam(M2)
G2*BC2
12 Teevra
Madyamam(m1)
G2*BC3
13 Teevaratma
Madyamam(m2)
G2*BC4
14 Pancham(P) S*1.5
15 Atikomal Dhaivat(d1) P*BC1 16 Komal Dhaivat (d2)
159.99
P*BC2
17 Shuddha Dhaivat
(D1) 166.665
P*BC3
18 Teevra Dhaivat(D2) 168.7500000
P*BC4
19 Atikomal Nishad(n1) 177.7777777
D2*BC1
20 Komal Nishad(n2)
179.98875
D2*BC2
21 Shuddha Nishad (N1) 187.498125
D2*BC3
22 Teevra Nishad(N2)
189.84375
D2*BC4
9. PROPOSED SYSTEM
Our proposed system is to deal with the formant extraction of Audio files based on the raga. We are considering the sampling frequency of the audio clip to be 44.1KHz. The human being audibility ranges from 20hz to 20000hz.
9.1 Nyquist Theorem
According to Nyquist Theorem the sampling frequency should be at least twice the highest frequency contained in the signal. So the sampling frequency should be twice the human audibility say 44.1khz, since the maximum audibility of us is 20000hz. The Theorem is given as follows[15].
Fs>=2Fc
where
Fs is the sampling frequency
Fc is the highest frequency
9.2 Formants Detection using Linear Predictive Coding
for speech signal analysis is based on linear predictive coding (LPC), It is also used for the effective method to detect the frequencies of the signal of the various audio clips .
We use an all pole filter with satisfactory amount of hole for processing the musical instruments and the wav files as in the following equation.
H(z)=x(z)/E(z)
=1/1-∑ akz
-k
=1/A(z)
By taking the inverse z-transform of the above equation we get
x(n)= ∑ ak x(n-k)+c(n)
By using the LPC the frequency components of the audio clips are found out.
9.3 Term Document Matrix
A Term Document matrix can be made by using these Audio clips and their frequency components. The term is the frequency found in the audio clips and the document is the Audio clip in the Term Document Matrix. The local weight can be computed by counting the number of times the frequency(word) appear in the same Audioclip (document). The global weight can be computed by counting the same term appearing in all the documents.
Here we are representing the local weight of the document by Lij, Global weight of the Document is Gij and the Tfi as the term frequency. Since the Indian classical music is having only 22 shuthis which can be simulated as the words of the document, there is no need of computing the global weight of the document[18,19,20].
So
Lij=Gij=Tfi.
We are forming the Term Document matrix in the following form by taking the shruthis as the row and the audio clips as its columns. Here the audio clips are represented as clip1, clip2 etc., in document and the 22shruthis S, R1, R2.etc., are represented as the term.
Clip1 Clip2 Clip3 ...
S 1 1 1 ...
R1 0 0 1 ...
R2 1 0 0 ...
R3 0 1 0 ...
R4 0 0 0 ...
G1 1 0 0 ... .
.
The Term Document Matrix has only 0 and 1 which indicates the presence of the respective terms in the audio clip. If a particular shruthi is present means then that is considered as 1 otherwise 0.
9.4 Singular Vector Decomposition and Latent Semantic Indexing
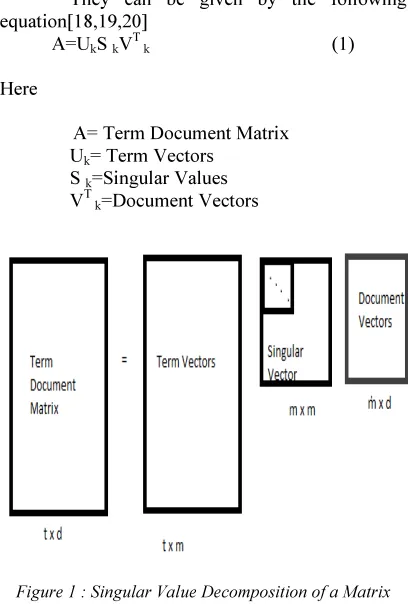
The next is to decompose the matrix so that the rows and the column of the matrix can be reduced for easy retrieval of the particular raga. It can be tested by giving a query as its input. This can be done by performing Singular Value Decomposition (SVD) which is given in as in the Figure 1.
They can be given by the following equation[18,19,20]
A=UkS kV T
k (1)
Here
A= Term Document Matrix Uk= Term Vectors
S k=Singular Values
[image:4.595.305.509.424.726.2]VT k=Document Vectors
9.5 Query Vector
The Formants are detected from the audio clip given as the query and the frequency components are plotted as the query vector. Then the Transpose of the query vector (qt) is multiplied by the term vector (Uk) and the inverse of the
singular vector (Sk T
) as follows.
The input Query will be having all the formants which are the seven distinguished frequency of the audio clip are plotted in a 22 row vector which denotes the term as 0’s and 1’s which indicates the absence and presence of the notes respectively[18,19,20].
Figure 2: Example Query
The query can be given by
Q= qt UkSk T
(2)
Here
Q = Query
qt = Query Transpose (q is denoted in the above figure)
Uk = Term Vector from Equation (1)
Sk T
= InverseTranspose of the Singular Vector
9.9 Cosine Similarity
The Cosine Similarity for the query(q) and the Document(d) is obtained by the following[18,19,20]
COSSIM(q,d)=q.d / |q||d| (3)
Here
COSSIM(q,d)=Cosine Similarity
q=Query Document d=Document Vector
9.10 Algorithm
1. Compute the Term Document matrix A 2. Decompose the Term Document A=USVT 3. Arrange the Singular Values of K in Descending Value
4. Compute the Transpose for the Query 5. Compute the Sk
-1
for the Singular Value. 6. Compute the QTUkSK
-1
7. Find the Cosine Similarity between Query and the Document as SIM(q,d)=q.d/|q||d| for all the Documents
8. Arrange the Similarity Index in Ascending order where the largest index is mostly related to the query.
10. RESULTS AND EVALUATION
We detect the formants by using the LPC. We gave the audio as its input and we got the formant of the given audio as its output. We have tried this by creating the all the ragas mentioned in Table II as wav file in matlab. Then, we have detected the fundamental frequencies and the formants by using the LPC. It can be used to analyze the various frequencies of the raga wav file. The audio clip which has the sampling frequency of 44100hz. The sample formants are shown of the Kanakangi raga wav file in the Figure 3. In Figure 3 we infer that the Fundamental frequency of the input audio clip is 550hz and also we detected the other frequency based upon the fundamental frequency using LPC (7 notes as mentioned above in Table II) and they are plotted. The Audio clips contain the shruthis in the ascending order which is need for classification.
[image:5.595.305.505.574.669.2]
Figure 3: Formant of Kanakangi Raga Audio clip
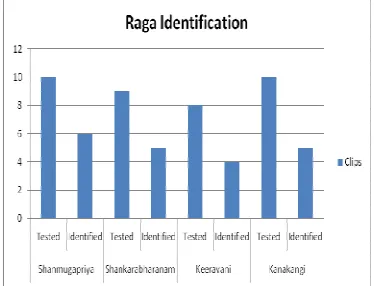
Sankarabaranam, Kanakangi, Keeravani, Shanmugarpriya Ragas for testing. These Melakartha Raga Notes are shown in Table II. We have given the total number of raga tested and identified for the above mentioned four ragas as shown in the Figure 4 below. Those formants are updated in the editor by the Matlab. This acts as the Term Document Matrix.
Figure 4: Raga identified based on Formants
The Singular value decomposition results in the product of three matrix namely term matrix , singular vectors and the document matrix. The Term Document matrix are read from the editor. An Input Audio Clip of Kanakangi raga is given and their formants are stored as a query which has 0’s and 1’s . The Cosine Distance is taken by following the above algorithm and their values are arranged in the ascending order. They act as the latent semantic index and the index which have the highest value is equivalent to the query vector. The Query and the Documents are plotted . We have four clusters of documents indicated as D1, D2, D3 and D4 say Kanakangi, Shanmugapriya, Shankarabaranam and Keeravani respectively which represents the above mentioned four ragas which are indicated as Black Arrows in Figure 5. The Query which is indicated in red belongs to Kanakangi raga and has the same query and Document values. So the query and the documents are overlapped as red and black arrows respectively. Hence the input audio clip which belongs to Kanakangi raga is correctly identified as shown below in Figure 5.
[image:6.595.96.283.228.371.2]
Figure 5: Relationship between Query and Document
11. CONCLUSION AND FUTURE WORK
In this paper, we introduced a technique for the formant extraction and their classification for music information retrieval. This discusses the importance of audio feature extraction in the field of raga mining. We have explained the various characteristics of ragas, their features, the role of frequency to extract the audio features and the latent Semantic Index. In our experiment we have examined the audio clips which was created in Matlab. In our future work based on the result of the Matlab generated audio clips, we are going to examine the audio clips by applying the track separation algorithm and implementing the same for detecting the voice of the singers. The audio clips are categorized by analyzing the formants and finding its raga based upon singer’s fundamental frequency and also the frequency of the instruments played back in the audio clips. We will concentrate on Janya Ragas also. So, our future work will target technologies/applications to summarize the audio databases based on ragas and improve the present audio search techniques.
REFERENCES:
[1] S. Shetty and K. K. Achary. “Raga mining of Indian music by extracting arohana-avarohana pattern”, International Journal of Recent
Trends in Engineering,1(1), 2009.
[2] Apte, Vasudeo Govind, “The Concise Sanskrit English Dictionary”. Delhi: Motilal Banarsidas, 1987.
[3] Ram Avtar Vir, “Theory of Indian Music” , Pankaj Publications, New Delhi, 1999.
[5] Prof.Sambamurthy , “South Indian Music”, Vol. 4 , The Indian Music Publishing House, Madras, India, 1982.
[6] Jonathan T. Foote, “An Overview of Audio Information Retrieval”, Multimedia Systems, vol. 7 no. 1, ACM Press/Springer-Verlag, January1999., pp. 2- 11,
[7] Lew, Michael S.; Sebe, Nicu; Djeraba, Chabane; Jain, Ramesh , “Content- based multimedia information retrieval: State of the art and challenges” , ACM Transactions on Multimedia Computing, Communications and
Applications, Vol. 2, No. 1, February 2006, pp.
1–19.
[8] Parag Chordia, “Automatic raag classification of pitch tracked performances uses pitch-class and pitch-class dyad distributions”, Proceedings of International
Computer Music Conference, 2006.
[9] Rajeswari Sridhar and T.V. Geetha,” Raga Identification of Carnatic music for Music Information Retrieval”, International Journal
of Recent Trends in Engineering, Vol. 1, No. 1,
May 2009.
[10] https://ccrma.stanford.edu /~pdelac/ research/ MyPublishedPapers /icmc_2001-pitch_best.pdf
[11] http://www.shazam.com [12] http://www.musipedia.org
[13] Krishnaswamy, A, “Application of pitch tracking to South Indian classical music”,
Applications of Signal Processing to Audio and
Acoustics, 2003 IEEE Workshop on 19-22 Oct.
2003.
[14] http://www.22shruti.com
[15] http://redwood.berkeley.edu/Bruno/ npb261 / aliasing.pdf
[16] http://en.wikipedia.org/wiki/Formant
[17] http://note.sonots.com/?plugin=attach&refer =SciSoftware%2 FPitch&openfile =pitch.pdf [18] http://nlp.stanford.edu/IR-book/pdf/18lsi.pdf [19] Mirzal, A, “Similarity- based matrix Completion algorithm for latent semantic indexing” , Control System, Computing and
Engineering (ICCSCE), IEEE International
Conference, 2013 pp. 79 - 84