Determining the Basaltic Sequence Using Seismic
Reflection and Resistivity Methods
A. Alanezi, A. Qadrouh
Seismic Analyses Center, King Abdulaziz City for Science and Technology (KACST), Riyadh, Saudi Arabia Email: [email protected]
Received 2013
ABSTRACT
This study was carried out in Harat Rahat (south of Almadinah Almonwarah) using seismic reflection and resistivity methods. The main objectives of this study are to determine the extent of the basaltic layer and to define the subsurface faults and fractures that could affect and control the groundwater movement in the study area. A 2D seismic profile was acquired and the result shows that the subsurface in the study area has a major fault. We obtained a well match when the seismic result was compared with drilled wells. As a complementary tool, the resistivity method was applied in order to detect the groundwater level. The results of the resistivity method showed that six distinct layers have been identified. The interpretation of these six layers show that the first three layers, the fourth layer, the fifth layer and the bottom of the section indicated various subsurface structures and lithologies; various basaltic layers, fractured basalt, weathered basement and fresh basaltic layers, respectively. It is obvious that the eventual success of geophysical surveys depend on the combination with other subsurface data sources in order to produce accurate maps.
Keywords: Seismic Method; Vertical Electrical Sounding (VES); Water Table
1. Introduction
The high-resolution seismic reflection method has per-formed effectively to delineate the subsurface structures of the earth. Many geophysicists such as [10], [15],
] 14
[ , [11] have detected coal using this method. Other investigators have utilized the high-resolution seismic reflection method for a variety of applications. For ex-ample, ][12 applied it to determine unconsolidated sedimentary structures in the Netherlands. ][ applied 8 the method to detect unconsolidated aquifers in Australia.
] 6
[ used it to assist in mine planning and future horizontal drilling for coal-seam methane extraction.
] 16
[ applied it to image a thin, diamondiferous kimberlite dyke. ][ used it to delineate growth folding 5 and shallow faults beneath the southern Puget lowland in Washington state. Electrical resistivity methods have been successfully applied in ground investigations for several purposes. Their applications in geotechnical and engineering site investigations were achieved by many authors ][ , ]9 [ , 1
] 3
[ . Soil and groundwater were mapped by other re-searchers such as ][ . ]4 [13 utilized electrical resistivity methods to locate subsurface structures. Mapping the extent of the basaltic layer and the subsurface structures were the main objectives of this study, which was carried out by using seismic reflection, drilled wells and resistiv-ity methods. The seismic results show that the subsurface in the study area has a major fault as well as the
effi-ciency of the seismic method to identify the water table level. The results of resistivity methods show that six distinct layers have been identified. Therefore, the results of seismic reflection and resistivity surveys are quite similar to the drilled wells.
1.1. Field Procedures and Data Processing Seismic Reflection Method
A 2D seismic profile was acquired using equipment and selected parameters based on the nature geological phe-nomena and area accessibility. Uncorrelated seismic data was recorded with 112 channels, where the geophone group interval and the shotpoint interval were 5m, and the offset between geophone and shotpoint was 10m, as shown in Figure 1. In addition, the selected field
pa-rameters in this study are shown in Table 1.
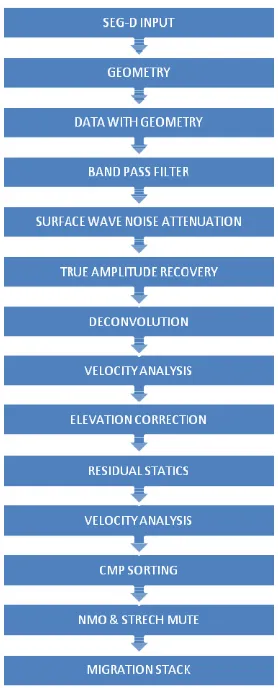
The primary objectives of seismic data processing are to produce high resolution images of the subsurface, achieved by enhancing signal to noise ratio and migrat-ing the reflected waves to their correct position. The conventional processing sequence of seismic reflection data include, but are not limited to: filtering, statics ap-plication, deconvolution, CMP sorting, velocity analysis, NMO correction, stacking and migration. Figure 2 and Figure 3 show the stacked seismic section in time scale
Figure 1. Shows the geometry of this study.
Table 1. The selected field parameters in this study.
SPREAD
Number of Traces 112 traces Receiver interval 5 m Source interval 5 m Near offset 10 m
Max.offset 555 m CDP fold 111 fold
SOURCE
Type Vibrosies Model Mini IVI No. of Vibrator One
Sweep type Linear upsweep Band width 20-300 Hz Number of Sweep 1
RECEIVER
Type Geophone Flat base Model GS – 20 DH
Response 365 ohm, 40 Hz, 0.70 Damping
INSTRUMENTS
Type Geometrics, Strata Visor NZ Sampling interval 0.5 ms
Gain constant 36 dB Sweep length 5 s Record length 2.5 s
Filter out
Figure 2. The stacked seismic section in time scale.
Figure 3. The processing steps in this research.
1.2. Electrical Resistivity Methods
The conventional equipment for resistivity surveys, such as an ammeter, voltmeter, power source, electrodes, and connecting wire were used in this research. In addition, we performed five vertical electrical soundings (VES) alone the seismic line in order to study the variation of resistivity with depth. Figure 4 illustrates that this
sounding was taken with the Schlumberger array, having a maximum separation of 1000 m between the current electrodes, and the separation of the half current elec-trodes being gradually increased from 3 to 1000 m. The maximum separation between potential currents was 120 m, with increments started from 0.6.
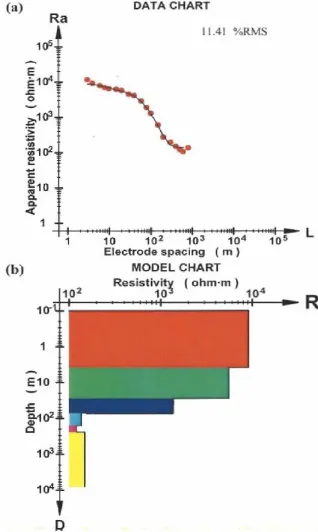
The major steps in processing resistivity data consist of the following. First, producing a sounding curve which displayed the apparent resisitivities against the electrodes spacing, as illustrated in Figure 5 Next, the
forward model in bars was created to show the curve of theoretical sounding corresponding to the model of the current earth as shown in Figure 6. After that, building
[image:2.595.77.269.205.722.2] [image:2.595.78.266.238.662.2]proceeded. Finally, the equivalence analysis was applied to indicate the earth models range that corresponded to the acquired data for the final inverted model, as revealed in Figure 7. Note that the processing of the first VES is
represented here. This is due to the fact that the process-ing sequence for the others was quite similar to steps for the first VES.
2. Interpretation of the Results
[image:3.595.335.510.82.360.2]The seismic section was interpreted in order to identify the water table layer across the survey area. The inter-pretation began by transforming the stacked section from time (ms) to depth (m), where the accuracy of such depth conversion depends on how accurate the processing of seismic data is; that is to say, accurate depth conversion depends on the accuracy of velocities and times recorded. We applied the interval velocity approach to convert the data from time to depth scale. The stacked section shows that the subsurface in the study area has a major fault. In addition, the results of the seismic section show that there are two seismic reflectors, where the second re-flector is associated with a water table at a depth range of 125 m to 230 m. This reflector is considered the surface of the third seismic layer that represents groundwater saturated fractured basalts. The abrupt and remarkable increase in the depth of the second layer is due to faulting
Figure 4. Sketch of the field setup for VES in Schlumberger array.
[image:3.595.342.501.391.657.2]Figure 5. Sounding curve.
[image:3.595.58.288.416.498.2]Figure 6. The forward model in comparison with data.
Figure 7. The inversed model in comparison with data.
[image:3.595.79.265.540.718.2]seismic data as shown in Figure 8. Table 2 demonstrates
the detail information about the five drilled wells inte-grated with stacked section to mark the water table layer related horizon. W-1 and W-2 are dry wells because they are at a shallow depth of 135m, while the water table layer is located at a depth of 230 m. The water layer is found in W-7, W-11 and W-12 at depth 125 m, 150 m, and 150 m respectively.
Resistivity Data Interpretation
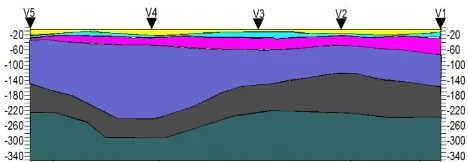
The interpretations of the five VES stations show that the area under study has six layers as shown in Figure 9.
[image:4.595.306.540.84.165.2]The first layer is a thin layer of very dry weathered basalt, with an average value of ρ = 8430 Ohm.m, and at a depth ranging from 1 to 7.5 m. The value of apparent resistivity in the second layer is about ρ > 4000 Ohm.m and at depth ranging from 7.5 to 20 m, which might be com-prised of fresh basalt. The third layer has an apparent resistivity value between 1000 to 1200 Ohm.m and at a depth range of 20 to 60 m. This layer was interpreted as fresh water saturated fractured basalt, intercalated with some gravelly sand. The analysis of the fourth layer showed that the values of apparent resistivity are be-tween 150 and 200 Ohm.m and with a depth range of 60 to 155 m. This layer was characterized as fractured basalt with clay saturated with salt-water. The values of the apparent resistivity in the fifth layer were between 100 and 120 Ohm.m and the depth range was 126 to 184 m. This layer was interpreted as a weathered basement. The sixth layer had an apparent resistivity ρ > 300 Ohm.m, and which was interpreted as compact basement.
Figure 8. Interpreted Stack (Depth) .
Table 2. The information of the five drilled wells.
Wells information W-7 W-1 W-2 W-11 W-12
Distance from 1st Geophone
(m) 117 342 530 800 1155 Water table depth (m) 125 135(dry) 135(dry) 150 150
Figure 9. This composite diagram show data from seismic and VES.
3. Conclusions
The geophysical methods used allow us to identify the subsurface structures, to obtain lithological information, and to characterize the conditions of the underground flow in the studied area. The interpretation of seismic data was agreed with the available drilled wells to locate the water table depths which varied generally from 120 m to 150 m, as well as the effectiveness of the seismic method to detect the surface fault. In addition, the resis-tivity method located the various lithologies in the sub-surface, such as different basaltic layers, fractured basalt, weathered basement and fresh basaltic layers respec-tively. It is clear that the ultimate success of geophysical surveys depends on the inclusion other subsurface data sources in order to produce precise maps.
4. Acknowledgments
The authors wish to thank KACST for their wealth of knowledge and valuable data for this research.
REFERENCES
[1] O. J. Akintorinwa and J. I. A. desoji, “Application of Geophysical and Geotechnical Investigations in Engi-neering Site Evaluation,” Pacific Journal of Science and
Technology, USA, Vol. 10, No. 2, 2009, pp. 680-692.
[2] E. A. Ayolabi, E. A. Atakpo, L. Adeoti, E. C. Otobor and T. Arerin, “Groundwater Quality Assessment Using Pre-drilling Electrical Measurements,” Journal of
Environ-mental Hydrology, Vol. 17, 2009, pp. 1-12.
[3] E. A. Ayolabi, A. F. Folorunso and M. O. Oloruntola, “Constraining Causes of Structural Failure Using Electri-cal Resistivity Tomography (ERT): A Case Study of La-gos,” Southwestern, Nigeria, Mineral Wealth, Greece,
Vol. 156, 2010, pp. 7-18.
[4] F. Cahyna, O. Mazac and D. Vendhova, “Determination of the Extent of Cyanide Contamination by Surface Geo-Electrical Methods,” SEG-Geotechnical and
envi-ronmental Geophysics, Tulsa., Vol. 2, 1990, pp. 97-99.
[5] C. R. Clement, T. L. Pratt, M. L. Holmes and B. L. Sher-rod, “High-Resolution Seismic Reflection Imaging of Growth Folding and Shallow Faults beneath the Southern Puget Lowland, Washington State,” Bulletin of the
Seis-mological Society of America, Vol. 100, 2010, pp.
[image:4.595.58.284.475.638.2][6] J. Cocker, M. Urosevic and B. Evans, “A High Resolu-tion Seismic Survey to Assist in Mine Planning: Pro-ceeding of Fourth Decennial International Conference on Mineral Exploration,” edited by A. G. Gubins, 1997, pp. 473 - 476.
[7] A. F. Folorunso, E. A. Ayolabi, S. O. Ariyo and I. O. Oyebanjo, “Fault Presence Under a Failing Building Complex Mapped by Electrical Resistivity Tomography,”
Mineral Wealth, Greece,2012.
[8] P. E. Geissler, “Seismic Reflection Profiling for Ground-Water Studies in Victoria,” Australia Geophysics, Vol. 54,
1989, pp. 31-37.
[9] P. H. Giao, S. G. Chung, D. Y. Kim, and H. Tanaka, “Electrical imaging and laboratory resistivity testing for geotechnical investigation of Pusan clay deposits,”
Jour-nal of Applied Geophysics, Vol. 52, 2003, pp. 157-175.
doi:10.1016/S0926-9851(03)00002-8
[10] S. Greenhalgh, M. Suprajitno and D. King, “Shallow seismic Reflection Investigations of Coal in the Sydney Basin,” Geophysics, Vol. v51, 1986, pp. 1426-1437. [11] H. Henson, J. Sexton and J. Jobling, “High‐Resolution
Seismic Reflection Study of Shallow Coal Seams near
Harco, Illinois,” SEG Technical Program Expanded
Ab-stracts, 1989, pp. 372-374.
[12] P. Jongerius and K. Helbig, “Onshore High-Resolution Seismic Profiling Applied to Sedimentology,” Geophys-ics, Vol. 53, 1988, pp. 1276-1283.doi:10.1190/1.1442405
[13] M. H. Khalil, “Hydrogeophysical Assessment of Wadi el-sheikh Aquifer, Saint Katherine, South Sinai, Egypt,”
Journal of Environmental and Engineering Geophysics,
JEEG, Vol. 14, No. 2, 2009, PP. 77-86.
doi:10.2113/JEEG14.2.77
[14] R. Knapp and A. E. Muftuoglu, “Detection of Coals 30 cm Thick at Depths of 50 and 60 m by Seismic Reflection. Profiling,” SEG Technical Program Expanded Abstracts,
1987, pp. 227-228.
[15] D. Palmer, “High Resolution Seismic Reflection Surveys for Coal,” Geoexploration, Vol. 24, 1987, pp. 397-408. doi:10.1016/0016-7142(87)90009-3
[16] T. C. H. Philip, M. C. Ron and R. Kumar, “High-Resoluti on Seismic Reflection Imaging of a Thin, Diamondifer-ous Kimberlite Dyke,” Geophysics, Vol. 69, 2004, pp.