http://dx.doi.org/10.4236/psych.2016.75073
Perceptual Organization of Objects Placed
on a Table and Their Level of Disorder
Manabu Gouko
Department of Mechanical Engineering and Intelligent Systems, Faculty of Engineering, Tohoku Gakuin University, Tagajo, Japan
Received 19 April 2016; accepted 16 May 2016; published 19 May 2016
Copyright © 2016 by author and Scientific Research Publishing Inc.
This work is licensed under the Creative Commons Attribution International License (CC BY).
http://creativecommons.org/licenses/by/4.0/
Abstract
In this study, the author investigated the relationship between the layout of objects placed on a table and tidying up. The author developed a system that can tidy up through cooperation be-tween a robot and human. For realizing this system, it was necessary to investigate the types of in-stances in which people think a table top is disorderly. The author conducted an experiment in which participants were asked to evaluate the disorder condition of presented table images. The participants were also asked to answer how many objects on a table would be collected into groups. The results indicated that objects organized into more groups were rated as untidier than objects organized into fewer groups.
Keywords
Disorder, Table Top, Perceptual Organization
1. Introduction
In an aging society, a robot that supports our daily lives is crucial. Above all, housework, cleaning, and tidying up contribute to the realization of a comfortable living environment (Thomas & Don, 2006). The automatic cleaning robot “Roomba” (iRobot) has grown in popularity. It can move around a room and collect trash. How-ever, an automatic system that can tidy up disordered things has not been developed.
This paper is organized as follows. Section 2 describes works related to this study. The experimental setup is described in Section 3. Discussion of the experimental results is presented in Section 4. Conclusions and de-scriptions of future work are presented in Section 5.
2. Related Works
2.1. Tidying-Up System for a Table Top
Nishimoto et al. proposed the system Table Cross, which encourages humans to tidy up a table top (Nishimoto et al., 2011). The system observes the degree of disorder of a table located in a shared work space and informs workers via their PC desktop. It automatically generates garbage icons on the desktops of the workers’ PCs, re-flecting the disorder of the table top. The system calculates a ratio between the occupancy area of the object on a table and the total table top. Nishimoto et al. define this ratio as the degree of disorder of the table: The higher the ratio, the more disordered the table top situation. In this study, the layout of the objects was not considered.
2.2. Order and Disorder of a Visual Stimulus
Matsuda and Kaneko investigated the stimulus factors giving rise to impressions of order and disorder (Matsuda & Kaneko, 2014). In this study, they used visual stimuli comprising 4 × 4 square areas and presented them to participants. The participants evaluated the disorder of the shown patterns. The results of this research indicated that a valuing of gathering and local repetition affect impressions of order and disorder.
Studies on the goodness and complexity of presented patterns have been conducted. Garner and Clement in-vestigated the relationship between the goodness of a pattern and uncertainty (Garner & Clement, 1963). In this research, they used patterns shown in Figure 1. These patterns were presented to participants. Participants then evaluated the goodness of the pattern. The results indicated a tendency in which a participant thinks that a good pattern is one that cannot change easily to reflection or rotation conversion.
Chapman investigated what type of pattern features affect complexity (Chipman, 1977). In his experiment, a two dimensional pattern made by combining black and white squares was adopted. Chapman defined the fea-tures of the pattern using quantitative variables and structural variables. For example, the quantitative variable is the number representing the boundary around a black and white square. The result showed that the quantitative variable affects the limit of pattern complexity and that the structural variables reduce complexity.
[image:2.595.144.487.521.708.2]Kodama and Miura explored the relationship between pattern goodness and perceptual organization (Kodama & Miura, 2011). Perceptual organization refers to the informational processes structuring visual information into a coherent group. In the experiment, dot patterns were presented to participants. Following this, the goodness of each pattern was evaluated, and participants answered questions regarding a number of groups of perceptual or-ganization. The results showed that there is a tendency for participants who answered by claiming that the dots are collected to hold that the pattern is good.
Figure 1. Stimuli used in the study (Garner & Clement, 1963).
ESS1
ESS4
ESS8
1-1 1-2
4-1
8-1
4-2
8-2
4-3
8-3
4-4
8-4
4-5
8-5
4-6
8-6
4-7
8-7
2.3. Hypotheses
Many previous studies have used artificial patterns (e.g., black and white squares and dots) as visual stimuli. However, people hardly see such patterns in everyday life. Therefore, in this study, a visual stimulus pattern made up of images of actual stationery was used. In this research, the author assume the following two hypo-theses based on the results of previous researches:
1) There is a tendency for the persons who answer that the stationery on the table has been collected to answer that the table has been tidied up.
2) There is a tendency for persons to answer that the table has been tidied up when the layout of the stationery is difficult to be converted.
The first and second hypotheses are based on previous research (Kodama & Miura, 2011) and (Garner & Clement, 1963), respectively.
3. Experiment
Experiment participants evaluated the degree of order in presented visual stimulus (patterns). The author used patterns consisting of several images of stationery located on a table. Participants responded into how many groups stationery was classified. In this chapter, the author explain how to make the visual patterns and how to conduct the experimental procedure.
3.1. Visual Stimulus Pattern
The visual stimulus pattern was made based on a pattern used in a previous study by Garner and Clement (Garner & Clement, 1963). These researchers used the pattern shown in Figure 1. These patterns were produced by placing dots in the center of cells of an imaginary 3-by-3 square matrix. The patterns were those that could be generated with five dots, and with the restriction that each row and each column contain at least one dot. Seven-teen patterns in Figure 1 were named basic patterns.
The number that set the pattern was produced when it was converted by reflection or rotation. The pattern, with the basic pattern itself, was classified using the numbers 1, 4, or 8. The names of the classifications are ESS1, ESS4, and ESS8 (ESS: Equivalence Set Size). Each class includes 2 (= 2 × 1), 32 (= 8 × 4), 56 (= 7 × 8) patterns. 32 patterns belonging to ESS4 and 56 patterns belonging to ESS8 were used for producing visual sti-muli patterns, named table patterns.
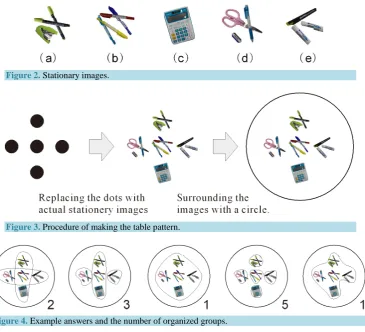
The table pattern used in the experiment explained later was produced by replacing the dots with actual sta-tionery images. Figure 2 shows actual stasta-tionery images. Details regarding the actual stasta-tionery images used are as follows:
(a) A stapler and two highlighter pens; (b) Four permanent markers;
(c) A calculator;
(d) Scissors, an eraser, and a mechanical pencil; (e) A cutter and two stick paste.
Each pattern from (a) to (e) was rotated by a unit of 90 degrees, and four patterns were generated. Figure 3 shows the procedure for making the table pattern. The stationery image, correspondence of the dot, and direction (four) of the stationery images were chosen at random. The table pattern was surrounded by a circle. This circle represents the edge of the table. The thickness of its line is 0.5 mm. Table patterns are 1/10th the size of an 800 mm diameter table. The sizes of each piece of stationery are also in the ratio of 1/10th.
3.2. Experimental Procedure
In the experiment, a total of 88 table patterns were generated from dot patterns belonging to EES4 and EES8. The table patterns were printed on A4 paper and presented to a participant. Four gray-scale printed table patterns were located on one page. The presentation order of the table picture was random for every participant.
diffe-rential scale method (from 1: It is very much tidied up, 7: It is very much in disorder)”, and “By drawing a line directly on to the printed paper, participants answer into how many groups stationery is classified”. This instruc-tion was presented to participants with a presentainstruc-tion of Figure 4 (example answers).
4. Results and Discussion
[image:4.595.134.500.171.503.2]Figure 5 shows the correlations between the number of organized groups and order rating values. In this figure,
Figure 2. Stationary images.
[image:4.595.179.451.511.702.2]Figure 3. Procedure of making the table pattern.
Figure 4. Example answers and the number of organized groups.
Figure 5. Correlations between the number of organized groups and disorder rating values. 3
4 5
2 3 4
D
is
o
rd
e
r
ra
ti
n
g
v
a
lu
e
s
The number of organized groups 4 - 4
4 - 1 4 - 6 4 - 5
4 - 3 4 - 2
4 - 7 4 - 8
8 - 3 8 - 4
8 - 7 8 - 2
8 - 1
8 - 5
8 - 6
6
ESS4
each mark expresses the average value for every pattern (4-1 - 8-6). The correlation coefficient of the table pat-terns based on ESS4 is 0.990 (p < 0.001). The correlation coefficient of the table patterns based on ESS8 is 0.802 (p < 0.05). These results support the first hypothesis that there is a tendency for participants who answered that the stationery on the table was collected to answer that the table has been tidied up.
However, the second hypothesis was not established. This hypothesis was that there is a tendency for partici-pants to answer that the table has been tidied up when the layout of the stationery is hard to be converted. If this hypothesis were true, participants would have been expected to answer that the patterns based on EES4 were tidier than those based on EES8. However, the rating values of the patterns based on ESS4-2, 4-7 and 4-8 were low compared with some patterns based on ESS8. This result indicates that the context of the table top affects the participants’ cognitions.
5. Conclusion and Future Work
In this study, the author investigated the relationship between the layout of objects placed on a table and pers-pectives on whether they are tidy. The author conducted an experiment in which participants were asked to eva-luate the order condition of presented table images. The participants were also asked to specify how many groups the objects on a table would be collected into. The result reveals that things organized into fewer groups are rated as tidier than those organized into more groups. The results indicated that objects organized into more groups were rated as untidier than objects organized into fewer groups.
In this experiment, the author used a visual stimulus that was created by replacing dots with multiple statio-nery images (Figure 3). However, statiostatio-nery images include complexity in and of themselves. Therefore, the author will conduct the same experiment using the visual stimulus that was created by replacing the dots with single stationery images. In the future, the author will also conduct an experiment that expands the layout range from ESS4 - ESS8 to ESS1 - ESS16.
Acknowledgements
This work was supported by JSPS KAKENHI Grant-in-Aid for Scientific Research(C) 15K00363.
References
Chipman, S. F. (1977). Complexity and Structure in Visual Patterns. Journal of Experimental Psychology, 106, 269-301. http://dx.doi.org/10.1037/0096-3445.106.3.269
Garner, W. R., & Clement, D. E. (1963). Goodness of Pattern and Pattern Uncertainty. Journal of Verbal Learning & Verbal Behavior, 2, 446-452. http://dx.doi.org/10.1016/S0022-5371(63)80046-8
Kodama, Y., & Miura, K. (2011). Pattern Goodness and Perceptual Organization. The Japanese Journal of Psychology, 82,
277-282. (In Japanese). http://dx.doi.org/10.4992/jjpsy.82.277
Matsuda, Y., & Kaneko, H. (2014). Gathering and Repetition of the Elements in an Image Affect the Perception of Order and Disorder. International Journal of Affective Engineering, 13, 167-173. http://dx.doi.org/10.5057/ijae.13.167
Nishimoto, K., Ikenoue, A., Shimizu, K., Tajima, T., Tanaka, Y., Baba, Y., & Wang, X. (2011). TableCross: Exuding a Shared Space into Personal Spaces to Encourage Its Voluntary Maintenance (pp. 1423-1428). Proceedings of CHI2011 Extended Abstract.ACM New York. http://dx.doi.org/10.1145/1979742.1979785