Munich Personal RePEc Archive
Changing Dimensions of India’s Growth
Process: A State Level Analysis
Misra, Biswa
Xavier Institute of Management Bhubaneswar
March 2009
Online at
https://mpra.ub.uni-muenchen.de/21848/
Changing Dimensions of India’s Growth Process: A State Level Analysis
Growth of the Indian economy has been quite impressive during 2004-07. This paper chronicles the performance of the states in India during this high growth phase. The growth performance during 2000-03 is taken as the benchmark to compare and contrast the changing growth patterns across sectors in different states. Apart from sectoral growth, sectoral contributions to state output, variability of sectoral output and contribution of different sectors to overall growth in the spatial dimension have been studied. The results broadly indicate a decline in the importance of the service sector during the high growth phase and increased variability in output in the states. While maintaining the high growth rates of the primary and secondary sectors remains a challenge, increased variability of output raises serious concerns on the continuity of the high growth momentum in the future.
Key Words: Sectoral Growth, variability of growth and contribution to growth JEL Classification: 047, 018,R12
The growth record of the India economy has been much better in the
post-reform period. In the initial years after economic post-reforms, the growth rate of the
Indian economy averaged 6.5 per cent during 1993-94 and 1996-97. This growth
rate was a stark contrast to the negative growth witnessed in the crisis year of
1991-92. However, the subsequent years were marked by a growth slowdown. It
is widely believed that the Indian economy has entered a new growth trajectory
beginning with the year 2003-04. The average growth rate during 2000-03 at 5.1
per cent has significantly increased to 8.8 per cent during 2004-07. The surge in
investment rate from 25 per cent in 2002-03 to 33.8 percent in 2006-07 gives
credence to the new growth trajectory (GoI, 2007). The high growth witnessed
during 2004-07 has prompted the planning commission to target a 9 per cent per
annum growth during the 11th five-year plan (2007-08 to 2011-12).
Higher growth, however, would be better accepted and sustained, if growth
character of the growth process is more relevant in the democratic set up of a
country like India where rising aspirations of people can only be met by growth
that is evenly shared across regions. India has been forthright to articulate its
development ambitions through the mechanism of five-year plans since 1951.
Under the broad rubric of growth, balanced regional development has been one of
the explicit planks of economic policy in India since the early days of planning.
For instance, the 1956 Industrial Policy Resolution of the Government of India
asserted that ‘only by securing a balanced and coordinated development of the
industrial and agricultural economy in each region, can the entire country attain
higher standards of living’. In a similar vein, the National Integration Council in
1961 emphasized the importance of regional balance in economic development as
a positive factor in promoting national integrationi. The Third Plan explicitly
mentioned that ‘balanced development of different parts of the country, extension
of the benefits of economic progress to the less developed regions and widespread
diffusion of industry are among the major aims of planned development’. The
subsequent plans have also reiterated the need for a more balanced regional
development.
Ahluwalia (2000) was the first attempt to study Regional growth
performance in India in the post reform period. Ahluwalia (2000) finds substantive
interstate variation in the growth performance in the 14 major states in the in the
post-reform period 1991-92 to 1997-98 when compared to the pre-reform period
actually decelerated sharply in Bihar, Uttar Pradesh and Orissa, all of which had
relatively low rates of growth to begin with and were also the poorest states. The
degree of dispersion in growth rates across states also increased very significantly
in the 1990s. In the more recent times, Misra (2007) provides a detailed analysis of
growth performance at the spatial level in the post-reform period. This study
compares the growth performance across two time periods 1981-93 and the
1994-2004 corresponding to the pre-reform and post-reform period respectively and also
the sectoral growth performance. This study also finds huge variation in the
growth performance across states.There was deceleration in growth in the primary
and secondary sectors and an acceleration of growth in the tertiary segment in the
post-reform period. The variability of SDP had also declined in the post-reform
period. While the contribution of the primary and secondary sector to the all India
growth declined that for the tertiary sector increased significantly close to 70 per
cent in the post reform period.
Scope of the study
Whether the high growth observed at the all India level during 2004-07 is
shared evenly across regions is a matter worth pondering. In this paper we study
the different dimensions of the growth process such as growth and variability of
sectoral outputs, contribution of different sectors to the overall growth in the
spatial dimension.
India has in all thirty-five regions comprising twenty-eight States, six
states of the north and north-eastern part of India are considered as ‘special
category’ by the Planning Commission. Following this classification eleven out of
the twenty-eight states are identified as Special category States (SCS) and the rest
as general category states (GCS). The SCS are termed so, as they receive a special
treatment in allocation of funds released for planned development from the
Planning Commission. While for the GCS the proportion of loans is 70 percent
and that of grants is 30 percent, for the SCS the same are 10 and 90 respectively.
Most of the studies on India’s regional economic performance [Ahluwalia
(2002), Singh and Srinivasan (2005)] consider the performance of fourteen major
States, mostly belonging to the GCS. Because of their special features, Ahluwalia
has excluded the north eastern and other special category states from his study.
While deliberating on growth at the state level, it is common to find discussions
centring on the GCS and at times Assam and Himachal Pradesh also gets included.
Like Ahluwalia, many other researchers on India’s regional growth performance
have justified the exclusion of the special category states on the ground that the 14
states account for bulk of the population and output1. The reason for concentrating
on the fourteen major states is mainly two fold - lack of availability of consistent
data and the difference in the structure of their economies in contrast to the special
category states. A third reason that is cited in favour of concentrating on fourteen
states only is that these fourteen states account for a major share in output and
population, thus representative. While by the yardstick of the structure of
economy, the special category states and the Union territories are placed on a
different footing, it would be interesting to see how the SCS as a group have
performed given the ‘special’ attention paid to them, in contrast to the GCS, on
various growth parameters. It is true that the special category states (SCS) are not
on a comparable footing with the general category states (GCS) as such, they
should not be clubbed together. But then by the same principle that the SCS shares
some commonality, they can be treated as a homogeneous group and it would be
interesting to study how the SCS have performed vis-à-vis the GCS in the
post-reform period.
As such, this paper traverses the different dimensions of the growth for
individual states as well as for three broad categories, GCS, SCS and UTs over
two time periods viz, 2000-03 and 2004-07 to appreciate the changing face of
growth in India. The rest of the paper is organisd as follows. Section-1 discusses
the growth record at the macro level for the Indian economy and also for the
states. The changes in the sectoral growth performance in the states across the two
time periods are attempted in section-II. Section-III comments on the stability of
growth at the aggregate and the sectoral level for the states. Contribution of
different sectors to the growth in the spatial dimension is discussed in Section-IV.
contribution to all India growth in output and population. Section-VI provides
concluding observations based on the discussions in the previous sections and also
by analyzing the importance of different states in the all India output.
1. Growth Performance at All India Level
Before we embark upon an analysis of the growth performance at the state
level, we begin with a brief review of the growth performance at the all India
level. Between 1999-2000 and 20006-07, GDP has increased by 1.6 times,
population increased by 1.1 fold and consequently, per capita GDP by 1.5 times.
Segregating the post 2000 period further to the sub periods 2000-03 and 2004-07,
one finds that GDP growth has gone up from 4.8 percent per annum in 2000-03 to
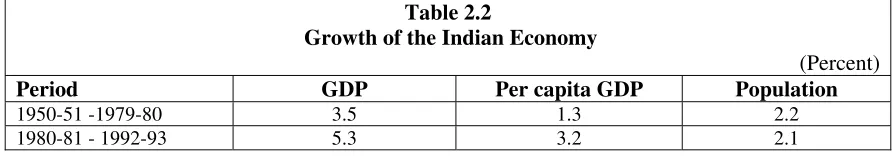
9.0 percent in 2004-07. This GDP growth rate is enviable compared to the Hindu
rate of growth of 3.5 per cent per annum during the first thirty years after India
began its planning process. Though growth rate had increased to 5.5 per cent in the
1980s and further to 6 per cent between 1994-2004, the growth has been by far
the best in the 2004-07 period compared to all the other sub periods. A similar
scenario holds when we investigate the growth performance in per capita terms
[image:7.612.82.528.641.719.2](Table-1).
Table 2.2
Growth of the Indian Economy
(Percent)
Period GDP Per capita GDP Population
1950-51 -1979-80 3.5 1.3 2.2
1993-94 - 2003-04 6.0 4.1 1.9
2003-04- 2006-07 9.0 7.5 1.5
Note: GDP figures are at factor cost and at constant prices. Growth rates are compound annual growth rates, computed using a semi log specification of output over time.
The per capita GDP growth mimics the growth pattern of absolute GDP
across the various sub periods. As the 2003-04 to 2006-07 period is also
characterized by the lowest population growth when compared to any other sub
period, per capita GDP growth has also been the highest in this period. Given this
overall picture, now we engage our attention to the situation in the States.
At the State level, the State Domestic Product (SDP) represents
output. Table-2 depicts the SDP growth of the GCS, SCS and also some union
territories for the periods 2000-03 and 2004-07. Specifically, we have considered
the growth profile of 17 states in the GCS, 8 states in the SCS special category and
three UTs. The GCS account for the bulk in all India population and output.
Compared to the period of 2000-03, when their share was 84.4 percent in GDP and
93 in all India population, it declined to 82.2 and 92.9 respectively in the period
2004-07. The share of SCS in all India GDP while has declined marginally to 3.5
per cent from 3.6 per cent in 2004-07 period compared to that of 2000-03, their
share in the country’s population has remained the same at 4.1 per cent across the
two sub periods. The three UTs accounted for another 3.6 per cent of All India
GDP across the two-sub period. However, the share of UTs in the total population
has increased marginally to 1.7 per cent in 2004-07 from 1.6 per cent in 2000-03.
increasing from 1.4 percent during 1981-93. Thus seen from a historical
perspective, the population share has been rising only in case of UTs. Ideally, the
GSDP and per capita GSDP figures over a particular time period should differ by
the population growth in that period. Here, because of rounding off errors, the
relationship between GSDP, per capita GSDP and population growth may not hold
in some cases. Certain interesting features emerge from Table-2. First, the overall
growth performance of the GCS as a group has been much better in the 2004-07
phase compared to the period preceding it. Second, compared to the GCS as a
group, the SCS, which had a better growth record in the 2000-03 period, have
fared poorly in the high growth period 2004-07. Thus the growth differential
between the GCS and SCS, which was negative 1.4 per centage points during
2000-03, has turned to positive 1 per centage points in the 20004-07 periods.
Third, the UTs as a group have performed better than the GCS and SCS in both
the sub periods. The growth of UTs has also been at a higher pace compared to the
all India growth figures in both the sub periods. Fourth, population growth across
all the three categories have declined in the high growth phase of 2004-07
compared to that in 2000-03. The deceleration has been the maximum for the UTs
followed by the GCS and SCS respectively. Fifth, growth recorded by the GCS
and SCS states fell quite short of the all India growth in the post reform period.
While the wedge between the growth of GCS and all India growth has narrowed, it
prevails when we compare the per capita growth figures of GCS and SCS to that
of the all India figures.
Between GCS and SCS, the per capita population growth has been
impressive at 6.3 per cent per annum in the 2004-07 for the GCS. This is because
of a relatively low SDP growth in 2000-03 and a much faster growth in 2004-07
coupled with faster decline in population growth for the GCS relative to SCS over
the 2000-03 period. The decline in population growth has been the maximum for
the UTs in the two sub periods under study. However, the UTs had a very high
population growth in the 2000-03 period. In spite of a decline of 0.5 percentage
points, the growth rate of population at 2.8 per cent per annum for UTs, during
2004-07 is the highest amongst all the three categories of states under study.
Notwithstanding the very high population growth, the per capita growth in SDP
for UTs has been quite significant at 7 per cent per annum because of close to 10
per cent of spectacular growth in SDP recorded during 2004-07 period. The better
growth record of the UTs as a group, however, needs to be viewed in the context
that the four UTs account for a very small proportion of the all India population
and the GDP.
Overall, there has been noticeable improvement in per capita GSDP for all
the three categories of State in the post reform period because of the sobering
effect of a slow down in population growth during this period. Table-2, also
presents the growth rate of GSDP and per capita GSDP across the States. The state
GSDP, all states belong to the GCS category experienced higher growth in the
2004-07 period compared to the 2000-03 period. Within GCS, except for
Karnatak, Kerla, Madhya Pradesh, Punjab, Rajasthan, Uttar Pradesh and West
Bengal, all other states recorded a higher than the group growth rate during
2004-07. Thus if we judge the States’ performance by the criterion that they have not
only done better than their own past but by that could surpass the growth recorded
by GCS as a group, 10 out of the 17 states pass this criterion.
Growth in Output and Population
STATE GSDP GSDP
Per Capita GSDP
Per Capita
GSDP GPOP GPOP
2000-03 2004-07 2000-03 2004-07 2000-03 2004-07 Andhra Pradesh 5.0 8.2 4.1 7.1 1.0 1.1
Bihar 6.1 10.4 3.6 8.7 2.5 1.7
Chattisgarh 3.4 9.8 2.0 7.9 1.4 1.9
Gujarat 4.2 9.9 2.1 8.3 2.0 1.6
Haryana 7.5 9.8 5.2 8.1 2.3 1.7
Jharkhand 0.3 10.8 -1.7 9.2 2.0 1.6
Karnataka 4.3 7.3 2.9 6.0 1.4 1.2
Kerala 5.3 7.8 4.4 6.7 1.0 1.1
Madhya Pradesh -0.6 4.0 -2.6 2.2 2.0 1.8
Maharashtra 3.1 9.1 1.3 7.5 1.7 1.6
Orissa 2.1 9.1 0.9 7.9 1.2 1.2
Punjab 2.8 5.7 1.2 3.8 1.6 1.8
Rajasthan 0.4 4.2 -2.0 2.3 2.4 1.9
Tamil Nadu 1.6 8.5 0.7 7.7 0.9 0.8
Utranchal 8.8 9.5 7.0 7.9 1.8 1.6
Uttar Pradesh 2.6 5.8 0.4 3.8 2.2 1.9 West Bengal 5.2 7.7 4.0 6.5 1.3 1.1
GCS 3.4 7.9 1.7 6.3 1.7 1.5
Arunachal Pradesh 6.8 6.4 5.2 5.1 1.6 1.2
Assam 3.9 6.2 2.3 4.8 1.6 1.4
Himachal Pradesh 5.5 8.4 3.8 6.7 1.6 1.8
Manipur 0.5 6.0 -1.6 4.0 2.1 2.0
Mizoram 7.2 6.3 4.6 3.8 2.6 2.6
Sikkim 7.6 8.3 4.9 6.9 2.7 1.3
Tripura 9.2 8.6 8.5 7.4 0.8 1.2
SCS 4.8 6.9 3.2 5.5 1.6 1.5
Delhi 4.9 10.2 1.5 7.3 3.4 2.9
GOA 2.7 10.6 -0.2 7.7 2.9 2.9
Pondicherry 9.7 1.2 7.8 -0.7 1.9 1.9
UT 5.0 9.8 1.7 7.0 3.3 2.8
India 4.8 9.0 3.0 7.4 1.8 1.5
In the SCS category, except for Arunachal Pradesh, Mizoram and Tripura
the rest five states have witnessed a higher growth of GSDP in the 2004-07 period.
However, growth of five out of the eight states was below the GSDP growth for
the SCS as group in the 2004-07. This is in sharp contrast to only two states who
had a growth performance less than the CSC as group in the 2000-03 period.
Amongst the GCS, per capita growth has gained momentum in all the
States viz, in the 2004-07 period. While only 9 states posted a higher than the
group growth during 2000-03, as many as 13 states had a similar experience
during 2004-07. Madhya Pradesh. Punjab, Rajasthan and Uttar Pradesh
experienced growth that was below the threshold of combined GCS per capita
GSDP growth in both the sub periods. The per capita growth of Jharkhand,
Madhya Pradesh and Rajasthan, which was negative during 2000-03, turned
positive in 2004-07. Within SCS, per capita GSDP growth accelerated in all states
except Arunachal Pradesh, Mizoram and Tripura. Further, compared to as many as
six states in 2000-3, only 3 states had a higher per capita growth than that of the
Pondicherry. In fact, Pondicherry had a negative per capita GSDP growth during
2004-07. However, unlike Delhi and Goa in 2000-03, only Pondicherry had a per
capita growth that was less than that of UTs as a group in 2004-07. Slowdown in
growth of population though is seen both for the GCS and SCS; it is slightly more
for the GCS.
Amongst the GCS, Bihar, Gujarat, Haryana, Jharkhand, Madhya Pradesh,
Rajasthan, Uttaranchal and Uttar Pradesh had a higher population growth in the
2004-07 compared to that for the combined GCS. Further, Andhra Pradesh,
Chattisgarh, Kerala and Punjab experienced acceleration in population growth
during 20004-07 compared to 2000-03. While the growth in population was
marginally higher for three out of these four states, it was substantive for
Chattisgarh. Bihar ad Rajasthan could contain population growth substantially in
the 2004-07 period; Gujarat, Haryana, Jharkhand and Uttar Pradesh also made
good progress in this regard. Within SCS deceleration in population growth was
witnessed in all states except Himachal Pradesh and Tripura. All the UTs under
study either maintained the same population growth in 2004-07 as in 2000-03
except for Delhi which experienced a significant decline.
Having discussed the broad growth trajectory of the GCS, SCS and UTs, it
becomes pertinent to enquire if any pattern emerges when sectoral growth rates are
considered. This is what we would be discussing in the next section.
All the three sectors witnessed robust growth in 2004-07 compared to that
in 2000-03 period at the all India level.2 Sectoral growth pattern across the states
has been one of acceleration in growth in the primary and tertiary sector for the
GCS and SCS in the 2004-07 period. GCS posted a sharp acceleration growth in
the growth of their secondary sector, where as the SCS experienced a small
deceleration in 2004-07. It may, however, be noted here that the deceleration of
the secondary sector growth for the SCS was from a very high level of 10 per cent
per annum witnessed in 2000-03. As far as UTs are concerned, growth was
negative for the primary sector in both the sub periods. Further, the negative
growth of the primary sector was of a higher order in the 2004-07 period. The
secondary and tertiary sector for the UTs as a group, however, recorded very high
growth rates in 2004-07 compared to that observed in the preceding period.
Notwithstanding the better performance for the GCS as a group across all
the three sectors, primary sector growth in Bihar and Jharkahnd, secondary and
tertiary sector growth in Uttaranchal has declined in 2004-07 period compared to
that in 2000-03. When we consider the growth of primary sector for the GCS, the
following facts emerge. First, compared to four states in 2000-03, only two states
recorded negative growth in their primary sector in 2004-07. Primary sector
growth was negative for Rajasthan in both the sub periods and for Jharkhnad, the
positive growth seen in 2000-03 has turned negative in 2004-07. Karnataka,
Madhya Pradesh, Rajasthan and Tamil Nadu, which had negative growth in the
2
primary sector in 2000-03, clocked positive growth in 2004-07 except for
Rajasthan. Compared to 11 states in 2000-03, only 9 states had a higher primary
sector growth than the GCS as a group. However, the primary sector growth for
GCS was much higher and close to 4 per cent per annum as compared to less than
0.5 per cent in 2000-03.
The growth in the secondary sector output has been higher in 2004-07
compared to the 2000-03 period for all states except Karnataka and Uttaranchal.
Further, compared to only seven states in 2000-03, as many as 11 states recorded a
much higher growth than that for GCS as a group in 2004-07. Thus the secondary
Growth of SDP Across Sectors
STATE GPPRIM ARY GPPRIM ARY GPSECOND ARY GPSECO NDARY GPTERTI ARY GPTER
TIARY GPSDP GPSDP 2000-03 2004-07 2000-03 2004-07 2000-03 2004-07 2000-03 2004-07 Andhra
Pradesh 1.55 6.66 4.94 8.41 7.28 9.08 5.02 8.23 Bihar 7.20 5.98 1.12 25.12 6.42 9.63 6.05 10.36 Chattisgarh 1.46 5.64 4.33 16.46 4.51 9.11 3.41 9.81 Gujarat 5.05 5.73 1.63 10.82 5.99 11.04 4.16 9.88 Haryana 0.65 3.41 8.11 11.29 12.14 12.30 7.52 9.81
Jharkhand 1.54 -1.63 -4.08 21.87 3.06 8.54 0.27 10.80 Karnataka -4.14 6.95 7.54 5.83 7.42 8.08 4.34 7.26 Kerala 1.71 5.94 4.93 8.01 6.87 8.23 5.35 7.76 Madhya
Pradesh -5.80 1.29 -0.08 4.89 2.54 5.42 -0.60 4.04 Maharashtra 2.27 4.12 -0.82 10.35 5.20 9.83 3.06 9.08 Orissa 0.02 4.90 -1.73 15.88 5.20 9.18 2.09 9.10 Punjab 0.41 2.53 1.72 10.84 5.53 5.30 2.79 5.67 Rajasthan -3.75 -1.93 1.29 8.37 2.55 6.75 0.39 4.20 Tamil Nadu -5.26 10.59 0.21 6.79 4.44 8.86 1.63 8.49 Utranchal 0.69 2.48 20.61 17.80 8.31 8.21 8.77 9.55 Uttar Pradesh 0.97 2.53 2.24 10.27 4.14 5.80 2.62 5.77 West Bengal 2.83 3.04 7.02 12.27 6.03 8.40 5.22 7.67
Arunachal
Pradesh 0.60 3.97 19.56 12.79 5.67 3.49 6.78 6.36 Assam -0.40 3.43 12.41 4.65 4.99 8.63 3.90 6.20 Himachal
Pradesh 8.60 1.31 5.89 12.30 3.23 9.24 5.50 8.44 Manipur 1.60 2.16 2.74 10.45 -1.06 5.76 0.52 6.03 Meghalaya 5.25 3.99 7.88 10.53 5.01 6.07 5.52 6.16 Mizoram -1.21 3.75 12.13 5.94 8.73 7.12 7.18 6.33 Sikkim 6.60 4.46 17.67 11.03 4.31 8.42 7.64 8.29 Tripura 4.61 6.02 23.28 6.39 7.53 10.80 9.25 8.61
SCS 1.83 3.23 10.01 8.56 4.71 8.48 4.81 6.94 Delhi -0.50 -2.27 6.14 12.38 4.74 9.90 4.93 10.25 GOA -1.20 -0.47 6.34 11.84 1.28 12.80 2.71 10.61 Pondicherry -2.33 -1.85 15.24 -0.83 5.93 3.84 9.74 1.16
UT -1.08 -1.27 7.21 10.72 4.56 9.88 4.97 9.80
India 0.45 3.84 5.20 10.78 6.81 10.34 4.78 8.97
sector growth has not only taken a leap forward in the 2004-07 period but the
growth has also been broad based.
In the tertiary sector, growth acceleration is observed for all states except
Uttaranchal. An equal number of 8 states witnessed higher than the group’s
tertiary sector growth in both the sub periods. Andhra Pradesh, Bihar, Gujarat,
Haryana, Karnataka and West Bengal recorded higher than the growth of the GCS
as a group in the secondary sector consistently in both the sub periods.
As far as the SCS are concerned, though not a single state recorded
negative growth, two states witnessed growth deceleration in their primary sector
in 2004-07. The growth acceleration in the primary sector for the SCS has also
been broad based. Compared to only four states, as many as six states posted
higher growth in the primary sector than that for the SCS as a group in 2004-07.
secondary sector in 2004-07, growth deceleration is observed for the majority of
the states within SCS. Though growth has been much better in the tertiary segment
for the SCS as a group, three states experienced growth deceleration. However,
compared to the tertiary growth observed for the SCS as a group, as many as five
states in each sub period had a lower growth.
For the UTs, primary sector growth was negative in both the sub periods
and was of a higher order in 2004-07. All the three states under study also
recorded negative growth in their primary sector. In the secondary sector, there
was growth acceleration for UTs as a group. Compared to only one state, two
states notched a better growth performance in the ir secondary sector in the
2004-07 period compared to that in 2000-03. The tertiary sector has also grown for the
UTs as a group at a much higher pace in 2004-07 as compared to 2000-03. Only in
case of Pondicherry there was a growth deceleration amongst the UTs under study.
The growth rate of GSDP for the GCS has more than doubled between 2004-07
over 2000-03. Further, a higher growth than that for GCS as a group is observed
for ten states in 2004-07 as compared to for only 9 states in 2000-03. While
Jharkhnad and Rajasthan had growth rates less than 0.5 per cent, Madhya Pradesh
had a negative growth in GSDP during 2000-03. This scenario has changed
completely in the 2004-07 period when the minimum growth recorded by any of
the GCS is 4 per cent.
While growth per se is important, its stability is equally a matter of
concern. We now discuss the stability of growth across the states. While output
has grown faster in the 2004-07 period, it has also been more volatile. Like for the
GDP figure at the All India level, variability of SDP for GCS, SCS and UTs as a
group has increased in the high growth phase 2004-07 compared to that in
2000-03 (Table-4). If we analyse the inter-sectoral variability of the States under GCS
group, the following points emerge: Variability of SDP has increased in all the
states in the 2004-07 period. For the GCS as a group, variability of the output
originating from all the three sectors has increased in the 2004-07 period. The rise
in the CV for secondary sector has been of the highest order followed by that for
primary and
Variability in Output Across Sectors and States
STATE Primary CV Primary CV Secondary CV Secondary CV Tertiary CV Tertiary
CV CVPSDPCVPSDP State 2000-2003 2004-2007 2000-2003 2004-2007 2000-2003 2004-2007 2000-2003 2004-2007
Andhra Pradesh 5.7 8.4 6.9 10.5 9.0 11.3 6.4 10.3 Bihar 14.8 11.0 4.5 29.3 8.0 12.7 8.8 13.6 CHATTISGARH 9.9 8.4 8.4 19.4 5.9 11.4 6.0 12.3 GUJARAT 10.2 9.2 7.0 13.3 8.0 13.4 6.7 12.2 Haryana 1.7 5.1 10.2 13.8 14.6 15.0 9.3 12.2
Jharkhand 6.6 7.7 19.6 24.9 4.7 10.7 4.5 13.9
Karnataka 7.3 9.4 9.8 7.4 9.2 10.1 5.5 9.0
Kerala 2.2 7.4 6.4 10.0 8.8 10.2 6.8 9.6 Madhya Pradesh 13.8 2.5 0.7 6.2 3.2 6.8 3.4 5.1
Maharashtra 4.0 6.9 5.1 12.9 6.8 12.0 4.7 11.3 Orissa 6.0 6.2 4.0 19.1 6.6 11.3 3.2 11.2
GCS 2.6 5.2 4.4 12.6 7.0 10.6 4.4 9.8
Arunachal
Pradesh 4.0 6.3 31.9 19.5 7.1 4.9 9.6 9.2 Assam 0.9 4.4 17.3 5.9 6.3 11.0 5.2 7.8 Himachal
Pradesh 10.8 3.1 7.5 15.5 4.2 11.4 6.9 10.5
Manipur 3.1 5.0 7.2 12.8 4.5 7.2 3.2 7.6 Meghalaya 7.0 5.0 10.1 12.8 6.3 7.6 6.9 7.7 Mizoram 4.0 4.8 15.1 8.6 10.9 8.9 9.2 8.1 Sikkim 8.2 5.6 20.4 13.5 5.8 10.4 9.5 10.3 Tripura 8.8 7.7 25.8 8.1 9.7 13.3 11.6 10.7
SCS 2.4 4.2 12.7 10.7 6.0 10.6 6.1 8.7
Delhi 1.5 3.4 8.9 14.9 6.1 12.3 6.4 12.6
Goa 7.9 2.0 7.9 15.2 4.7 15.4 4.7 13.1 Pondicherry 3.5 3.6 17.9 10.6 7.7 5.0 11.9 5.9
UT 3.4 1.9 9.5 13.2 5.9 12.3 6.4 12.2 India 3.0 5.1 6.6 13.2 8.6 12.8 6.0 11.2
tertiary sector. While, increases in variability of output in the primary and
secondary sector is noticed for 11 states, the same for secondary and tertiary sector
has been for 15 states each in the 2004-07 period compared to the 2000-03 period.
For eight states viz, Andhra Pradesh, Haryana, Jharkhand, Kerala, Maharastra,
Orissa, Tamil Nadu and Uttar Pradesh increased variability in output is observed
in all the three sectors in the 2004-07 period. In Bihar, Chattisgarh, Gujarat,
Madhya Pradesh, Rajasthan and West Bengal, increase in variability is noticed
both in the secondary and the tertiary sectors.
Within SCS, variability of SDP increased for seven out of the eight states
under study. Variability in primary sector output increased for four states and that
for secondary and tertiary sector output increased for three and six states
respectively in the 2004-07 period over the 2000-03 period. While for Himachal
tertiary sectors, in case of Manipur all sectors witnessed higher volatility in the
2004-07 period.
In case of UTs higher variability in SDP is observed in case of Delhi and
Goa. While Delhi witnessed increased variability in output originating from all the
three sectors, in case of Goa, output from secondary and tertiary sector only
showed increased variability during 2004-07 as compared to that in 2000-03. In
case of Pondicherry, there was a slight increase in variability in output from the
primary sector only in the 2004-07 period.
IV. Changing Sectoral Shares in Output
That India has graduated from a predominantly primary producing
economy to a services led economy and the industrial revolution has bypassed it
Share of Different Sectors in Output
State Primary Primary Secondary Secondary Tertiary Tertiary
2000-03 2004-07 2000-03 2004-07 2000-03 2004-07
Andhra Pradesh 31.1 29.1 20.6 20.7 48.3 50.2
Bihar 35.7 31.0 11.1 13.1 53.2 55.9
Chattisgarh 35.7 34.2 23.2 27.6 41.1 38.3
Gujarat 18.7 19.4 37.2 37.0 44.1 43.5
Haryana 29.4 23.9 28.3 29.9 42.2 46.2
Jharkhand 31.1 23.5 29.5 39.7 39.4 36.7 Karnataka 26.4 20.4 24.7 25.9 48.9 53.7
Kerala 21.4 18.3 20.7 21.5 57.9 60.2
Madhya Pradesh 29.4 30.2 21.3 20.7 49.2 49.1
Maharashtra 16.3 14.7 26.7 26.6 57.0 58.7
Orissa 34.4 32.1 18.9 20.9 46.6 47.0
Punjab 36.3 33.4 22.6 24.2 41.1 42.4
Rajasthan 31.0 32.1 25.6 25.8 43.5 42.1 Tamil Nadu 16.4 13.5 28.9 28.5 54.7 57.9
Uttaranchal 27.0 22.0 22.5 28.9 50.5 49.1 Uttar Pradesh 34.6 31.3 21.6 23.6 43.8 45.1
West Bengal 30.4 26.7 16.8 19.2 52.8 54.1
Assam 38.4 33.4 13.8 17.2 47.8 49.4 Himachal Pradesh 24.9 24.2 36.5 37.7 38.6 38.1
Manipur 28.5 27.8 22.3 28.5 49.2 43.7
Meghalaya 31.8 30.5 15.1 16.9 53.1 52.5
Mizoram 20.0 16.9 16.7 17.5 63.3 65.6
Sikkim 21.7 20.3 23.0 26.5 55.4 53.2
Tripura 28.1 25.2 19.0 21.9 52.9 52.9
SCS 32.9 29.4 20.1 23.4 46.9 47.2
Delhi 1.3 1.0 18.8 19.6 79.8 79.4
Goa 14.9 13.3 37.6 38.5 47.5 48.2
Pondicherry 6.3 5.1 48.5 48.6 45.1 46.3
UT 2.9 2.4 22.2 22.8 74.9 74.8
India 25.9 22.1 23.2 24.1 50.9 53.8
has been a matter of recurring debate. Papola (2005) provides a brief overview of
the state of the debate and also his own perspective on the sustainability of a
services led growth. Here, we chronicle the tendencies for structural
transformation in the high growth phase of 2004-07 across the States.While at the
all India level, tertiary sector contributes to more than half of the GDP in the
2004-07 period, the amplitude of its contribution varies significantly across the three
different categories of states. For instance, tertiary sector’s contribution to SDP is
around 75 per cent for the UTs, but it is of the order of only 49 and 47 percent
respectively for the GCS and SCS as groups. Same is the case for the primary
sector’s contribution to SDP. While for GCS, primary sector’s contribution is 24
per cent; the same for SCS and UTs is 29 and 2.4 percent respectively in the
2004-07 period. As we do not find a uniform pattern of sectoral contribution across the
GCS, SCS and UTs, it would be instructive to go further down at the level of
Within GCS, the tertiary sector has accounted for almost half of the SDP in
both the periods. However, the share of primary sector, which was 2.6 percentage
points higher than that for the secondary sector in the SDP during 2000-03, has
become 1.2 per centage points less than that for the secondary sector during
2004-07. Chattisgarh has retained its position as the state where primary sector’s
contribution at 35.7 and 34.2 per cent is highest amongst all states during 2000-03
and 2004-07 period respectively. Amongst all states, Gujarat, which had the
highest share of secondary sector during 2000-03 at 37.32 per cent, has given way
to Jharkhand in 2004-07 at 39.7 per cent. The share of tertiary sector in SDP was
highest for Kerala in both the time periods at around 60 per cent in 2004-07. Only
in case of Gujarat and Jharkhand, secondary sector contributes to more than one
third of the SDP during 2004-07.
The range of variation amongst the GCS in the tertiary sector’s contribution
to SDP has increased in the 2004-07 period. For example, the range which, varied
between 57.9 percent for Kerala to 39.4 for Jharkhand in the 2000-03 period has
increased in the 2004-07 period, between 60.2 for Kerala to 36.7 for Jharkhand.
The range of contribution of primary and secondary sector to SDP has also
increased marginally in the 2004-07 period. While in the primary sector the range
of variation has increased from 19.4 to 20.7, the same for secondary sector has
increased to 26.6 in 2004-07 from 26.1 in 2000-03 period. The increase in the
range of variation has been maximum for the tertiary sector followed by the
For the SCS, the range of variation of the contribution of primary and
secondary sectors to state SDP has declined and that for the tertiary sector has
gone up in the 2004-07 period. For instance, contribution of tertiary sector was the
minimum for Arunachal Pradesh at 45.3 percent and maximum for Mizoram at
63.3 percent in the 200-03 period giving a range of 18. This has increased to 27.5
in the 20004-07 period with 38.1 percent for Himachal Pradesh and 65.6 per cent
for Mizoram. While the range of contribution of the primary sector has declined
from 18.4 to 16.5 in the 2004-07 period; the States, which accounted for the
lowest (Mizoram) and the highest (Assam) contribution of the primary sector to
SDP amongst the eight states, however, have remained the same. As far as UTs
are concerned, the range of variation of contribution to different sectors to SDP
has declined for all the three broad sub sectors.
V. Sectoral Contribution to Growth
In the preceding sections we have discussed the growth of different sectors
across the States and the changing shares of different sectors in the SDP in the two
sub-periods 2000-03 and 204-07. The discussion on the share of different sectors
in SDP and on their growth leads us to comment on the relative importance of
different sectors in their contribution to the growth for the States and how the
same has changed over time. For GCS as a group, contribution of primary and
secondary sector to growth has increased and that of tertiary sector has gone down
in the 2004-07 period. While the contribution of primary sector to growth for the
cent in 2000-03, the contribution by secondary sector to growth has been doubled
to 33 per cent. The contribution from tertiary sector to growth has seen a sharp
decline to 55 per cent in 2004-07 from 80 per cent in 2000-03. This pattern in the
contribution of different sector to growth also observed at the all India level,
however, with a lesser intensity. The situation is, however, different for the SCS.
While the share of primary sector in its contribution to overall growth has slightly
increased, that for tertiary sector has increased substantially during 2004-07
compared to the preceding period. The rise in the contribution of the tertiary sector
is matched by a fall in the contribution of the secondary sector in the GSDP
growth both for the SCS and UTs as a group. Within the GCS, only for Bihar,
Contribution to Growth
State Prmary Prmary Secondary Secondary Tertiary Tertiary 2000-03 2004-07 2000-03 2004-07 2000-03 2004-07 Andhra Pradesh 9.6 23.5 20.3 21.2 70.1 55.3
Bihar 42.1 17.6 2.0 31.2 55.9 51.2
Chattisgarh 15.5 19.4 29.8 45.6 54.7 35.0
Gujarat 22.5 11.2 14.4 40.4 63.0 48.4
Haryana 2.5 8.2 30.2 34.2 67.3 57.6
Jharkhand 99.0 -3.4 -248.0 75.9 249.0 27.4
Karnataka -24.8 19.5 42.3 20.8 82.5 59.7
Kerala 6.8 14.0 19.1 22.1 74.1 63.8
Madhya Pradesh 360.8 9.6 3.6 24.9 -264.4 65.6
Maharashtra 11.9 6.6 -7.0 30.1 95.2 63.2
Orissa 0.4 17.1 -15.5 36.0 115.1 46.9
Punjab 5.3 14.8 13.8 45.9 80.9 39.3
Rajasthan -419.3 -14.2 119.3 49.2 399.9 64.9 Tamil Nadu -53.2 16.9 3.8 22.8 149.4 60.4
Uttaranchal 2.1 5.6 51.4 52.9 46.6 41.5
Uttar Pradesh 12.8 13.6 18.4 41.6 68.8 44.9 West Bengal 16.5 10.5 22.6 30.5 61.0 59.0
GCS 3.7 11.9 16.1 33.0 80.2 55.1
Assam -3.9 18.5 43.4 12.9 60.5 68.6 Himachal Pradesh 38.6 3.8 38.8 54.7 22.6 41.5
Manipur 84.2 9.9 112.1 48.9 -96.3 41.3
Meghalaya 30.2 19.7 21.6 28.8 48.2 51.5
Mizoram -3.3 10.0 27.8 16.4 75.5 73.6
Sikkim 18.2 10.9 51.5 35.2 30.3 53.9
Tripura 13.4 17.6 45.6 16.2 41.1 66.3
SCS 12.5 13.6 41.7 28.8 45.8 57.6
Delhi -0.1 -0.2 23.5 23.6 76.7 76.6
Goa -6.4 -0.6 84.7 42.7 21.6 57.9
Pondicherry -1.5 -7.4 74.5 -31.3 27.0 138.6
UT -0.6 -0.3 32.1 24.9 68.5 75.4
India 2.4 9.4 25.2 28.8 72.4 61.8
Gujarat, Jharkhand, Madhya Pradesh, Maharastra and West Bengal, the
contribution of primary sector to growth has declined in the 2004-07 period.
Jharkhand and Rajasthan showed negative contribution of the primary sector to
growth in the 2004-07 period. Andhra Pradesh in the 2004-07 period has replaced
Madhya Pradesh of the 2000-03 period in having the highest contribution to
growth originating from the primary sector.As many as 9 states had a higher
contribution to growth from the primary sector than what is observed for the GCS
as a group during 2004-07. Except for Karnataka and Rajasthan, all other states
have witnessed a rise in the contribution of secondary sector to overall SDP
growth. When we consider the contribution of secondary sector to overall growth,
Jharkhand during 2004-07 has replaced Rajasthan during 2000-03 in having the
largest contribution. Eight states in had a larger contribution to growth from
secondary sector than that for the GCS as a group in both the sub periods. Three
states had a negative contribution to growth from secondary sector during
state during 2004-07. As far as tertiary sector’s contribution to growth is
concerned except Madhya Pradesh, which had a negative contribution during
2000-03, all other states have witnessed a decline.
Within SCS, five out of eight states had a higher contribution from primary
sector to growth of SDP compared to that for SCS as group during 2000-03.
Number of such states has been reduced to four during 2004-07. Further, unlike
contribution from primary sector to SDP growth, which was negative for two
states, Assam and Mizoram during 2000-03, all states had a positive contribution
to growth from this sector during 2004-07. Contribution of primary sector to SDP
growth increased for only three states during 2004-07 compared to 2000-03. As
far as contribution of secondary sector to SDP growth is concerned, Arunachal
Pradesh and Meghalaya witnessed a small increase. Four states in each period had
a higher contribution of secondary sector compared to that for the SCS as a group
in each period. In the tertiary sector’s contribution to growth, as many as six states
experienced an increase during 2004-07 compared to the previous period.
Within the UTs all the three regions experienced a negative contribution to
growth from the primary sector in both the periods. The negative contribution has
become a little less during 2004-07 for Goa only. Secondary sector’s contribution
to growth turned negative for Pondicherry during 2004-07. For Goa, the
secondary’ sector’s contribution has almost halved compared to the 2000-03
period. Only, Delhi retained the secondary sector’s contribution to growth at 23.5
contribution to growth from the tertiary sector where as Delhi retained a similar
contribution to SDP growth during 2004-07
VI. Contribution to All India Growth in Output and Population
The growth of different states contributes to the growth of the entire Indian
economy. Growth of states would make more sense if we consider also their share
in country’s output and population. A higher growth for a state, which accounts
for a larger share in country’s GDP, augurs well for the stability of growth.
Whereas, a state with a higher share of population if grows faster can have
positive welfare implications. The GCS accounted for the largest share in
country’s GDP. Within the GCS, only Chattisgarh, Gujarat, Madhya Pradesh,
Maharastra, Orissa, Rajasthan, Tamil Nadu increased their contribution to GDP
growth during 2004-07 compared to that in 2000-03. If we consider individual
states, Maharastra alone accounts for 13 per cent of Country’s output. It also has
the largest contribution to India’s growth both during 2000-03 and 2004-07.
Andhra Pradesh and West Bengal also contributed in the range of 11 to 12 per cent
during 2000-03. However, both these states have witnessed a decline in their
contribution to India’s GDP growth in the 2004-07 period. The decline has been
quite appreciable for West Bengal.
Uttar Pradesh accounted for more than 16 per cent of India’s population,
highest for any state. It also contributed the maximum to India’s population
growth in both the sub periods and its contribution to population growth has
Kerala, Madhya Pradesh, Maharastra, Orissa, Punjab, Uttaranchal and Uttar
Pradesh witnessed a higher contribution to population growth during 2004-07 than
that noticed for 2000-03 period.
Amongst the GCS, the newly created Uttaranchal accounted for the lowest
share India’s GDP and population in both the sub periods. Only Andhra Pradesh,
Gujarat, Haryana, Jharkhad, Orissa increased their share in All India GDP. Only
six states viz, Maharastra, Uttar Pradesh, West Bengal, Andhra Pradesh, Tamil
Nadu and Gujarat accounted for more than half of India’s GDP in 2000-03. The
share of these six states has slightly declined to 49.6 per cent during 2004-07.
Barring the newly created states of Uttaranchal, Jharkahnd and Chhatisgarh,
Orissa and Bihar accounted for the lowest share in All India GDP.
Contribution to GDP Growth and Population Growth by States
STATE Share in GDP Share in GDP Share in Population Share in Population Contribution to GDP Growth Contribution to GDP Growth Contribution to Population Growth Contribution to Population Growth
2000-03 2004-07 2000-03 2004-07 2000-03 2004-07 2000-03 2004-07 Andhra Pradesh 7.4 7.3 7.4 7.3 11.4 8.5 4.1 5.2
Bihar 2.9 2.7 8.1 8.1 5.5 4.0 11.5 9.0
Chattisgarh 1.5 1.5 2.0 2.0 1.5 2.1 1.6 2.6
Gujarat 5.9 6.4 4.9 4.9 7.5 9.0 5.8 5.1
Haryana 3.0 3.2 2.0 2.1 6.9 4.4 2.7 2.3
Jharkhand 1.7 1.8 2.6 2.6 0.1 2.8 3.0 2.7 Karnataka 5.4 5.1 5.1 5.1 7.3 5.2 4.2 4.0
Kerala 3.8 3.8 3.1 3.0 6.3 4.2 1.7 2.1
Madhya Pradesh 4.1 3.6 5.9 6.0 -0.8 2.1 6.8 7.2 Maharashtra 13.2 13.1 9.4 9.4 12.5 16.8 9.4 9.6
Orissa 2.3 2.4 3.6 3.5 1.5 3.0 2.5 2.7
Punjab 3.7 3.3 2.4 2.4 3.2 2.7 2.2 2.9
GCS 84.4 82.2 93.0 92.9 88.5 91.3 93.0 92.8
Arunachal Pradesh 0.1 0.1 0.1 0.1 0.2 0.1 0.1 0.1
Assam 1.9 1.8 2.6 2.6 2.3 1.6 2.4 2.4
Himachal Pradesh 0.8 0.8 0.6 0.6 1.4 1.0 0.6 0.7
Manipur 0.2 0.2 0.2 0.2 0.0 0.1 0.3 0.3
Meghalaya 0.2 0.2 0.2 0.2 0.3 0.2 0.3 0.2
Mizoram 0.1 0.1 0.1 0.1 0.2 0.1 0.1 0.2
Sikkim 0.1 0.1 0.1 0.1 0.1 0.1 0.1 0.0
Tripura 0.3 0.3 0.3 0.3 0.8 0.4 0.1 0.3
SCS 3.6 3.5 4.2 4.2 5.3 3.4 3.9 4.1
Delhi 3.1 3.1 1.3 1.4 4.7 4.4 2.6 2.7
GOA 0.3 0.3 0.1 0.1 0.3 0.5 0.2 0.3
Pondicherry 0.2 0.2 0.1 0.1 0.6 0.0 0.1 0.1
UT 3.6 3.6 1.6 1.7 5.5 5.0 3.0 3.1
VI. Concluding Observations
This Paper was an attempt to chronicle the growth process in Indian states
during the recent high growth phase 2004-07. While the growth rate for the all the
three categories of states have increased, the doubling of SDP growth for the GCS
which account for more than 80 per cent of all India GDP stands out as a
noticeable progress. Within GCS, a perceptible pick up in the growth momentum
for majority of states including many poor states augurs well for the Indian
economy. The share of secondary sector has surpassed that of the primary sector in
the SDP for the GCS. Another noticeable feature of the growth process relates to
the sectoral contribution to growth. There has been a sharp decline in the share of
tertiary sector and a rise in the share of both primary and secondary sector in the
sector however, still dominates in the contribution to growth for the SCS and the
UTs. An increase in contribution to growth from the primary and secondary sector
has been more due to the surge in growth rate of these sectors than a perceptible
rise in their shares in the SDP. Thus it remains a challenge to continue the high
growth momentum of the primary and secondary sectors in all the three categories
of states to reduce the dependency on the tertiary sector to achieve 9 per cent
growth in the 11th five year period. Another disquieting feature of the growth
process relates to the stability of the high growth momentum. The rise in
variability of output for all the three category states and more importantly for all
the states in the GCS category raises serious concerns on the continuity of the high
growth momentum in the future.
References
Ahluwalia, Montek, S (2000), ‘Economic Performance of States in Post-Reform Period’,
Economic and Political weekly, pp.1637-1648.
Ahluwalia, Montek (2002), State Level Performance Under Economic Reforms In India,
in Anne Krueger, ed., Economic Policy Reforms and the Indian Economy, Chicago:
University of Chicago Press.
Bajapai Nirupam and Sachs, Jeffrey D (1996), ‘Trends in Inter-State inequalities of
Income in India’, Harvard Institute for International Development, Development
Discussion paper No.528.
Bajapai Nirupam and Sachs, Jeffrey D (2002), ‘Understanding Regional Economic
Growth in India’, Center for International Development at Harvard University, CID
Working Paper No.88.
Bhandari, Laveesh and Aarti Khare (2002), ‘The Geography of Post 1991 Indian
Government of India (2007): Eleventh Five Year Plan (Vol.1), Planning Commission of
India
Singh, Nirvikar and Srinivasan T.N. (2002), ‘Indian Federalism, Economic Reform and
Globalization’, paper prepared for CREDPR project on Globalization and Comparative
Federalism.
Misra Biswa Swarup (2007), Reegional Growth Dyanics in India in the post e-conomic
Reforms Period, Palgrave Macmillan, Londoan
Rao, M Govinda, Shand, R. T. and Kalirajan, K. P. (1999), ‘Convergence of Income
across Indian States: A Divergent View’, Economic and Political Weekly, March
27-April 2, Vol XXXIV, No 13, pp. 769-78.
Papola T.S. (2005), ‘Emerging Structure of Indian Economy: Implications of Growing
Inter-sectoral Imbalances’, Presidential Address at the 88th Annual Meet of the Indian
Economic Association, Andhra University, Visakhapatnam, India.
Annex: 1 Data Issues
The State Domestic Product (SDP) data published by the Central Statistical Organization
(CSO) spreads over seventeen sub sectors. The classification of the primary, secondary
and tertiary sector is based on the following sub sectors:
Primary Sector: ‘Agriculture’, ‘forestry and logging’, ‘fishing’ and ‘Mining and
quarrying.’
Secondary Sector: ‘Registered manufacturing’ and ‘unregistered manufacturing’,
‘construction’ and ‘electricity, Gas and Water supply’. Sum of the registered and the
unregistered components gives the figures for manufacturing
Tertiary Sector: Transport (Railway and by other means), ‘Storage’ and communication,
‘trade, hotel and restaurants’, ‘banking and insurance’, ‘Real Estate, Ownership of
i
The National Integration Council (1961) held that ‘a rapid development of the
economically backward regions in any state should be given priority in national and state
Plans, at least to the extent that the minimum level of development is reached for all