www.impactjournals.com/oncotarget/ Oncotarget, 2016, Vol. 7, (No. 52), pp: 87194-87205
Identification of differentially expressed genes in the
development of osteosarcoma using RNA-seq
Yihao Yang1,*, Ya Zhang1,*, Xin Qu1,*, Junfeng Xia1, Dongqi Li1, Xiaojuan Li1, Yu Wang1, Zewei He1, Su Li1, Yonghong Zhou1, Lin Xie1,*, Zuozhang Yang1,*
1Bone and Soft Tissue Tumors Research Center of Yunnan Province, Department of Orthopaedics, The Third Affiliated Hospital of Kunming Medical University (Tumor Hospital of Yunnan Province), Kunming, Yunnan 650118, China
*These authors contributed equally to this work and co-first authors
Correspondence to: Zuozhang Yang, email: [email protected], [email protected]
Lin Xie, email: [email protected]
Keywords: differentially expressed genes, network, primary osteosarcoma, metastatic osteosarcoma, target
Received: August 15, 2016 Accepted: November 07, 2016 Published: November 24, 2016
ABSTRACT
Objective: Osteosarcoma (OS) is a malignant bone tumor with high morbidity in young adults and adolescents. This study aimed to discover potential early diagnosis biomarkers in OS.
Results: In total, 111 differentially expressed genes (DEGs) were identified in primary OS compared with normal controls and 235 DEGs were identified in metastatic OS compared with primary OS. AURKB and PPP2R2B were the significantly up-regulated and down-regulated hub proteins, respectively, in the PPI protein-protein network (PPI) network of primary OS. ISG15 and BTRC were the significantly up-regulated and down-regulated hub proteins, respectively, in the network of metastatic OS. The DEGs in metastatic OS compared with primary OS were significantly enriched in the arachidonic acid metabolism, malaria, and chemokine signaling pathways. Finally, we employed quantitative real-time polymerase chain reaction (qRT-PCR) to validate the expression levels of candidate DEGs and the results indicated that our bioinformatics approach was acceptable.
Materials and Methods: The mRNA expression profiling of 20 subjects was obtained through high-throughput RNA-sequencing. DEGs were identified between primary OS and normal Control, and between primary OS and metastatic OS, respectively. Functional annotation and PPI networks were used to obtain insights into the functions of DEGs. qRT-PCR was performed to detect the expression levels of dysregulated genes in OS.
Conclusions: Our work might provide groundwork for the further exploration of tumorigenesis and metastasis mechanisms of OS.
INTRODUCTION
Osteosarcoma (OS) is a common primary malignant bone tumor with high morbidity in young adults and adolescents [1]. The most prevalent locations for OS are the distal femur and proximal tibial metaphyses [2]. OS is characterized by high local aggressiveness and rapid-metastasizing potential to the lungs and results in poor survival for patients with OS.
The therapeutic strategies for OS include wide tumor resection, adjuvant chemotherapy, and radiotherapy, which have significantly improved the prognosis of patients with
malignancy [3]. Despite extensive advancements in surgical techniques, the 5-year survival rate of OS patients remains at 60–70% [4]. Lung metastasis contributes to the primary cause of mortality in OS patients, and the 5-year survival rate of patients with metastatic OS is only 10 to 20% [5].
To date, the pathogenesis of OS is not elucidated. It is reported that miRNAs, cytokines, dysregulated genes, and gene polymorphisms are associated with OS tumorigenesis and metastasis. miR-542-5p plays a critical role in cell proliferation and promotes OS tumorigenesis by targeting HUWE1, which predicts a poor prognosis for OS patients [6]. Decreased IL-6 expression inhibits
OS growth and metastasis via activation of the STAT3 and ERK pathways in vitro and in the nude mouse model. In addition, IL-6 suppression reduces tumor self-seeding by circulating tumor cells in OS [7]. High expression of Gelsolin (GSN) correlates with tumor size, advanced Enneking stage, and poor prognosis in OS patients. Knockdown of GSN significantly inhibits cell proliferation and invasiveness through the down-regulation of p-AKT and the p-P38 pathway [8] . In the Chinese Han population, IL-10 -1082A/G and IL-8 -251 A/T genotypes are associated with increased susceptibility of OS, and the IL-8 -251 A/T genotype increases risk for development and metastasis in patients with OS [9, 10].
OS, with high malignancy and metastasizing potential to the lungs frequently results in poor survival. Therefore, the study of biomarkers for OS development and metastasis is important for improving the survival of patients.
In this study, we used high-throughput RNA-sequencing to obtain mRNA expression data from peripheral blood of normal controls, primary OS and metastatic OS patients and to identify differentially expressed genes between primary OS and normal control and between metastatic OS and primary OS. Our aim was to provide valuable information for the identification of early diagnosis biomarker for OS development and metastasis.
RESULTS
Transcriptome sequencing of subjects
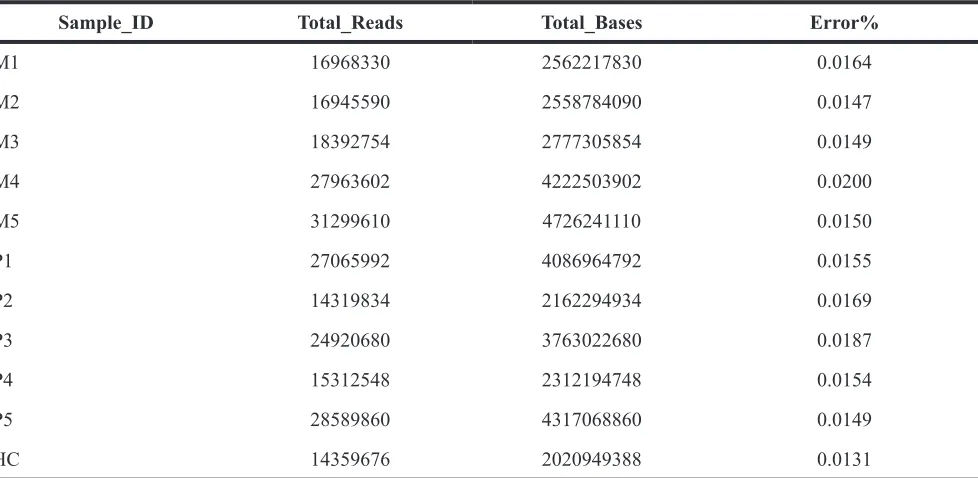
High throughput RNA-sequencing was performed on the blood samples of 10 subjects with OS (5 primary OS patients and 5 metastatic OS patients) and 10 healthy controls. Control samples were pooled for RNA-seq. Approximately, 1.7 × 10⁷, 1.7 × 10⁷, 1.8× 10⁷, 2.8 × 10⁷, and 3.1 × 10⁷ sequencing reads were generated from metastatic OS specimens; 2.7× 10⁷, 1.4× 10⁷, 2.5× 10⁷, 1.5× 10⁷, and 2.9× 10⁷ reads were generated from primary OS specimens; and 1.4 × 10⁷ reads were generated from pooled normal specimens, as Table 1 shows. All of the sequencing reads were aligned to the UCSC human reference genome (hg.19). Basic information about the patients is shown in Supplementary Table S1.
DEGs between primary osteosarcoma and healthy control
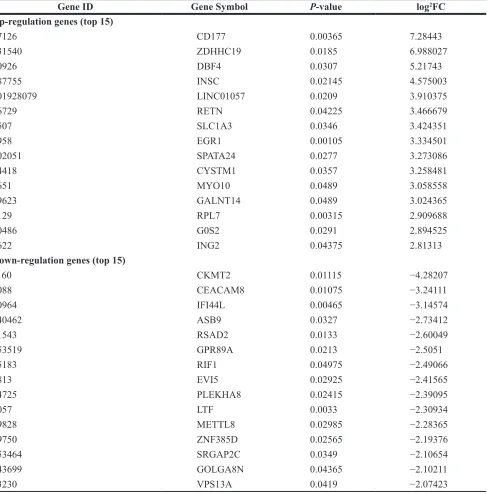
The mRNA expression data of the 5 primary OS blood samples and 1 pooled normal blood sample was obtained using RNA-seq. In total, 111 significantly DEGs were identified in primary OS compared with normal control, which consisted of 68 up- and 43 down-regulated genes. CD177 was the most significantly up-regulated gene and CMKT2 was the most significantly down-regulated gene. The top 15 genes exhibiting significant
up- and down-regulation are listed in Table 2. The full list of DEGs is shown in Supplementary Table S2.
Functional annotation of DEGs between primary osteosarcoma and healthy control
GO annotation was performed using the 111 DEGs in primary OS to obtain insights into their biological roles. The threshold for GO terms was P < 0.05. Regulation of microtubule polymerization or depolymerization (GO: 0031110), post-embryonic development (GO:0009791), and regulation of ossification (GO: 0030278) were the most enriched biological processes. Protein binding (GO: 0005515), microtubule plus-end binding (GO: 0051010), and voltage-gated calcium channel activity (GO: 0005245) were the most enriched molecular functions. Cytoplasm (GO: 0005737), plasma membrane (GO: 0005886), and cytosol (GO: 00058293) were the most enriched cellular components. These data are shown in Supplementary Table S3. The signaling pathways of DEGs between primary OS and normal controls were not available in the KEGG database.
PPI networks of DEGs between primary OS and healthy control
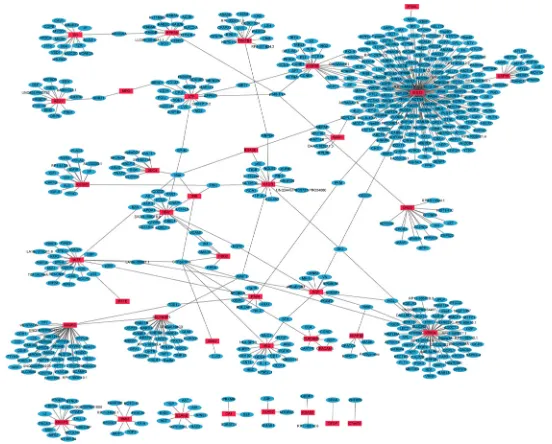
PPI networks of 68 up- and 43 down-regulated DEGs in primary OS were constructed by Cytoscape. Hub proteins indicated that the nodes had high connectivity with other nodes. In the up-regulated DEGs network, 835 nodes and 964 edges were available and the most significantly up-regulated hub protein was AURKB (Figure 1). In the down-regulated DEGs network, 579 nodes and 597 edges were available and the most significantly down-regulated hub protein was SMN1 (Supplementary Figure S1).
DEGs between primary OS and metastatic OS
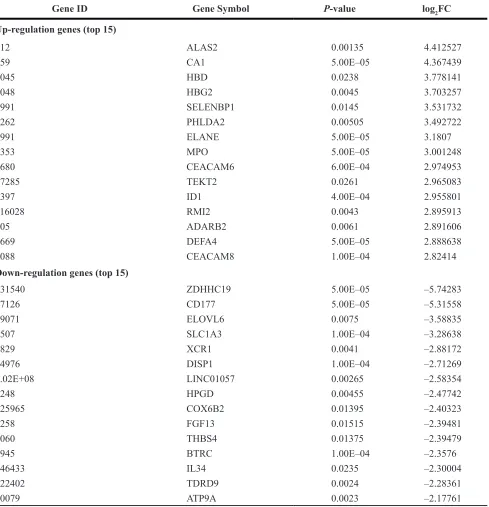
RNA-seq was also used to obtain mRNA expression data of the 5 metastatic OS patients. In total, 235 significant DEGs were identified in metastatic OS compared with primary OS, which consisted of 109 up- and 126 down-regulated genes. ALAS2 was the most significantly up-regulated gene and ZDHHC19 was the most significant down-regulated gene. The top 15 genes exhibiting significant up- and down-regulation are listed in Table 3. The full list of DEGs is shown in Supplementary Table S4.
Functional analysis of DEGs between primary OS and metastatic OS
response (GO: 0006955) were the most enriched biological processes. Cytoplasm (GO: 0005737), plasma membrane (GO: 0005886), and membrane (GO: 0016020) were the most enriched cellular components. Protein binding (GO: 0005515), metal ion binding (GO: 0046872) and receptor activity (GO: 0004872) were the most enriched molecular functions. These data are shown in Supplementary Table S5. We performed the KEGG pathway enrichment analysis for DEGs with a threshold FDR value < 0.05. Pathways with the greatest enrichment were arachidonic acid metabolism (hsa00590), malaria (hsa05144) and chemokine signaling pathway (hsa04062), as Supplementary Table S6 shows.
PPI networks of DEGs between primary OS and metastatic OS
PPI networks of the top 50 up-regulated and top 50 down-regulated DEGs between primary OS and metastatic OS were constructed by Cytoscape. In the up-regulated DEGs network, 617 nodes and 629 edges were available and the most significantly up-regulated hub protein was ISG15 (Figure 2). In the down-regulated DEGs network, 505 nodes and 511 edges were available and the most significantly down-regulated hub protein was BTRC (Supplementary Figure S2).
Verification of the expression level of DEGs between primary OS and healthy control
To verify the RNA-seq analysis data, the expression levels of DEGs of 14 normal tissues and 19 OS samples without metastasis (named as primary group) were
quantified by qRT-PCR. As Figure 3A, 3B and 3C shown, AURKB, CD177 and ZDHHC19 were significantly up-regulated in primary OS compared with normal controls (P < 0.05). In Figure 3D, 3F and 3G, PPP2R2B, CEACAM8 and SMN1 were significantly down-regulated in primary OS compared with normal controls (P < 0.05). The expression level of CMKT2 had no significant difference between primary OS and normal controls but showed a tendency for down-regulation in primary OS. The qRT-PCR results between primary OS and healthy controls verified our RNA-seq data.
Verification of the expression level of DEGs between primary OS and metastatic OS
The expression levels of DEGs between 19 tumor samples of primary OS and 19 tumor samples of metastatic OS were verified by qRT-PCR. As shown in Figure 4A, the expression level of ALAS2 had no significant difference between metastatic OS and primary OS but showed a tendency for up-regulation in metastatic OS. In Figure 4B and 4C, ISG15 and PPP2R2B were significantly up-regulated in metastatic OS compared with primary OS (P < 0.05). In Figure 4D, 4E and 4F, BTRC, CD177 and ZDHHC19 were significantly down-regulated in metastatic OS compared with primary OS (P < 0.05). The qRT-PCR results between primary OS and metastatic OS verified our RNA-seq data.
DISCUSSION
[image:3.612.66.555.62.301.2]AURKB is overexpressed in OS tissues and cells and functions as an oncogene in OS cells [11]. Up-regulation
Table 1: Transcriptome sequencing of subjects
Sample_ID Total_Reads Total_Bases Error%
M1 16968330 2562217830 0.0164
M2 16945590 2558784090 0.0147
M3 18392754 2777305854 0.0149
M4 27963602 4222503902 0.0200
M5 31299610 4726241110 0.0150
P1 27065992 4086964792 0.0155
P2 14319834 2162294934 0.0169
P3 24920680 3763022680 0.0187
P4 15312548 2312194748 0.0154
P5 28589860 4317068860 0.0149
HC 14359676 2020949388 0.0131
of AURKB in Epstein-Barr virus- (EBV)-transformed lymphoblasts is correlated with EBV immortalization and tumorigenic ability in vitro [12]. A number of studies discover that high expression of AURKB is associated with unfavorable prognosis of cancers such as acute myeloid leukemia, nasopharyngeal carcinoma, colorectal adenocarcinoma and gastric cancer [13–16]. Suppression of AURKB down-regulates phosphorylation of VCP and activates the NF-κB signaling pathway in OS cells, resulting in inhibition of cell proliferation, migration and invasion [17]. In addition, inhibition of Aurora-B suppresses the migratory and invasive abilities of OS
cells through modulating the PI3K/Akt/NF-κB signaling pathway in vitro [18, 19].
[image:4.612.70.560.64.558.2]Protein phosphatase 2 is a member of four major Ser/Thr phosphatases and functions as negative control of cell growth and division [20]. In nasopharyngeal carcinoma, reduced PPP2R2B expression activates PDK1/MYC pathways to induce BEZ235 resistance [21]. In breast cancer patients, a variant of the rs319217 SNP in PPP2R2B is associated with a better response to chemotherapy treatment and lower risk of breast cancer recurrence [22]. In addition, up-regulated PPP2RPR is involved in the promotion of T-cell apoptosis triggered
Table 2: The DEGs in primary osteosarcoma compared to the normal control
Gene ID Gene Symbol P-value log2FC
Up-regulation genes (top 15)
57126 CD177 0.00365 7.28443
131540 ZDHHC19 0.0185 6.988027
10926 DBF4 0.0307 5.21743
387755 INSC 0.02145 4.575003
101928079 LINC01057 0.0209 3.910375
56729 RETN 0.04225 3.466679
6507 SLC1A3 0.0346 3.424351
1958 EGR1 0.00105 3.334501
202051 SPATA24 0.0277 3.273086
84418 CYSTM1 0.0357 3.258481
4651 MYO10 0.0489 3.058558
79623 GALNT14 0.0489 3.024365
6129 RPL7 0.00315 2.909688
50486 G0S2 0.0291 2.894525
3622 ING2 0.04375 2.81313
Down-regulation genes (top 15)
1160 CKMT2 0.01115 −4.28207
1088 CEACAM8 0.01075 −3.24111
10964 IFI44L 0.00465 −3.14574
140462 ASB9 0.0327 −2.73412
91543 RSAD2 0.0133 −2.60049
653519 GPR89A 0.0213 −2.5051
55183 RIF1 0.04975 −2.49066
7813 EVI5 0.02925 −2.41565
84725 PLEKHA8 0.02415 −2.39095
4057 LTF 0.0033 −2.30934
79828 METTL8 0.02985 −2.28365
79750 ZNF385D 0.02565 −2.19376
653464 SRGAP2C 0.0349 −2.10654
643699 GOLGA8N 0.04365 −2.10211
23230 VPS13A 0.0419 −2.07423
by IL-2 deficiency in systemic lupus erythematosus, an autoimmune disease [23]. The biological function of PPP2R2B in OS is unknown and further work is needed to elucidate it.
The expression of ISG15 has been implicated in the induction of type I IFN expression and the activation of NK cells, which are important mediators of tumor immunity [24]. Over-expression of ISG15 is involved in tumorigenesis and metastasis of various cancers, such as hepatocellular carcinoma, ovarian serous carcinoma, and breast cancer [25–27]. The high expression level of ISG15
[image:5.612.67.556.65.572.2]has a significant correlation with unfavorable prognosis in esophageal squamous cell cancers and breast cancer [25, 28]. ISG15 is highly expressed in hepatocellular carcinoma (HCC) tumor specimens and triggers tumorigenesis and metastasis of HCC [26]. Knocking down ISG15 inhibits HCC cell proliferation and migration, arrests the cell cycle at the G2/M phase in vitro, and inhibits tumor growth in vivo [26]. Moreover, ISG15 suppresses RANKL-induced osteoclastogenic differentiation of murine RAW264 cells [29]. This is the first study to report that ISG15 is dysregulated in OS; however, the biological
Table 3: The DEGs between primary osteosarcoma and metastatic osteosarcoma
Gene ID Gene Symbol P-value log2FC
Up-regulation genes (top 15)
212 ALAS2 0.00135 4.412527
759 CA1 5.00E–05 4.367439
3045 HBD 0.0238 3.778141
3048 HBG2 0.0045 3.703257
8991 SELENBP1 0.0145 3.531732
7262 PHLDA2 0.00505 3.492722
1991 ELANE 5.00E–05 3.1807
4353 MPO 5.00E–05 3.001248
4680 CEACAM6 6.00E–04 2.974953
27285 TEKT2 0.0261 2.965083
3397 ID1 4.00E–04 2.955801
116028 RMI2 0.0043 2.895913
105 ADARB2 0.0061 2.891606
1669 DEFA4 5.00E–05 2.888638
1088 CEACAM8 1.00E–04 2.82414
Down-regulation genes (top 15)
131540 ZDHHC19 5.00E–05 –5.74283
57126 CD177 5.00E–05 –5.31558
79071 ELOVL6 0.0075 –3.58835
6507 SLC1A3 1.00E–04 –3.28638
2829 XCR1 0.0041 –2.88172
84976 DISP1 1.00E–04 –2.71269
1.02E+08 LINC01057 0.00265 –2.58354
3248 HPGD 0.00455 –2.47742
125965 COX6B2 0.01395 –2.40323
2258 FGF13 0.01515 –2.39481
7060 THBS4 0.01375 –2.39479
8945 BTRC 1.00E–04 –2.3576
146433 IL34 0.0235 –2.30004
122402 TDRD9 0.0024 –2.28361
10079 ATP9A 0.0023 –2.17761
function of ISG15 in OS is still unclear and needs to be further elucidated through in vivo and in vitro studies.
BTRC targets NFKBIA (nuclear factor of kappa light polypeptide gene enhancer in B-cells inhibitor, alpha) for degradation and activates nuclear factor kappa-B, which is involved in innate immunity. Suppressed BTRC/ FBXW11 markedly reduces IL-17 induced degradation of ACT1, which contributes to persistent immune
response in inflammatory diseases [30]. Down-regulated BTRC is associated with poor prognosis in patients with nasopharyngeal carcinoma (NPC) [31]. EBV-miR-BART10-3p negatively targets BTRC to promote cell invasion and cell migration and to facilitate the epithelial-mesenchymal transition of NPC [31].
[image:6.612.157.459.158.408.2]Arachidonic acid metabolism, malaria, and chemokine signaling pathways showed the highest
Figure 1: The constructed PPI network of up-regulated DEGs between primary OS and normal control. The red nodes
represent up-regulated DEGs and the blue nodes denote gene products predicted to interact with the DEGs.
Figure 2: The constructed PPI network of the top 50 up-regulated DEGs between metastatic OS and primary OS. The
[image:6.612.169.445.469.691.2]Figure 3: The expression levels of DEGs between primary OS and healthy controls were verified by qRT-PCR.
(A): AURKB; (B): CD177; (C): ZDHHC19; (D): PPP2R2B; (E): CKMT2; (F): CEACAM8; (G): SMN1. NC represents tissues of normal control and OS represents osteosarcoma. At least three independent experiments were performed for statistical evaluation.
Figure 4: The expression levels of DEGs between primary OS and metastatic OS were verified by qRT-PCR.
[image:7.612.101.517.48.294.2] [image:7.612.124.493.356.687.2]enrichment of DEG in metastatic OS compared to primary OS. Arachidonic acid metabolism, a key inflammatory pathway, generates peroxides, free organic radicals, and aldehydes that promote tumorigenesis in diverse cancers, such as pancreatic cancer, prostate cancer, and head and neck cancer [32–34]. Cyclooxygenase-2 (COX-2) and 5-lipoxygenase (5-LOX) form eicosanoids, which are the substrates for arachidonic acid metabolism. When COX-2 and 5-LOX are blocked, cancer cell proliferation is abrogated in non-small cell lung cancer [35]. Both COX-2 and 5-LOX are up-regulated in pancreatic cancer cell lines at the mRNA and protein levels [32]. Somatic mutations in arachidonic acid metabolism pathway genes, such as PLA2G3, PTGIS and GGT7, prolong post-treatment disease-free survival of patients with oral cancer [33]. It is reported that the change of chemokine signaling pathway is implicated in diverse cancers such as breast, lung, and colorectal cancer [36–38]. XCR1, enriched in chemokine signaling pathway, was significantly down-regulated in primary OS compared with metastasis OS (Table 3). XCR1 enhances cell growth and migration and is involved in bone metastasis in non-small cell lung cancer [39]. Based on the aforementioned information, abnormally expressed mRNAs might play vital roles in OS tumorigenesis through regulating enriched KEGG pathways.
In conclusion, we identified 111 DEGs and 235 DEGs between primary OS and normal controls and between metastatic OS and primary OS, respectively. The potential functions of dysregulated genes in primary OS and metastasis OS were predicted through GO and KEGG enrichment. The expression levels of dysregulated candidate genes were detected in OS tissues through qRT-PCR. There are limitations in our study. The biological functions of key DEGs, including AURKB, CD177, ZDHHC19, PPP2R2B, ISG15, and BTRC, in the pathophysiology of OS is unclear and might be explored through in vitro and in vivo experiments in future work. Our findings might provide a foundation for the further elucidation of tumorigenic and metastatic mechanisms of OS.
MATERIALS AND METHODS
Sample isolation and characterization
Twenty subjects were enrolled into our study from the Third Affiliated Hospital of Kunming Medical University, which consisted of 5 subjects with primary OS (without metastasis), 5 subjects with metastatic OS and 10 healthy controls. The human subject study was approved by the Third Affiliated Hospital of Kunming Medical University and informed written consent was obtained from all patients. 10 ml peripheral blood was obtained from each of the subjects, peripheral blood mononuclear cells (PBMCs) were isolated and total RNA was extracted
using TRIzol reagent (Invitrogen, Carlsbad, CA, USA) according to the manufacturer’s instructions.
Library preparation and RNA-seq
The Illumina Truseq RNA sample Prep Kit (Illumina, Inc., San Diego, CA, USA) was used for cDNA library preparation of PBMC samples according to the manufacturer’s protocol. PolyA mRNA was extracted from the total mRNA sample and purified with polyT oligo-conjugated magnetic beads, followed by mRNA fragmentation. First-strand cDNA were transcribed using random primers, followed by second strand cDNA synthesis and end repair. The product was ligated to Illumina Truseq adaptors. After PCR amplification, the enriched cDNA libraries were sequenced using Illumina HiSeq 2500 (Illumina, Inc., San Diego, CA, USA).
Primary analysis
Libraries from samples were developed using high-throughput RNA-sequencing. The raw image data were translated into raw FASTQ sequence data by Base Calling. Raw RNA-Seq data were filtered using FASTxtool SeqPrep (https://github.com/jstjohn/SeqPrep) and Sickle (https://github.com/najoshi/sickle)
according to the following 3 criteria: firstly, only reads containing sequencing adaptors were used; secondly, nucleotides with a quality score < 20 were trimmed from the end of the sequence; and thirdly, reads with N rate > 10% were removed.
Reads mapping
Clean and trimmed reads were aligned with the UCSC human reference genome (hg19) using TopHat v1.3.1 [40]. TopHat allows a maximum of two mismatches when mapping the reads to the reference genome. Aligned read files were then processed by Cufflinks v1.2.1 [41], which measures the relative expression of the genes with the normalized RNA-Seq fragment counts.
Analysis of differential expression of genes fragments per kilobase of exon per million mapped reads (FPKM) was used to determine the transcription abundance of each gene. The reference GTF annotation file used in Cufflinks was downloaded from the Ensembl database (Homo_sapiens.GRCh37.63.gtf) [42]. The expression testing was performed using paired t-tests. After applying Benjamini-Hochberg correction for multiple tests, the P-value < 0.05 and abs(log2fold change > 1) was selected as the criteria for significant differential expression.
Functional annotation of differentially expressed genes
analyses were used to predict the biological function of differentially expressed genes [43, 44]. FDR < 0.05 was set as the cut-off for selecting significantly enriched functional GO terms and KEGG pathway enrichment.
Network construction of protein-protein interaction
BioGRID, a database of predicted protein interactions [45], was used to screen interacting protein pairs based on differentially expressed genes. PPI networks of up- and down-regulated differentially expressed genes were visualized using Cytoscape software (http://cytoscape.org/) [46]. In the networks, nodes represent proteins and edges represent interactions between two proteins.
Quantitative real-time polymerase chain reaction (qRT-PCR)
Total RNA of 14 OS samples of normal tissues, 19 OS samples without metastasis and 19
OS samples with lymph node or distant metastasis were extracted using TRIzol reagent (Invitrogen, Carlsbad,CA, USA) according to the manufacturer’s instructions. The ReverTra Ace qPCR RT Master Mix Kit (TOYOBO, Shanghai, China) was used to synthesize
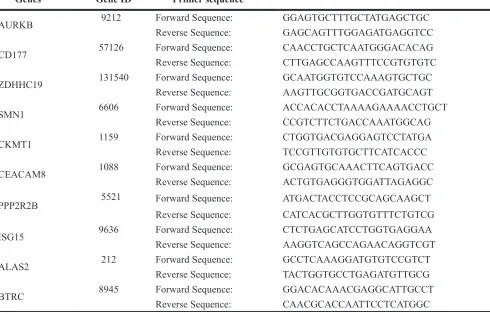
the cDNA. qRT-PCR reactions were performed using SYBR® FAST qPCR Kits (KAPA bio, Boston, MA, USA) on the LightCycler 480 (Roche Indianapolis, IN, USA). GAPDH was used as internal control for mRNA detection. The relative expression of target genes was calculated using the 2-ΔΔCT equation [47]. The PCR primers used
are shown in Table 4. The GraphPad Prism version 6.0 software package (GraphPad Software, San Diego, CA, USA) was used to output figures. The mean ± standard deviation and independent-samples t-test were used in the statistical analyses. P < 0.05 was considered statistically significant.
ACKNOWLEDGMENTS
[image:9.612.64.554.75.389.2]This research was supported in part by grant (no. 2014FB059) from the Joint Special Funds for the Department of Science and Technology of Yunnan Province-Kunming Medical University, grants (No. 2014NS013, 2014NS014, 2014NS015, 2014NS016) from the 2014 Scientific Research Projects from Internal Research Institutions of Medical and Health Units in Yunnan Province, grants (No. 2016NS093, 2016NS094) from the 2016 Scientific Research Projects from Internal Research Institutions of Medical and Health Units in Yunnan Province, a grant (No. BSJJ201406) from Doctor Scientific Research Startup funds of Tumor Hospital
Table 4: The primer list of genes
Genes Gene ID Primer sequence
AURKB 9212 Forward Sequence: GGAGTGCTTTGCTATGAGCTGC
Reverse Sequence: GAGCAGTTTGGAGATGAGGTCC
CD177 57126 Forward Sequence: CAACCTGCTCAATGGGACACAG
Reverse Sequence: CTTGAGCCAAGTTTCCGTGTGTC
ZDHHC19 131540 Forward Sequence: GCAATGGTGTCCAAAGTGCTGC
Reverse Sequence: AAGTTGCGGTGACCGATGCAGT
SMN1 6606 Forward Sequence: ACCACACCTAAAAGAAAACCTGCT
Reverse Sequence: CCGTCTTCTGACCAAATGGCAG
CKMT1 1159 Forward Sequence: CTGGTGACGAGGAGTCCTATGA
Reverse Sequence: TCCGTTGTGTGCTTCATCACCC
CEACAM8 1088 Forward Sequence: GCGAGTGCAAACTTCAGTGACC
Reverse Sequence: ACTGTGAGGGTGGATTAGAGGC
PPP2R2B 5521 Forward Sequence: ATGACTACCTCCGCAGCAAGCT
Reverse Sequence: CATCACGCTTGGTGTTTCTGTCG
ISG15 9636 Forward Sequence: CTCTGAGCATCCTGGTGAGGAA
Reverse Sequence: AAGGTCAGCCAGAACAGGTCGT
ALAS2 212 Forward Sequence: GCCTCAAAGGATGTGTCCGTCT
Reverse Sequence: TACTGGTGCCTGAGATGTTGCG
BTRC 8945 Forward Sequence: GGACACAAACGAGGCATTGCCT
of Yunnan Province, the Third Affiliated Hospital of Kunming Medical University.
CONFLICTS OF INTEREST
The authors declare that they have no conflicts of interest.
GRANT SUPPORT
None.
REFERENCES
1. Jones KB, Salah Z, Del Mare S, Galasso M, Gaudio E, Nuovo GJ, Lovat F, LeBlanc K, Palatini J, Randall RL, Volinia S, Stein GS, Croce CM, et al. miRNA signatures associate with pathogenesis and progression of osteosarcoma. Cancer Res. 2012; 72:1865–77. doi: 10.1158/0008-5472.CAN-11-2663.
2. Ottaviani G, Jaffe N. The epidemiology of osteosarcoma. Cancer Treat Res. 2009; 152:3–13. doi: 10.1007/978-1-4419-0284-9_1.
3. Yang J, Zhang W. New molecular insights into osteosarcoma targeted therapy. Current opinion in oncology. 2013; 25:398–406. doi:
4. Bielack SS, Kempf-Bielack B, Delling G, Exner GU, Flege S, Helmke K, Kotz R, Salzer-Kuntschik M, Werner M, Winkelmann W, Zoubek A, Jurgens H, Winkler K. Prognostic factors in high-grade osteosarcoma of the extremities or trunk: an analysis of 1,702 patients treated on neoadjuvant cooperative osteosarcoma study group protocols. J Clin Oncol. 2002; 20:776–90. doi: 5. Ta HT, Dass CR, Choong PFM, Dunstan DE. Osteosarcoma
treatment: state of the art. Cancer and Metastasis Reviews. 2009; 28:247–63.
6. Cheng DD, Yu T, Hu T, Yao M, Fan CY, Yang QC. MiR-542-5p is a negative prognostic factor and promotes osteosarcoma tumorigenesis by targeting HUWE1. Oncotarget. 2015; 6:42761–72. doi: 10.18632/oncotarget.6199
7. Zhang Y, Ma Q, Liu T, Guan G, Zhang K, Chen J, JiaN, Yan S, Chen G, Liu S, Jiang K, Lu Y, Wen Y, et al. Interleukin-6 suppression reduces tumour self-seeding by circulating tumour cells in a human osteosarcoma nude mouse model. Oncotarget. 2015; 7:446–58. doi: 10.18632/ oncotarget.6371.
8. Ma X, Sun W, Shen J, Hua Y, Yin F, Sun M, Cai Z. Gelsolin promotes cell growth and invasion through the upregulation of p-AKT and p-P38 pathway in osteosarcoma. Tumor Biology. 2015:1–10.
9. Chen Y, Yang Y, Liu S, Zhu S, Jiang H, Ding J. Association between interleukin 8 -251 A/T and +781 C/T polymorphisms and osteosarcoma risk in Chinese population: a case-control study. Tumour Biol. 2015. doi: 10.1007/s13277-015-4435-6.
10. Cui Y, Zhu JJ, Ma CB, Cui K, Wang F, Ni SH, Zhang ZY. Interleukin 10 gene -1082A/G polymorphism is associated with osteosarcoma risk and poor outcomes in the Chinese population. Tumour Biol. 2015. doi: 10.1007/s13277-015-4238-9.
11. Liu JM, Long XH, Zhang GM, Zhou Y, Chen XY, Huang SH, Liu ZL, Zhang ZH. Let-7g reverses malignant phenotype of osteosarcoma cells by targeting Aurora-B. Int J Clin Exp Pathol. 2014; 7:4596–606.
12. Dai Y, Tang Y, He F, Zhang Y, Cheng A, Gan R, Wu Y. Screening and functional analysis of differentially expressed genes in EBV-transformed lymphoblasts. Virol J. 2012; 9:77. doi: 10.1186/1743-422x-9-77.
13. Huang PY, Li Y, Luo DH, Hou X, Zeng TT, Li MQ, Mai HQ, Zhang L. Expression of Aurora-B and FOXM1 predict poor survival in patients with nasopharyngeal carcinoma. Strahlenther Onkol. 2015; 191:649–55. doi: 10.1007/s00066-015-0840-4.
14. Lucena-Araujo AR, de Oliveira FM, Leite-Cueva SD, dos Santos GA, Falcao RP, Rego EM. High expression of AURKA and AURKB is associated with unfavorable cytogenetic abnormalities and high white blood cell count in patients with acute myeloid leukemia. Leuk Res. 2011; 35:260–4. doi: 10.1016/j.leukres.2010.07.034.
15. Kasap E, Gerceker E, Boyacioglu SO, Yuceyar H, YildirmH, Ayhan S, Korkmaz M. The potential role of the NEK6, AURKA, AURKB, and PAK1 genes in adenomatous colorectal polyps and colorectal adenocarcinoma. Tumour Biol. 2015. doi: 10.1007/s13277-015-4131-6.
16. Enjoji M, Iida S, Sugita H, Ishikawa T, Uetake H, Inokuchi M, Yamada H, Kojima K, Sugihara K. BubR1 and AURKB overexpression are associated with a favorable prognosis in gastric cancer. Mol Med Rep. 2009; 2:589–96. doi: 10.3892/mmr_00000142.
17. He JY, Xi WH, Zhu LB, Long XH, Chen XY, Liu JM, Luo QF, Zhu XP, Liu ZL. Knockdown of Aurora-B alters osteosarcoma cell malignant phenotype via decreasing phosphorylation of VCP and NF-kappaB signaling. Tumour Biol. 2015; 36:3895–902. doi: 10.1007/s13277-014-3032-4. 18. Zhu LB, Jiang J, Zhu XP, Wang TF, Chen XY, Luo QF,
Shu Y, Liu ZL, Huang SH. Knockdown of Aurora-B inhibits osteosarcoma cell invasion and migration via modulating PI3K/Akt/NF-kappaB signaling pathway. Int J Clin Exp Pathol. 2014; 7:3984–91.
19. Zhu XP, Liu ZL, Peng AF, Zhou YF, Long XH, Luo QF, Huang SH, Shu Y. Inhibition of Aurora-B suppresses osteosarcoma cell migration and invasion. Exp Ther Med. 2014; 7:560–4. doi: 10.3892/etm.2014.1491.
20. Sablina AA, Chen W, Arroyo JD, Corral L, Hector M, Bulmer SE, DeCaprio JA, Hahn WC. The tumor suppressor PP2A Abeta regulates the RalA GTPase. Cell. 2007; 129:969–82. doi: 10.1016/j.cell.2007.03.047.
DNA methyltransferase as a novel therapeutic strategy to overcome acquired resistance to dual PI3K/mTOR inhibitors. Oncotarget. 2015; 6:5134–46. doi: 10.18632/ oncotarget.3016.
22. Vazquez A, Kulkarni D, Grochola LF, Bond GL, Barnard N,
Toppmeyer D, Levine AJ, Hirshfield KM. A genetic variant
in a PP2A regulatory subunit encoded by the PPP2R2B gene associates with altered breast cancer risk and recurrence. Int J Cancer. 2011; 128:2335–43. doi: 10.1002/ijc.25582. 23. Crispin JC, Apostolidis SA, Finnell MI, Tsokos GC.
Induction of PP2A Bbeta, a regulator of IL-2
deprivation-induced T-cell apoptosis, is deficient in systemic lupus
erythematosus. Proc Natl Acad Sci USA. 2011; 108:12443– 8. doi: 10.1073/pnas.1103915108.
24. Zuo C, Sheng X, Ma M, Xia M, Ouyang L. ISG15 in the tumorigenesis and treatment of cancer: An emerging role in malignancies of the digestive system. Oncotarget. 2016; 7:74393–09. doi: 10.18632/oncotarget.11911.
25. Bektas N, Noetzel E, Veeck J, Press MF, Kristiansen G, Naami A, Hartmann A, Dimmler A, Beckmann MW, Knuchel R, Fasching PA, Dahl E. The ubiquitin-like molecule interferon-stimulated gene 15 (ISG15) is a potential prognostic marker in human breast cancer. Breast Cancer Res. 2008; 10:R58. doi: 10.1186/bcr2117.
26. Li C, Wang J, Zhang H, Zhu M, Chen F, Hu Y, Liu H, Zhu H. Interferon-stimulated gene 15 (ISG15) is a trigger for tumorigenesis and metastasis of hepatocellular carcinoma. Oncotarget. 2014; 5:8429–41. doi: 10.18632/ oncotarget.2316.
27. Darb-Esfahani S, Sinn BV, Rudl M, Sehouli J, Braicu I, Dietel M, Denkert C. Interferon-stimulated gene, 15 kDa (ISG15) in ovarian high-grade serous carcinoma: prognostic impact and link to NF-kappaB pathway. Int J Gynecol Pathol. 2014; 33:16–22. doi: 10.1097/ PGP.0b013e31827b25a2.
28. Tao J, Hua P, Wen J, Hu Y, Yang H, Xie X. Prognostic value of ISG15 mRNA level in drinkers with esophageal squamous cell cancers. Int J Clin Exp Pathol. 2015; 8:10975–84.
29. Takeuchi T, Shimakawa G, Tamura M, Yokosawa H, ArataY. ISG15 regulates RANKL-induced osteoclastogenic differentiation of RAW264 cells. Biol Pharm Bull. 2015; 38:482–6. doi: 10.1248/bpb.b14-00410.
30. Shi P, Zhu S, Lin Y, Liu Y, Liu Y, Chen Z, Shi Y, Qian Y. Persistent stimulation with interleukin-17 desensitizes cells through SCFbeta-TrCP-mediated degradation of Act1. Sci Signal. 2011; 4:ra73. doi: 10.1126/scisignal.2001653. 31. Yan Q, Zeng Z, Gong Z, Zhang W, Li X, He B, Song Y,
Li Q, Zeng Y, Liao Q, Chen P, Shi L, Fan S, et al. EBV-miR-BART10-3p facilitates epithelial-mesenchymal transition and promotes metastasis of nasopharyngeal carcinoma by targeting BTRC. Oncotarget. 2015; 6:41766–82. doi: 10.18632/oncotarget.6155.
32. Knab LM, Grippo PJ, Bentrem DJ. Involvement of eicosanoids in the pathogenesis of pancreatic cancer: the
roles of cyclooxygenase-2 and 5-lipoxygenase. World J Gastroenterol. 2014; 20:10729–39. doi: 10.3748/wjg.v20. i31.10729.
33. Biswas NK, Das S, Maitra A, Sarin R, Majumder PP. Somatic mutations in arachidonic acid metabolism pathway genes enhance oral cancer post-treatment disease-free survival. Nat Commun. 2014; 5:5835. doi: 10.1038/ ncomms6835.
34. Mitsunari K, Miyata Y, Asai A, Matsuo T, Shida Y, Hakariya T, Sakai H. Human antigen R is positively associated with malignant aggressiveness via upregulation of cell proliferation, migration, and vascular endothelial growth factors and cyclooxygenase-2 in prostate cancer. Transl Res. 2016; 175:116–28. doi: 10.1016/j. trsl.2016.04.002.
35. Chi F, Wu R, Jin X, Jiang M, Zhu X. HER2 induces cell proliferation and invasion of non-small-cell lung cancer by upregulating COX-2 expression via MEK/ERK signaling pathway. Onco Targets Ther. 2016; 9:2709–16. doi: 10.2147/ott.s96197.
36. Huan J, Wang L, Xing L, Qin X, Feng L, Pan X, Zhu L.
Insights into significant pathways and gene interaction
networks underlying breast cancer cell line MCF-7 treated with 17beta-estradiol (E2). Gene. 2014; 533:346–55. doi: 10.1016/j.gene.2013.08.027.
37. Gao W, Liu L, Xu J, Shao Q, Liu Y, Zeng H, Shu Y. A
systematic analysis of predicted MiR-31-targets identifies
a diagnostic and prognostic signature for lung cancer. Biomed Pharmacother. 2014; 68:419–27. doi: 10.1016/j. biopha.2014.03.009.
38. Tian X, Sun D, Zhao S, Xiong H, Fang J. Screening of potential diagnostic markers and therapeutic targets against colorectal cancer. Onco Targets Ther. 2015; 8:1691–9. doi: 10.2147/ott.s81621.
39. Wang T, Han S, Wu Z, Han Z, Yan W, Liu T, Wei H, Song D, Zhou W, Yang X, Xiao J. XCR1 promotes cell growth and migration and is correlated with bone metastasis in non-small cell lung cancer. Biochem Biophys Res Commun. 2015; 464:635–41. doi: 10.1016/j.bbrc.2015.06.175. 40. Trapnell C, Pachter L, Salzberg SL. TopHat: discovering
splice junctions with RNA-Seq. Bioinformatics. 2009; 25: 1105–11. doi: 10.1093/bioinformatics/btp120.
41. Roberts A, Trapnell C, Donaghey J, Rinn JL, Pachter L. Improving RNA-Seq expression estimates by correcting for fragment bias. Genome Biol. 2011; 12:R22. doi: 10.1186/ gb-2011-12-3-r22.
42. Hubbard TJP, Aken BL, Ayling S, Ballester B, Beal K, Bragin E, Brent S, Chen Y, Clapham P, Clarke L. Ensembl 2009. Nucleic acids research. 2009; 37:D690-D7.
43. Kanehisa M. The KEGG database. Novartis Found Symp. 2002; 247:91–101; discussion -3, 19-28, 244-52.
45. Chatr-Aryamontri A, Breitkreutz BJ, Oughtred R, Boucher L, Heinicke S, Chen D, Stark C, Breitkreutz A, Kolas N, O’Donnell L, Reguly T, Nixon J, Ramage L, et al. The BioGRID interaction database: 2015 update. Nucleic Acids Res. 2015; 43:D470–8. doi: 10.1093/nar/gku1204. 46. Shannon P, Markiel A, Ozier O, Baliga NS, Wang JT,
Ramage D, Amin N, Schwikowski B, Ideker T. Cytoscape: a
software environment for integrated models of biomolecular interaction networks. Genome Res. 2003; 13:2498–504. doi: 10.1101/gr.1239303.