http://dx.doi.org/10.4236/ars.2014.33008
Detecting Musk Thistle (
Carduus nutans
)
Infestation Using a Target Recognition
Algorithm
Mustafa Mirik1, Yves Emendack1, Ahmed Attia1, Sriroop Chaudhuri1, Mimi Roy2, Georges F. Backoulou3, Song Cui4
1Texas A & M AgriLife Research and Extension Center, Vernon, USA
2Department of Crop, Soil and Environmental Sciences, Auburn University, Auburn, USA 3Oklahoma State University, 127 Noble Research Center, Stillwater, USA
4Middle Tennessee State University, Murfreesboro, USA Email: [email protected]
Received 14 June 2014; revised 10 July 2014; accepted 18 August 2014
Copyright © 2014 by authors and Scientific Research Publishing Inc.
This work is licensed under the Creative Commons Attribution International License (CC BY).
http://creativecommons.org/licenses/by/4.0/
Abstract
The outbreaks of invasive plant species can cause great ecological and agronomic problems through aggressively competing for environmental resources that could be otherwise utilized by other desirable species. Thus, it is crucial for detecting small infestations before they reach a sig-nificant extent that can cause ecological and economic damages over a large geological area. Re-mote sensing is a proven method for mapping invasion extent and pattern based on geospatial imagery and indicated great repeatability, large coverage area, and lower cost compared with tra-ditional ground-based methods before. We investigated the feasibility and performances of adopt- ing multispectral satellite imagery analyses for mapping infestation of musk thistle (Carduus nu-tans) on native grassland, crop field, and residential areas in early June using spectral angle map-per classifier. Our results showed an overall classification accuracy of 94.5%, indicating great po-tential of using moderate resolution multispectral satellite-based remote sensing techniques for musk thistle detection over a large spatial scale.
Keywords
Accuracy Assessment, Invasive Plant, Weed Management, Weed Infestation, Remote Sensing, Geospatial Data, Nodding Thistle
1. Introduction
(e.g., water, space, light and nutrients), largely due to their aggressive and competitive ability, prolific seed pro-duction and seed longevity [1] [2]. Along with having a competitive advantage in resource utilization over native species, many non-native weeds grow in the absence of natural enemies [1] [2]. This allows non-native invasive weeds to easily establish and compete with native plants in the environment [1]. Due to these characteristics, non- native invasive weeds usually move from small, manageable infestations to larger areas, reaching levels where control is economically prohibitive [3]. Some non-native invasive species could dominate the vegetative canopy and eventually could form monotypic stands [3]. Invasion may alter nutrient accumulation and cycling, hydrol-ogy, carbon sequestration and grass production [4] [5]. Weed infestation has been recognized as a primary reason for loss in global biodiversity and even species extinction [6] [7]. Therefore, non-native invasive plant species have long been of interest to natural resource managers, ecologists and biological conservationists [8].
One non-native weed of major ecological and economic importance in the US, Canada, Australia, New Zealand and southern Africa is musk thistle or nodding thistle (Carduus nutans L.), an aggressive member of the sunflower (Asteraceae) family that is native to North Africa and Eurasia [9]-[14]. Musk thistle infests a considerable amount of land area in the US (found in 45 states) and Canada (found at least in five provinces) and has a long history in these countries as an invasive species [12] [13]. Musk thistle has been declared a noxious weed in many US states, Canadian provinces and Australia. It infests forest, pasture and rangelands, roadsides, railroad rights-of-way, ditch banks, stream beds, waste or disturbed areas, agricultural fields [9] [10], as well as residential areas. The presence of this weed can impede grazing by livestock and decreases the forage production due to competition with grasses
[9] [10]. Since livestock do not graze musk thistle, it easily outcompetes grassland forage species and can do-minate entire fields with up to 150,000 plants per hectare [14] [15]. It has been determined that a single musk thistle per 1.5-m2 reduces pasture yields by 23% [16]. It has been also reported that musk thistle reduced 72% of the amount of forage utilized in beef-cattle and sheep-grazed pastures [17].
Early determination of the distribution and severity of rapidly spreading invasive populations of musk thistle is needed to implement mitigation treatments, but accurate assessments are often difficult or impossible to obtain with ground surveys, because of the extensive land area involved, time and labor required and inaccessibility of many areas [18]. Therefore, remote sensing has received considerable attention as a rapid, inexpensive and non- destructive method for assessing non-native noxious species invasions [4] [18]. It is a technology that provides a complete assessment instead of an assumed level based on traditional field-based sub-sampling methods.
A wide range of sensor systems, including aerial photographs, airborne and satellite multispectral and hyper-spectral images have been successfully utilized for mapping the distribution of certain plant species [19]-[22]. An important characteristic of remotely sensed imagery for mapping plant species is the spatial resolution or pixel size representing the smallest area identifiable in the imagery. Higher spatial resolution imagery often contains detailed intraspecies spectral variability than lower resolution imagery, when target species occur in small patches or cover smaller areas than the pixel size [19] [23] [24]. Timing, location, species composition, spectral and spatial resolutions are all important for vegetation mapping at the species level, because spectral reflectance from vegetation is determined by structural and biochemical properties, including leaf area, leaf an-gle distribution, architecture, biochemical and pigment (lignin, cellulose, chlorophylls, carotenes, nitrogen and water) contents [25] over time and space. Remote detection of invasive plant species using geospatial imagery may substantially improve monitoring, planning, and management practices by overcoming some of the short-comings of ground-based surveys such as observer bias and inaccessibility to certain locations. Remote sensing techniques for accurate mapping of invasion offer a unique set of advantages including repeatability, large area coverage and cost-effectiveness over ground-based methods over time and space [26]-[28].
from an image [30] [31].
Sub-pixel information extraction methods, such as SAM, are among the most useful supervised target detec-tion algorithms. Six land cover classes were assessed with an overall accuracy of 70% using SAM algorithm
[32]. Burn areas in forestland were mapped with an overall accuracy of 84% using SAM classifier [33]. SAM method was able to distinguish spotted knapweed (Centaurea maculosa) cover as little as 1% to 40% [34].
Hoary crest (Cardariadraba) was discriminated with an overall accuracy of 65% using SAM [35]. SAM was used to detect the distribution of five invasive plant species saltcedar (Tamarix spp.), Russian olive ( Elaeagnu-sangustifolia), Canada thistle (Cirsium arvense), musk thistle, and reed canary grass (Phlarisarundinacea) with an overall accuracy of >74% [22].
Despite the use of remotely sensed data for identification and mapping of non-native invasive plants and the large distribution of musk thistle in the US and other countries, the application of moderate resolution (e.g., 30-m) publicly available multispectral imagery for mapping musk thistle on grassland, rangelands, cropland, and resi-dential areas is not well studied. Utilizing moderate resolution publicly available multispectral imagery to dis-criminate and separate invasive musk thistle from highly variable vegetation comprised of many species of grasses, broadleaved forbs, and crops is needed in order to improve monitoring population dynamics and devel-oping long-term adaptive management practices for musk thistle. Typically, in the southern Great Plains (in Texas and Oklahoma, USA), the diversity of plant species at any one site includes species with cool-season (C3) or
warm-season (C4) photosynthetic pathways that usually have very different periods of physiological activity
during the growing season and would have markedly different spectral properties at any one point in time. Our objective was to evaluate the use of moderate resolution publicly available multispectral imagery and SAM sub-pixel classification method for detecting and discriminating musk thistle from the co-occurring vegetation in a rangeland, cropland, and residential setting. Since the multispectral remote detection of musk thistle has not been well documented, our study presents the first application of moderate resolution publicly available multispectral data for discriminating musk thistle using SAM. The reason why this classifier has potential is because it can distinguish and map single target objects rather than all objects present in the images.
2. Materials and Methods
2.1. Site Description
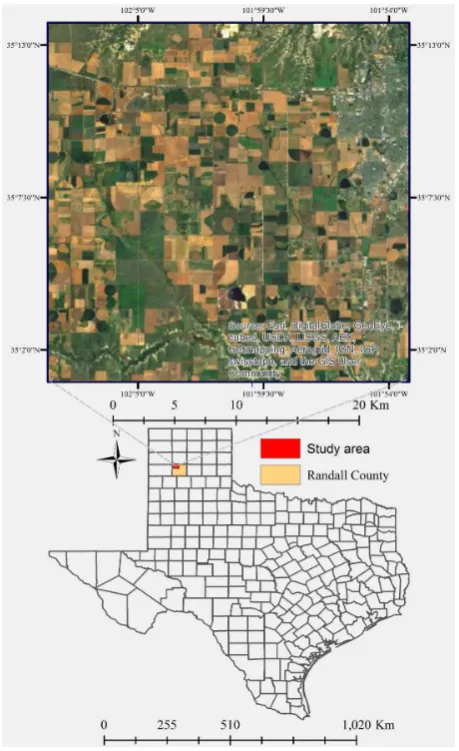
Musk thistle infestations were observed on areas located in southwest of City of Amarillo and in northwest of City of Canyon in Randall County, Texas High Plains, USA (Figure 1) during the mid-spring in 2007.
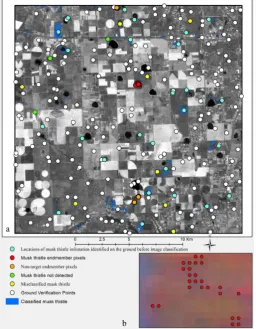
A ground survey was conducted to locate infested areas by musk thistle and record coordinates using a hand-held field computer equipped with the Farm Works software package (CTN Data Service, Hamilton, IN) and a GPS receiver. Heavy infestations of musk thistle at flowering growth stage were found at 36 locations over the study area (Figure 2). A cloud free 7-seven bands Landsat 5 Thematic Mapper (TM) scene with 30-m spatial resolution that were dated June 7, 2007 covered the northwestern Texas High Plains with path 30 and row 36 and scene center latitude 34.27˚ and longitude −102.19˚ were obtained. Images were provided by the United State Geological Service (USGS) via the Center for Space Research, University of Texas at Austin with geometric and radiometric corrections. Image digital numbers were converted to reflectance using Environment for Visualizing Images software package (ENVI: Exelis Visual Information Solutions, Boulder, CO). Image was subset for a 44,796 ha (21 km by 21 km) area that included all locations of musk thistle infestations identified on the ground (Figure 3(a)).
2.2. Imagery Classification
One location with a heavy musk thistle infestation was used to collect endmember spectra from the image for classification. This location was verified using some landmarks (e.g., roads, neighboring fields, field shapes etc.) and overlying the point coordinates over the image. Endmember spectra of musk thistle manually extracted from the imagery, consisted of a total of 25 pixels. Meanwhile, another total of 25 pixels of green vegetation at three locations were selected as non-target spectra to reject in classification.
Figure 1. Study area (top) and its location in Randall County in Texas High Plains (bottom), USA.
Figure 2. View of the musk thistle infestation at three different locations in the study area.
[image:4.595.184.414.83.459.2]Figure 3. Color infrared (a); 3-band composite minimum noise fraction (b); and classified image for musk thistle detection us-ing spectral angle mapper (c).
2.3. Field Validation
Figure 4. Workflow of steps involved in image classification for musk thistle detection using spectral angle mapper.
[image:6.595.171.428.354.684.2]presence (at least more than one musk thistle plants found) and absence (no musk thistle plant found) of musk thistle were recorded.
2.4. Accuracy Assessment
Classification of remotely sensed imagery is the process of assigning variables into discrete categories of useful information. However, errors of classification occur because of mixed pixels, similar spectra of different mate-rials, positional errors and human errors [36]. The most effective way to represent classification accuracy is via an error matrix [37]. Therefore, accuracy assessment for classification was made by constructing an error matrix for classified image. An error matrix is a square, with the number of columns and rows being equal to the numbers of categories whose classification accuracy is being evaluated [37]. Error matrix for classification map was gener-ated by comparing the classified classes with the field validation points. Error matrices to evaluate the classifi-cation accuracy were calculated, including overall, user’s and producer’s accuracies.
There is no single set standard for selection of the image and ground areas for comparison [37] [38]. Because a pixel in an image has an arbitrary location on the ground and because positional errors of maps and global po-sitioning system receivers become significant with small pixel sizes, areas based on geographic information system polygons are used frequently. However, using individual pixels is appropriate if a per-pixel classification is assessed for accuracy, which avoids problems caused by generating “homogeneous” polygons on a landscape
[39]. It has been shown that pixel positional error results in a conservative bias of the accuracy assessment [40]; therefore, the unavoidable positional error introduced into this assessment would result in lower or conservative estimates of mapping accuracy [36].
3. Results and Discussion
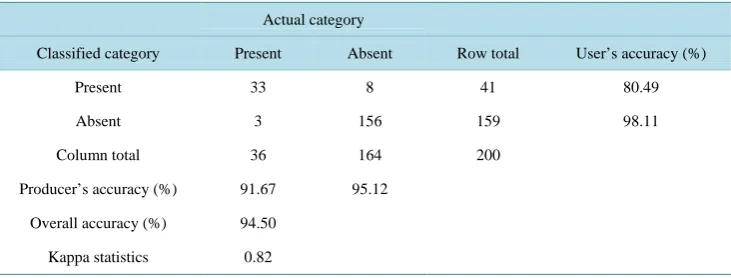
The classification map for musk thistle is illustrated in Figure 3(c) and Figure 5. The error matrix that com-pared ground verification data with classified data is contained in Table 1. An overall mapping accuracy of 95% with a kappa coefficient of 0.82 was achieved for musk thistle detection. About 19% of the other land cover types (a total of eight locations) was included into musk thistle category, whereas about 8% of the musk thistle (a total of three locations) was misclassified as other classes by the classification method performed.
SAM method identified several additional musk thistle infestations that were not located during the ground survey due to the remote areas from the roads. It was noted during the ground-truthing that undetected musk thistle at three locations consisted of yards of two houses and a barnyard building with musk thistle infestation not larger than 30-m in diameter. This indicates that building materials suppressed musk thistle detection. Eight locations where musk thistle undetected were infested by mustard (Brassica spp.) and clover (Trifolium spp. and Melilotus spp.) with light to heavy densities. This indicates that these species had similar reflectance characteristics to musk thistle.
[image:7.595.116.482.580.719.2]There is no set standard for classification accuracy as to what level of accuracy is adequate. The acceptable level of mapping accuracy depends on the project-based choice that differs based on the needs of the end users and utilization of the classification results [36] [37]. An accuracy target of 85% was recommended by [41], and an overall accuracy target of 85% with no individual class accuracy < 70% was suggested by [42]. Although there is
Table 1. Confusion matrix generated from the ground verification and classified data for musk thistle.
Actual category
Classified category Present Absent Row total User’s accuracy (%)
Present 33 8 41 80.49
Absent 3 156 159 98.11
Column total 36 164 200
Producer’s accuracy (%) 91.67 95.12
Overall accuracy (%) 94.50
no information related to the acceptable classification accuracies specified for remote detection of musk thistle, a threshold of the user’s accuracy > 70% is required for mapping leafy spurge [43]. Based on these recommended accuracy guidelines, our classification accuracies (overall, user’s and producer’s accuracies) were above the recommended guidelines. One of the most likely utilizations of these accuracy maps would be to track changes in musk thistle population density over time and space. With consistent and repeatable classification methodology, the level of accuracies we accomplished in this study would present very accurate musk thistle distribution over the study area.
Image classification methods for weed identification and mapping have a tendency to overestimate the target species [44]. In our study, the producer’s accuracy of 88% was slightly lesser than the user’s accuracy of 90% for image classification. Producer’s accuracy is more important than user’s accuracy for weed detection, because undetected or omission of target weeds (false negative) is the factor that most likely hampers control efforts [3] [45]. There is greater potential for misclassification of musk thistle when it grows in close proximity to dense patches of background live vegetation, in locations where musk thistle with canopy coverage is <15% or when individual musk thistle plants are small in size. All of these factors affected classification accuracy in the present study. Our classification results were consistent with the findings of other studies. For example, leafy spurge (Euphorbia esula) with cover as low as 10% [43] and musk thistle with varying densities [3] were successfully detected using hyperspectral images with pixel sizes of 3.5 by 3.5-m and 1 by 1-m, respectively.
With the history of remote sensing, researchers have sought the optimal strategy to extract as much information as possible from remotely sensed data by using the best possible physiological, compositional and structural dis-tinctions in target species, classification algorithm, data transformation and band selection. The accuracy of a classification task could be improved by focusing on most informative bands or spectral regions. Just a few spe-cies-specific spectral bands may be sufficient to detect target species. Since our image classification provided sufficient accuracies to be used for management decisions regarding musk thistle treatment, our study provides an application of moderate resolution multispectral imagery and classification method for discriminating and map-ping musk thistle.
It is more beneficial for the resource manager to have information regarding weed infestations as early as possible. Detecting and mapping of musk thistle on an early spring image before it reaches peak flowering, seed production and dispersal stage could be more favorable to implement treatments when control measures are needed for the current growing season. When control measures are not needed or planned for the current growing season, mapping of musk thistle infestation at the flowering stage is the better option for more accurate mapping and planning for future control measures.
4. Conclusion
Remote sensing techniques offer important opportunities for detecting plant species and mapping the extent of invasions in a timely and spatial manner, especially when the target species have unique characteristics from the co-occurring vegetation mosaic. This study investigated the use of 30-m spatial resolution multispectral imagery and spectral angle mapper target detection method for detecting musk thistle infestation in a rangeland, cropland and residential setting. Given the economic and ecological outcomes of invasion by this weed, our result indi-cates that publicly available Landsat imagery is a useful tool for mapping musk thistle infestation. The accuracy assessment revealed that the overall mapping success was 94.5% with the user’s and producer’s accuracy >80% and >91%, respectively. Our results have implications for rangeland management and productivity. Maps gener-ated at a 30-m scale provide the spatial extent and dynamics of musk thistle infestation over time. These maps can be used for monitoring, planning and control measures. Such maps have also been shown to provide animal distribution, grazing effects and the effects of natural and anthropogenic disturbances in rangeland, cropland, and residential areas. Using maps at a 30-m scale, the reduction in range productivity can be estimated, because a single musk thistle per 1.5-m2 decreases pasture yields by 23%. The use of a 30-m spatial resolution image provided valuable estimates of musk thistle infestation. Therefore, we recommended that this methodology and technology should be considered when moderate scale maps are needed for rangeland research and management.
References
http://dx.doi.org/10.2111/05-106R2.1
[2] Zhang, R., Heberling, J.M., Haner, E. and Shea, K. (2011) Tolerance of Two Invasive Thistles to Repeated Disturbance.
Ecological Research, 26, 575-581. http://dx.doi.org/10.1007/s11284-011-0816-5
[3] Mirik, M., Ansley, R.J., Steddom, K., Jones, D.C., Rush, C.M., Michels Jr., G.J. and Elliott, N.C. (2013) Remote De-tection of a Noxious Weed (Musk Thistle: Carduus nutans) Using Airborne Hyperspectral Imagery and the Support Vector Machine Classifier. Remote Sensing, 5, 612-630. http://dx.doi.org/10.3390/rs5020612
[4] He, K.S., Rocchini, D., Neteler, M. and Nagendra, H. (2011) Benefits of Hyperspectral Remote Sensing for Tracking Plant Invasions. Diversity and Distributions, 17, 381-392. http://dx.doi.org/10.1111/j.1472-4642.2011.00761.x
[5] Mooney, H.A. and Hobbs, R.J. (2000) Invasive Species in a Changing World. Island Press, Washington DC.
[6] Rauschert, E.S.J., Shea, K. and Bjørnstad, O.N. (2012) Coexistence Patterns of Two Invasive Thistle Species, Carduus nutans and C. acanthoides, at Three Spatial Scales. Biological Invasions, 14, 151-164.
http://dx.doi.org/10.1007/s10530-011-9992-z
[7] Somers, B. and Asner, G.P. (2012) Hyperspectral Time Series Analysis of Native and Invasive Species in Hawaiian Rainforests. Remote Sensing, 4, 2510-2529. http://dx.doi.org/10.3390/rs4092510
[8] Frazier, A.E. and Wang, L. (2011) Characterizing Spatial Patterns of Invasive Species Using Sub-Pixel Classifications.
Remote Sensing of Environment, 115, 1997-2007. http://dx.doi.org/10.1016/j.rse.2011.04.002
[9] Milbrath, L.R. and Nechols, J.R. (2004) Individual and Combined Effects of Trichosirocalus horridus and Rhinocyllus conicus (Coleoptera: Curculionidae) on Musk Thistle. Biological Control, 30, 418-429.
http://dx.doi.org/10.1016/j.biocontrol.2003.12.005
[10] Milbrath, L.R. and Nechols, J.R. (2004) Indirect Effect of Early-Season Infestations of Trichosirocalus horridus on
Rhinocyllus conicus (Coleoptera: Curculionidae). Biological Control, 30, 95-109. http://dx.doi.org/10.1016/j.biocontrol.2003.09.017
[11] Skarpaas, O., Silverman, E.J., Jongejans, E. and Shea, K. (2011) Are the Best Dispersers the Best Colonizers? Seed Mass, Dispersal and Establishment in Carduus Thistles. Evolutionary Ecology, 25, 155-169.
http://dx.doi.org/10.1007/s10682-010-9391-4
[12] Wiggins, G.J., Grant, J.F., Lambdin, P.L., Ranney, J.W., Wilkerson, J.B., Reed, A. and Follum, R.A. (2010) Host Uti-lization of Field-Caged Native and Introduced Thistle Species by Rhinocyllus conicus. Environmental Entomology, 39, 1858-1865. http://dx.doi.org/10.1603/EN10053
[13] Wiggins, G.J., Grant, J.F., Lambdin, P.L., Ranney, J.W., Wilkerson, J.B and Van Manen, F.T. (2010) Spatial Predic-tion of Habitat Overlap of Introduced and Native Thistles to Identify Potential Areas of Nontarget Activity of Biologi-cal Control Agents. Environmental Entomology, 39, 1866-1877. http://dx.doi.org/10.1603/EN10112
[14] Zhang, R., Leshak, A. and Shea, K. (2012) Decreased Structural Defence of an Invasive Thistle under Warming. Plant Biology, 14, 249-252.
[15] Kok, L.T. (2001) Classical Biological Control of Nodding and Plumeless Thistles. Biological Control, 21, 206-213. http://dx.doi.org/10.1006/bcon.2001.0940
[16] Roduner, M., Cuperus, G., Mulder, P., Stritzke, J. and Payton, M. (2003) Successful Biological Control of the Musk Thistle in Oklahoma Using the Musk Thistle Head Weevil and the Rosette Weevil. American Entomologist, 49, 112- 120.
[17] Seefeldt, S.S., Stephens, J.M.C., Verkaaik, M.L. and Rahman, A. (2005) Quantifying the Impact of a Weed in a Peren-nial Ryegrass-White Clover Pasture. Weed Science, 53, 113-120. http://dx.doi.org/10.1614/WS-03-163R2
[18] Mirik, M. and Ansley, R.J. (2012) Comparison of Ground-Measured and Image-Classified Honey Mesquite (Prosopis glandulosa) Canopy Cover in Texas. Rangeland Ecology & Management, 65, 85-95.
http://dx.doi.org/10.2111/REM-D-11-00073.1
[19] Asner, G.P., Jones, M.O., Martin, R.E., Knapp, D.E. and Hughes, R.F. (2008) Remote Sensing of Native and Invasive Species in Hawaiian Forests. Remote Sensing of Environment, 112, 1912-1926.
http://dx.doi.org/10.1016/j.rse.2007.02.043
[20] Huang, C. and Asner, G.P. (2009) Applications of Remote Sensing to Alien Invasive Plant Studies. Sensors, 9, 4869- 4889. http://dx.doi.org/10.3390/s90604869
[21] Lass, L.W., Prather, T.S., Glenn, N.F., Weber, K.T., Mundt, J.T. and Pettingill, J. (2005) A Review of Remote Sensing of Invasive Weeds and Example of the Early Detection of Spotted Knapweed (Centaurea maculosa) and Babysbreath (Gypsophila paniculata) with a Hyperspectral Sensor. Weed Science, 53, 242-251.
http://dx.doi.org/10.1614/WS-04-044R2
http://dx.doi.org/10.1614/WT-08-007.1
[23] Ge, S., Xu, M., Anderson, G.L. and Carruthers, R.I. (2007) Estimating Yellow Starthistle (Centaurea solstitialis) Leaf Area Index and Aboveground Biomass with the Use of Hyperspectral Data. Weed Science, 55, 671-678.
http://dx.doi.org/10.1614/WS-06-212.1
[24] Mirik, M. and Ansley, R.J. (2012) Utility of Satellite and Aerial Images for Quantification of Canopy Cover and Infil-ling Rates of the Invasive Woody Species Honey Mesquite (Prosopis glandulosa) on Rangeland. Remote Sensing, 4, 1947-1962. http://dx.doi.org/10.3390/rs4071947
[25] Ustin, S.L., Gitelson, A.A., Jacquemoud, S., Schaepman, M., Asner, G.P., Gamon, J.A. and Zarco-Tejada, P. (2009) Retrieval of Foliar Information about Plant Pigment Systems from High Resolution Spectroscopy. Remote Sensing of Environment, 113, S67-S77.
[26] Gibbes, C., Adhikari, S., Rostant, L., Southworth, J. and Qiu, Y. (2010) Application of Object Based Classification and High Resolution Satellite Imagery for Savanna Ecosystem Analysis. Remote Sensing, 2, 2748-2772.
http://dx.doi.org/10.3390/rs2122748
[27] Jones, D., Pike, S., Thomas, M. and Murphy, D. (2011) Object-Based Image Analysis for Detection of Japanese Knot-weed s.l. Taxa (Polygonaceae) in Wales (UK). Remote Sensing, 3, 319-342. http://dx.doi.org/10.3390/rs3020319 [28] Melendez-Pastor, I., Navarro-Pedreño, J., Koch, M., Gómez, I. and Hernández, E.I. (2010) Land-Cover Phenologies
and Their Relation to Climatic Variables in an Anthropogenically Impacted Mediterranean Coastal Area. Remote Sensing, 2, 697-716. http://dx.doi.org/10.3390/rs2030697
[29] Lu, D. and Weng, Q. (2007) A Survey of Image Classification Methods and Techniques for Improving Classification Performance. International Journal of Remote Sensing, 28, 823-870. http://dx.doi.org/10.1080/01431160600746456 [30] Somers, B., Asner, G.P., Tits, L. and Coppin, P. (2011) Endmember Variability in Spectral Mixture Analysis: A
Re-view. Remote Sensing of Environment, 115, 1603-1616. http://dx.doi.org/10.1016/j.rse.2011.03.003
[31] Kruse, F.A., Lefkoff, A.B., Boardman, J.W., Heidebrecht, K.B., Shapiro, A.T., Barloon, J. and Goetz, A.F.H. (1993) The Spectral Image Processing System (SIPS)—Interactive Visualization and Analysis of Imaging Spectrometer Data.
Remote Sensing of Environment, 44, 145-163. http://dx.doi.org/10.1016/0034-4257(93)90013-N
[32] Kumar, U. and Ramachandra, V. (2008) Endmembers Discrimination in MODIS Using Spectral Angle Mapper and Maximum Likelihood Algorithms. Internatioanl Journal of Applied Remote Sensing, 2, 1-14.
[33] Petropoulos, G.P., Vadrevu, K.P., Xanthopoulos, G., Karantounias, G. and Scholze, M. (2010) A Comparison of Spec-tral Angle Mapper and Artificial Neural Network Classifiers Combined with Landsat TM Imagery Analysis for Ob-taining Burnt Area Mapping. Sensors, 10, 1967-1985. http://dx.doi.org/10.3390/s100301967
[34] Lass, L.W., Thill, D.C., Shafii, B. and Prather, T.S. (2002) Detecting Spotted Knapweed (Centaurea maculosa) with Hyperspectral Remote Sensing Technology. Weed Technology, 16, 426-432.
http://dx.doi.org/10.1614/0890-037X(2002)016[0426:DSKCMW]2.0.CO;2
[35] Mundt, J.T., Glenn, N.F., Weber, K.T., Prather, T.S., Lass, L.W. and Pettingill, J. (2005) Discrimination of Hoary Cress and Determination of Its Detection Limits via Hyperspectral Image Processing and Accuracy Assessment Tech-niques. Remote Sensing of Environment, 96, 509-517. http://dx.doi.org/10.1016/j.rse.2005.04.004
[36] Parker Williams, A.E. and Hunt Jr., E.R. (2004) Accuracy Assessment for Detection of Leafy Spurge with Hyperspec-tral Imagery. Journal of Range Management, 57, 106-112.
http://dx.doi.org/10.2111/1551-5028(2004)057[0106:AAFDOL]2.0.CO;2
[37] Congalton, R.G. and Green, K. (2009) Assessing the Accuracy of Remotely Sensed Data: Principles and Practices. 2nd Edition, Lewis Publishers, Boca Raton.
[38] Ke, Y. and Quackenbush, L.J. (2011) A Review of Methods for Automatic Individual Tree-Crown Detection and De-lineation from Passive Remote Sensing. International Journal of Remote Sensing, 32, 4725-4747.
http://dx.doi.org/10.1080/01431161.2010.494184
[39] Jensen, J.R. (1996) Introductory Digital Image Processing: A Remote Sensing Perspective. Prentice-Hall, Upper Sad-dle River.
[40] Verbyla, D.L. and Hammond, T.O. (1995) Conservative Bias in Classification Accuracy Assessment Due to Pixel- by-Pixel Comparison of Classified Images with Reference Grids. International Journal of Remote Sensing, 16, 581- 587. http://dx.doi.org/10.1080/01431169508954424
[41] Foody, G.M. (2002) Status of Land Cover Classification Accuracy Assessment. Remote Sensing of Environment, 80, 185-201. http://dx.doi.org/10.1016/S0034-4257(01)00295-4
[43] Glenn, N.F., Mundt, J.T., Weber, K.T., Prather, T.S., Lass, L.W. and Pettingill, J. (2005) Hyperspectral Data Proces- sing for Repeat Detection of Small Infestations of Leafy Spurge. Remote Sensing of Environment, 95, 399-412. http://dx.doi.org/10.1016/j.rse.2005.01.003
[44] Lawrence, R.L., Wood, S.D. and Sheley, R.L. (2006) Mapping Invasive Plants Using Hyperspectral Imagery and Breiman Cutler Classifications (Random Forest). Remote Sensing of Environment, 100, 356-362.
http://dx.doi.org/10.1016/j.rse.2005.10.014