Munich Personal RePEc Archive
Second generation governance indicators
Knack, Stephen and Kugler, Mark and Manning, Nick
World Bank
2002
Online at
https://mpra.ub.uni-muenchen.de/25029/
DRAFT DOCUMENT (01-29-02)
Second Generation Governance Indicators
Stephen Knack, Mark Kugler and Nick ManningAbstract:
This paper summarizes progress made in a DfID-funded World Bank initiative to test and develop policy-relevant, politically acceptable, quantitative indicators of governance. There are two major components involved in the process of generating indicators that are practical means of reform. Political acceptability is key in developing neutral
quantitative benchmarks of good governance that can be embraced by reformers. In addition to political acceptability, measuring governance must be comprehensive and institutionally specific so that reformers know which institutions to reform and how to do so. This paper explores some of the most promising second generation indicators of good governance and elaborates on how they are being used in World Bank operations.
Acknowledgments
This paper summarizes some modest but significant progress within a project that seeks to lower the temperature on a key question in governance: ‗how can it be measured in a way that promotes constructive change?‘
Important work at the World Bank and other institutions in the first generation of governance indicators helped to draw attention to the importance of governance.
Assessments of these indicators are shown in initial research to be associated with a wide variety of development outcomes (Ades and DiTella 1996; Chong and Calderon 1999; Hall and Jones 1999; Johnson, Kaufmann, and Zoido-Lobaton 1998; Kaufmann, Mehrez, and Schmukler 1999; Knack and Keefer 1997; Mauro 1995; Rodrik 1997; Tanzi and Davoodi 1997; Wei 1997). With the help of the Department for International Development, United Kingdom (DfID), the World Bank started work in the Fall of 2000 on the development of institutionally specific and transparently generated governance and corruption indicators.
The work has been undertaken in collaboration with the Development Assistance
Committee (DAC) of the OECD. The DAC has been working to establish indicators that measure movement towards the meeting of major UN conference goals since the early 1990s. In "Shaping the 21st Century: The Contribution to Development Cooperation" (OECD 1996) the DAC confirmed the goals and set out the areas of democratic governance that it saw as essential for achieving these goals. These areas are good governance (including public sector management, rule of law, corruption and military expenditure); human rights; democratization and participatory development. In 1996, the DAC ad hoc working group reported that it had failed to forge a consensus around some core indicators for these issues.
Demand for measurements of progress increased significantly, particularly from the development agencies, and a DAC proposal to a joint OECD/UN/World Bank meeting on Agreed Indicators of Development Progress in February 1998 re-launched the process. However, at the Joint UN/OECD/World Bank/IMF International Development Forum hosted by OECD/DAC in March 2000, there was again a consensus that there was not yet a meaningful set of indicators of participatory democracy and good governance that was politically acceptable to governments. Nevertheless, there was strong sentiment that disciplined work on identifying meaningful and acceptable indicators should continue, as it was recognized that the alternative was the increasing use (at least outside DAC) of indicators that were non-transparent and/or unacceptable to governments.
Table 1: Measuring Development Progress: A Working Set of Core Outcomes
M
MiilllleennnniiuummDDeevveellooppmmeennttGGooaallss((MMDDGGss))
GOALS AND TARGETS INDICATORS
GOAL 1: ERADICATE EXTREME POVERTY AND HUNGER Target 1: Halve, between 1990 and 2015, the
proportion of people whose income is less than one dollar a day
1. Proportion of population below $1 per day
2. Poverty gap ratio [incidence x depth of poverty]
3. Share of poorest quintile in national consumption
Target 2: Halve, between 1990 and 2015, the proportion of people who suffer from hunger
4. Prevalence of underweight children (under-five years of age)
5. Proportion of population below minimum level of dietary energy consumption
GOAL 2: ACHIEVE UNIVERSAL PRIMARY EDUCATION Target 3: Ensure that, by 2015, children everywhere,
boys and girls alike, will be able to complete a full course of primary schooling
6. Net enrolment ratio in primary education
7. Proportion of pupils starting grade 1 who reach grade 5
8. Literacy rate of 15-24 year olds
GOAL 3: PROMOTE GENDER EQUALITY AND EMPOWER WOMEN Target 4: Eliminate gender disparity in primary and
secondary education preferably by 2005 and to all levels of education no later than 2015
9. Ratio of girls to boys in primary, secondary and tertiary education
10. Ratio of literate females to males of 15-24 year olds
11. Share of women in wage employment in the non-agricultural sector
12. Proportion of seats held by women in national parliament
GOAL 4: REDUCE CHILD MORTALITY
Target 5: Reduce by two-thirds, between 1990 and 2015, the under-five mortality rate
13. Under-five mortality rate
14. Infant mortality rate
15. Proportion of 1 year old children immunised against measles
GOAL 5: IMPROVE MATERNAL HEALTH
Target 6: Reduce by three-quarters, between 1990 and 2015, the maternal mortality ratio
16. Maternal mortality ratio
17. Proportion of births attended by skilled health personnel
GOAL 6: COMBAT HIV/AIDS, MALARIA AND OTHER DISEASES Target 7: Have halted by 2015, and begun to reverse,
the spread of HIV/AIDS
18. HIV prevalence among 15-24 year old pregnant women
19. Contraceptive prevalence rate
20. Number of children orphaned by HIV/AIDS
Target 8: Have halted by 2015, and begun to reverse, the incidence of malaria and other major diseases
21. Prevalence and death rates associated with malaria
22. Proportion of population in malaria risk areas using effective malaria prevention and treatment measures
23. Prevalence and death rates associated with tuberculosis
24. Proportion of TB cases detected and cured under DOTS (Directly Observed Treatment Short Course)
GOAL 7: ENSURE ENVIRONMENTAL SUSTAINABILITY Target 9: Integrate the principles of sustainable
development into country policies and programmes and reverse the loss of environmental resources
25. Proportion of land area covered by forest
26. Land area protected to maintain biological diversity
27. GDP per unit of energy use (as proxy for energy efficiency) 28. Carbon dioxide emissions (per capita)
[Plus two figures of global atmospheric pollution: ozone depletion and the accumulation of global warming gases]
Target 10: Halve, by 2015, the proportion of people without sustainable access to safe drinking water
29. Proportion of population with sustainable access to an improved water source
Target 11: By 2020, to have achieved a significant improvement in the lives of at least 100 million slum dwellers
30. Proportion of people with access to improved sanitation
31. Proportion of people with access to secure tenure
[Urban/rural disaggregation of several of the above indicators may be relevant for monitoring improvement in the lives of slum dwellers]
GOAL 8: DEVELOP A GLOBAL PARTNERSHIP FOR DEVELOPMENT* Target 12: Develop further an open, rule-based,
predictable, non-discriminatory trading and financial system
Includes a commitment to good governance, development, and poverty reduction – both nationally and internationally
Some of the indicators listed below will be monitored separately for the Least Developed Countries (LDCs), Africa, landlocked countries and small island developing states.
Official Development Assistance
Target 13: Address the Special Needs of the Least Developed Countries
Includes: tariff and quota free access for LDC exports; enhanced programme of debt relief for HIPC and cancellation of official bilateral debt; and more generous ODA for countries committed to poverty reduction
Target 14: Address the Special Needs of landlocked countries and small island developing states
(through Barbados Programme and 22nd General Assembly provisions)
Target 15: Deal comprehensively with the debt problems of developing countries through national and international measures in order to make debt sustainable in the long term
33. Proportion of ODA to basic social services (basic education, primary health care, nutrition, safe water and sanitation)
34. Proportion of ODA that is untied
35. Proportion of ODA for environment in small island developing states
36. Proportion of ODA for transport sector in land-locked countries
Market Access
37. Proportion of exports (by value and excluding arms) admitted free of duties and quotas
38. Average tariffs and quotas on agricultural products and textiles and clothing
39. Domestic and export agricultural subsidies in OECD countries
40. Proportion of ODA provided to help build trade capacity
Debt Sustainability
41. Proportion of official bilateral HIPC debt cancelled
42. Debt service as a percentage of exports of goods and services
43. Proportion of ODA provided as debt relief
44. Number of countries reaching HIPC decision and completion points
Target 16: In cooperation with developing countries, develop and implement strategies for decent and productive work for youth
45. Unemployment rate of 15-24 year olds
Target 17: In cooperation with pharmaceutical companies, provide access to affordable, essential drugs in developing countries
46. Proportion of population with access to affordable essential drugs on a sustainable basis
Target 18: In cooperation with the private sector, make available the benefits of new technologies, especially information and communications
47. Telephone lines per 1000 people
48. Personal computers per 1000 people
Other Indicators TBD
Source: United Nations
Note that the selection of indicators for Goals 7 and 8 is subject to further refinement.
The intention of this project is to initiate a debate that might lead to consensus on some governance indicators that potentially can be added to the existing UN indicators contained in the Millennium Development Goals.
The Political Acceptability of Governance Indicators
If consensus is key to developing governance indicators that offer traction in institutional change, then careful testing of the water and sensitivity to the often justified concerns of governments is foremost in building that consensus. The project has approached the task of developing political acceptability and professional consensus on some quantitative measures of governance indicators cautiously. The strategy reflects an assumption that some consensus on governance indicators could assist in furthering productive reforms in two ways—creating both demand for and supply of key
institutional reforms. One ex ante way to anticipate and resolve governments' concerns is inherent in the design of the project. To ameliorate political and specificity problems to the extent possible, the second generation governance indicators project has embraced specific criteria that indicators must meet (Box 1). The criteria serve to ensure that indicators are (a) politically acceptable; (b) suitable for rigorous quantitative analyses; and, (c)
operationally relevant. In this manner, the project is one of a set of developments within the World Bank that are, broadly, leading in the same direction.
A second ex ante mechanism for recognizing and addressing political concerns and potential objections is through the use of an open discussion forum consisting of an interactive web-based discourse through the OECD DAC web site. Each indicator posted on the site is accompanied by a discussion of how the indicator is constructed, what it intends to measure, and a preliminary assessment of the extent to which it meets the criteria for second generation governance indicators set out in Box 1. The discussion group consists of a separate discussion for each proposed indicator or set of related indicators, so that specific details related to individual indicators can be addressed. The institutionalized feedback in the form of comments and discussion during the creation of indicators provides the capability to design measures that incorporate suggestions to address specific concerns. By anticipating concerns and objections, it is hoped that consensus can be reached to the extent possible.
Overall, the project has identified significant datasets for 40 of these 87 candidate indicators, and has posted 23 on the DAC website. The data sets consist of anywhere from 29 to 168 countries, but the mean number of countries for the data sets is 80 countries. Initial investigations have been conducted into the associations between the more promising second generation indicators and the OECD DAC Millennium
Development Goals.
Box 1 Four criteria for second generation governance indicators
1. Generated through a transparent process.
Proposed indicators should be replicable through a well documented process. Furthermore, the data should come from sources that are politically acceptable.
2. Available across many countries. Most important
of these countries are developing countries.
Broad country coverage is necessary for testing relationships between indicators and valued outcomes. It is hoped that an institutionalized procedure should either be in place or could reasonably be set up to collect data on the proposed indicator in the future.
3. Of high quality and accurate. Indicators should
be measured in a consistent manner across countries, and values should reflect what the indicator purports to measure.
4. Specific. Indicators should measure either a
Thus far, the project has examined 84 candidate indicators that meet the specified criteria in Box 1. The key stages in the project have been
1. Consultation with institutional specialists 2. Refinement of the methodological approach 3. Internal review
4. Construction of initial data sets
5. Development of an interactive website with the OECD Development Assistance Committee
6. Piloting approach in South East Europe
Governance Defined
The project has taken a commonsensical, but theoretically defensible, view of the dimensions of governance, although thus far the project has focused on the executive. Broadly speaking, indicators either measure constraints on the executive related to accountability, or measure the administrative capabilities of executives. Following Diamond's work, constraints on the executive are from one of four directions: formal horizontal, informal horizontal, inter-governmental vertical, or vertical checks from the electorate. Indicators of administrative capabilities are either process indicators that measure the institutional composition of the executive, e.g., civil service wages relative to private sector wages, or performance indicators of outputs such as budgetary volatility or quality of service delivery. Box 2 summarizes the areas in which the project has looked for promising second generation candidates.
Although the initial focus of the project is on the executive, there are plans to widen the scope of what is meant by governance as a result of discussions held during a workshop at the World Bank to discuss second generation indicators. The workshop discussions flagged several areas in which the current work can be extended, including the possibility of teaming up with partner organizations with broader mandates in the area of
Box 2 Governance Dimensions reviewed for “Second Generation” Governance Indicators
Executive Constraints Formal Horizontal
Accountability to the legislature (e.g., as measured by timeliness and comprehensiveness of audit reports to the legislature, the degree to which the enacted budget was followed, or measures of
―grand‖ corruption/state capture including purchase of legislation)
Accountability to the courts (e.g., percent of the population that has litigated against executive entity (including police) in past 5 years, or percentage of litigants reporting case resolved in a timely manner)
Informal Horizontal Media freedom
Civil service professionalism (e.g., political appointees in the civil service, measures of meritocratic appointments)
Competitive private sector (e.g., concentration of power)
Inter-governmental Vertical
Budgetary autonomy of sub-national government (e.g., share of expenditures, share of revenues, tax share)
Vertical Checks from the Electorate Education and literacy
Breadth of tax base
Executive Capabilities Process
Planning and budget preparation (e.g., fiscal planning, revenue predictability and stability, tax simplicity, budgetary rigidity)
Fiscal weight of public employment (e.g., central government wage bill/GDP)
Budget execution (e.g., cash flow by spending units, average deviation in spending units)
Civil service incentives (e.g., vertical and horizontal compression)
Civil service numbers
Intergovernmental relations (e.g., predictability and transparency of transfers and frequency of rule changes for transfers)
Revenue administration (e.g., mechanisms for taxpayer/third party participation in revenue policy formation)
Performance
For businesses (e.g., budgetary volatility, policy unpredictability, predictable judiciary, economic neutrality of taxation, contract intensive money, business start-up costs, number of independent procedural actions to start a business)
For tax payers (e.g., equity, certainty, compliance costs)
For litigants (e.g., number of independent procedural actions to collect an overdue debt, number of independent procedural actions needed to evict a tenant)
For citizens (e.g., public respect for government employees, public perceptions of corruption in the civil service, percent of population fearful of crime)
For service recipients (e.g., quality of service delivery, frequency of power outages)
There are quite a number of second generation indicators for which data are already available. To provide illustration, we examine the rationale and expectations
The timeliness of audited financial statements is defined as the elapsed time between the end of the financial year and the tabling of externally audited financial statements in the legislature. The rationale for this indicator is that the executive should be held
accountable by the legislature for its fiscal management and underlying policy actions. Timeliness of financial reporting is an important aspect of good financial management practice. Lack of timeliness may reflect either or both delays in preparing the financial statements for audit or delays in auditing the statements. However, there are many other important aspects of audit performance that cannot be reflected in this or any other single measure, but this indicator should provide baseline information about one of the
conditions necessary for effective audits, and the measure can be calculated from information provided by the government.
Contract intensive money is the proportion of the money supply that is not held in the form of currency, i.e. the proportion that is held in bank accounts and as other financial assets. The percentage of contract intensive money indicates in part how much faith investors have in the government's ability and willingness to enforce financial contracts, and to refrain from expropriating financial assets. It is a measure of trust in banks and in the government. Contract intensive money is calculated as one minus the ratio of
currency outside of banks to the sum of money and quasi-money (one minus line 14a divided by the sum of lines 34 and 35 in the IFS). Data used to construct the measure of contract intensive money are regularly updated for countries included in the International Financial Statistics Yearbook. Data are available for almost all countries, over long periods of time.
Reliance on revenue from international trade taxes is widely believed to reflect weak administrative capacity. Economic theory suggests that taxing all transactions at low or moderate levels is more efficient than collecting taxes from only a subset of transactions at high rates. However, collecting income, sales or other taxes on a broad range of transactions requires a certain degree of administrative capability on the part of governments. It is relatively easy for governments to collect tax revenues from cross-border transactions, because they are more easily monitored. International trade taxes revenues reflect other influences in addition to administrative capacity. They can be affected by trade policies. For example, non-tariff barriers can reduce trade tax revenues by reducing imports. Higher tariffs intended to protect domestic producers will tend to reduce trade tax revenues by reducing import volumes, but for given import volumes higher rates will increase revenues. Also, in general the smaller the country, the larger the share of its transactions that will take place across national borders. It is possible to adjust for these influences, for example by calculating the deviation of international trade tax revenues from the value that would be expected based on country size. Data for international trade tax revenues are regularly updated for countries included in the GFS, and data on international trade taxes as a percentage of all central government revenues is available in the World Bank's World Development Indicators.
that some relationships are nonlinear, and that some may be sensitive to a small number of outlying observations.
Second Generation Governance Indicators' Relevance to Development Outcomes
Recently, the relationship between five of the second generation indicators of good governance and the DAC‘s Millennium Development Goals has been empirically analyzed (Kugler 2001). Preliminary analyses, using second generation indicators for which the data are available, have produced some promising results. There are
statistically significant relationships between some candidate indicators and many pro-poor outcomes such as lower infant mortality.
An absence of a relationship sometimes can be equally informative. For example, there is little evidence in the cross-country data to support the belief that raising civil service pay will help to achieve any of the development goals. Of course, this finding does not mean that raising pay is never a good idea; rather, it merely suggests caution in urging it as a one-size-fits-all policy.
Table 2 provides details for indicators where progress has been made with regard to data collection, dissemination, or their relationship to the indicators of the DAC development goals.
Table 2: Second Generation Indicators and Development Outcomes
Association with Development Outcomes
Indicator
# of Countries
Data on Website
Not Associated
Linear Association
Non-linear Association Formal Horizontal
1. Delays in Auditing NA 2. "Grand" Corruption/ State Capture 22
Informal Horizontal
3. Freedom House Civil Liberties Score 188 4. Political Appointees in "Top Levels
of" Civil Service 35 5. Meritocratic Civil Service 35
Inter-Governmental Vertical
6. Sub-national Share of Expenditures 100 7. Sub-national Share of Revenues 101
8. Vertical Imbalance 93 9. Sub-national Expenditures as Share
of GDP 99
10. Sub-national Revenues as Share of
GDP 98
11. Tax Share 94
Vertical Checks from the Electorate
12. Literacy Rate 133
13. Primary School Continuing
Enrolment Rate 131
14. Central Government Wage Bill/GDP 104 15. Central Government Wage
Bill/Government Expenditure 47
16. Civil Service Pay (Vertical
Compression) 30
17. Average Government Wage to Per
Capita GDP 94
18. Average Government Wage to
Manufacturing Wage 51
19. Average Government Wage to
Financial Sector Wage 39
20. Average Government Wage to
Private Sector Wage 29
21. Central Government Excluding Education, Health, and if Available, Policy (% Population)
99
22. Subnational Government Excluding Education, Health, and if Available, Policy (% Population)
78
23. Education Employees (%
Population) 96
24. Health Employees (% Population) 87 25. Police (% Population) 68 26. Armed Forces (% Population) 97 27. SOE Employees (% Population) 44 28. International Trade Taxes as % of
Total Revenue 122
Performance Indicators
29. Budgetary Volatility 118 30. Policy Unpredictability (WDR 97) 66
31. Predictable Judiciary (WDR 97,
q11) 67
32. Crime and Theft as Obstacles to
Conducting Business (Q9) 67
33. Crime and Theft as Obstacles to
Conducting Business (Street) 22 34. Crime and Theft as Obstacles to
Conducting Business (Organized) 22 35. Contract Intensive Money (% of the
Money Supply Held in Bank Accounts and as Other Financial Assets)
152
36. Number of Independent Business
Start-up Procedures 85
37. Number of Independent Legal
Actions to Evict Tenant 105
38. Number of Independent Legal
Actions to Collect Overdue Debt 106
39. Enforcement of Property Rights
(WDR97, q10) 67
40. Respect for Government Employees 57 41. Public Perceptions of Corruption in
the Civil Service 57 42. % of Population Fearful of Crime 60 43. % of Population Expressing
44. Quality of Service Delivered (index
Q22) 67
45. Quality of Service Delivered (Q25) 67 46. Frequency of Power Outages 67 47. Waiting Time for Telephone Line 169
The basic empirical strategy is to test the relevance for development indicators against accepted development outcomes. Future work will extend this analysis, and conduct similar analyses using many more second generation governance indicators, and more indicators of development outcomes. To date, the indicator for budgetary volatility has been tested most comprehensively.
Budgetary Volatility
An important aspect of the quality of government policy is its coherence and
predictability. The budget is a key arena in which government policy issues are played out, resulting in executive spending decisions. To the extent that policy decisions are captured in the budget, then stable policy should be reflected in stable budget allocations. Thus, one objective measure of policy coherence and predictability can be obtained from government expenditures data. In most cases, large year-to-year fluctuations in
expenditure shares would indicate an absence of a coherent and predictable (and hence accountable) government policy. Unpredictable government policy can adversely affect business investment, as well as the behavior of public officials.
Excessive volatility or incoherence undermines government credibility for businesses and other actors, reduces investor confidence and capital inflows, and slows economic
growth. The claim is not that businesses study the budget and its amendments, and alter their investment decisions accordingly. Moreover, large changes at the levels of
aggregation for which expenditure data are available may not necessarily reflect changes at finer levels that actually affect the profitability of businesses. Any impact of budgetary volatility on investment is likely to reflect primarily the effects of unpredictable changes in laws and regulations that affect businesses but do not enter government budgets. The assumption is that unpredictability in budgeting and in rulemaking are likely to be very highly correlated, as they are both the product of governments that face few effective accountability mechanisms. This assumption is strongly supported by the finding that budgetary volatility is strongly correlated with alternative measures of policy
unpredictability, that are based on expert ratings or business surveys. The same countries that ―experts‖ or surveys judge to have volatile policy environments tend to be those with high values of budgetary volatility, even when per capita income is controlled for. The advantage of budgetary volatility over these subjective measures with which it is correlated is that it is an objective measure directly affected by the actions of government, so raises fewer issues of political acceptability.
Unpredictability of policy can influence the decisions of public officials, as well as investors. In circumstances of high budgetary volatility, officials charged with
policy is likely to change. Expectations concerning the future flow of budgetary and other resources are significant determinants of behavior. Officials who doubt that the budget will be implemented as planned may have few reasons to implement policies vigorously and every reason to over-staff, as salaries will ultimately be paid even if program funds are reduced.
Unpredictable policy can worsen poverty in several ways. By deterring investment, it can reduce per capita incomes, relative to more predictable policy environments. Poorer persons attempting to establish small businesses may be particularly harmed, because with few assets other than their labor it is more difficult for them than for wealthy investors to diversify across sectors of the economy – which is otherwise a rational response to unpredictable policies. Finally, the poor are likely to be more dependent on public delivery of services such as health and education. Where policy with respect to services is incoherent, and resources are less predictable, the quality of these services is likely to suffer.
We calculate budgetary volatility as the median of the year to year changes in each of the 14 functional classifications over the preceding 4 years, where budget changes are
defined as the (absolute values of the) difference in expenditure shares (for each
functional classification) from year n to year n+1, calculated as a proportion of the year n figure.
Interpreting the measure requires some cautions. Budgetary volatility carries a negative connotation if we assume that the budget should be a credible signal of government‘s policy intentions and that in consequence radical variations indicate the absence of a coherent set of policy priorities. However, in reality of course volatility may
occasionally reflect shifts from an inefficient to an efficient set of allocations, e.g.
following removal of a corrupt government, or even rational reallocations to meet macro-fiscal objectives. Examination of the most volatile cases in the data, however, does not suggest that in practice this obscures the message that high volatility is undesirable. For example, there appear to be few if any cases where high volatility was produced by large shifts away from military spending toward spending on health, education, and social services. Conceivably, extremely low values for this measure could reflect a budget process that is too rigid and which does not respond to changes in needs and preferences. However, as the lowest values belong to developed countries, such as the US and
Australia, that are generally considered to be quite democratic with sound public
expenditure management practices, it appears that ―excessive consistency‖ of this sort is rarely a problem in practice.
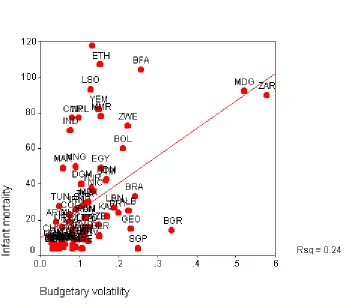
Consistent with the hypothesis that budgetary volatility can make poor people worse off, countries with higher budgetary volatility also tend to have higher rates of infant
Figure 1 Budgetary volatility and infant mortality
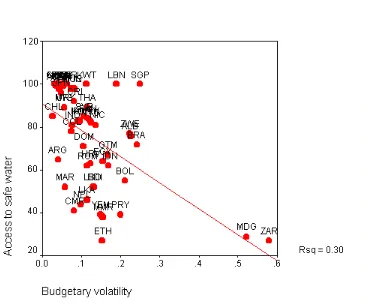
Figure 2 Budgetary volatility and access to safe water
Operational Relevance
In addition to their empirical relationship to development outcomes, second generation indicators are operationally relevant. This is largely because of the effort to design them to be institutionally specific. The next stage of the project took South East Europe as a pilot region to assess the feasibility of gathering sufficient data to construct governance scorecards. Representatives from the Stability Pact Anti-corruption Initiative (SPAI) and Bank staff working with them became interested in the second generation indicators as a relevant operational tool. World Bank economic and sector work on the Balkans
countries was comprehensively reviewed to gather information to construct the
indicators. The World Bank has been collaborating extensively with the OECD/SIGMA in developing indicators for the SPAI pillar on good governance, and in June 2001 a joint World Bank/SIGMA mission to the region sought data directly from governments.
Second generation governance indicators are also being implemented in operational work in Nigeria. The World Bank is currently preparing a Community and Local Government Development Project (CLGDP) with an anticipated approval in July 2002. This Specific Investment Loan totaling $100 million is currently under preparation. The objective of the project will be to establish a viable, sustainable and transparent institutional
mechanism for transferring investment resources to local governments and communities in order to enable them to finance their own development priorities.
The CLGDP team will consult on some draft indicators with government officials and communities in the course of project preparation. Initial consultation will also lead to a smaller number of tightly focused indicators that are seen as critical to assessing Local Government Authority (LGA) readiness. Such practical, relatively
easily-comprehensible indicators will facilitate not only the assessment process itself but also widespread publicity measures that inform stakeholders (particularly the public) in participating states, thereby supporting demand for good performance. Another important task for the CLGDP team will be to explore the types of responsibilities and powers that will serve as effective and appropriate incentives for LGAs that demonstrate qualitative improvement.
Another operational program where second generation governance indicators are featured prominently is in Cambodia. The key role of second generation indicators in Cambodia is as a means of monitoring and evaluating reform programs as a part of a new strategy for coordinating donor assistance, the Governance Action Plan (GAP). The goal of the GAP is to resolve potential conflicts and redundancies among different tasks, and permit governments, civil society organizations, and donors to monitor progress on multiple reform fronts according to a set of consensual, realistic, and transparent criteria for tracking reform implementation and impact. Indicators serve as the benchmarks to monitor and evaluate the performance of reform. Because the benchmarks are so prominent, their usefulness is meaningful only to the extent that they are objective and transparent to the eyes of all stakeholders involved.
Within the GAP for Cambodia, indicators serve in two roles. As impact indicators, they measure the extent to which a set of reform actions make an impact on administrative and governance structures in respective reform areas. Second generation indicators such as civil service employment numbers, average wages of civil service employees, and salary compression figures are useful. The second role of second generation indicators is as performance indicators, which measure changes in governance and the performance of the public sector. Indicators such as the level of corruption, accountability of the government, and the effectiveness and efficiency of service delivery are useful.
Finally, second generation governance indicators are being used to address public administration reforms in Albania. The Government of Albania has adopted a comprehensive policy reform program to strengthen Albania‘s weak institutional and governance capacity. This policy reform program is being supported by a Structural Adjustment Credit, which was approved by the Bank in June of 1999. The overall
implement the Government‘s Institutional and Public Administration Reform agenda effectively. The project will include a number of performance indicators, some of which are intended to serve more to focus the Government‘s attention on the longer term objectives of its reform effort, and others of which are intended to capture the more immediate and concrete progress that can reasonably be expected to be achieved during project implementation.
Conclusion
This project has approached the task of developing political acceptability and professional consensus on some quantitative measures of governance indicators
cautiously. If consensus is key to developing governance indicators that offer traction in institutional change, then careful testing of the water and sensitivity to the often justified concerns of governments is key to that consensus.
With that in mind, the project has progressed in the following areas: The DAC work to date on indicators of participatory democracy and good governance has been reviewed. The project has examined and drawn together potential governance indicators, both existing and new to identify the extent to which they meet each of several established criteria on quality and coverage of data, replicability and transparency, government ownership and acceptability, specificity with which particular institutions are implicated, and with some indicators, relevance to particular development outcomes. Furthermore, major work within the World Bank regarding indicators that capture aspects of corruption have been studied and incorporated into the second generation indicators of governance project. Use of the various governance indicators in operational work and research documents has also been tracked.
Efforts to date have not yet drawn robust conclusions between all of the indicators and pro-poor development outcomes. Work has progressed for some of the second
generation indicators and some of the UN‘s pro-poor development outcomes. Thus far the collection and pulling together of secondary data sources has been much more time intensive than was anticipated, slowing our progress in analyzing the data.
The next steps in the project are to continue analysis of the data to determine the relevance of second generation indicators to pro-poor development outcomes, post additional indicators to the DAC website as they become available, manage the website, and monitor feedback.
On December 19th 2001, the World Bank's Governance and Public Sector Reform Group of the Poverty Reduction and Economic Management Network hosted a workshop concerning progress made with the second generation governance indicators.
the United Nations‘ Millennium Development Goals. The December 19th workshop has also raised the prospect that partner institutions may adopt our methodology in
References
Ades, Alberto, and Rafael di Tella. 1996. ―The Causes and Consequences of Corruption: A Review of Recent Empirical Contributions,‖ IDS Bulletin, vol. 27, 2
Chong, Alberto, and Cesar Calderon. 1999. ―On the Causality and Feedback Between Institutional Measures and Economic Growth,‖ Unpublished World Bank paper.
Development Assistance Committee. 2000. A Better World For All 2000. Paris, Organisation for Economic Co-operation and Development.
Freedom House. 1999. Freedom House Website:
http://www.freedomhouse.org/survey99/method/.
Hall, Robert, and Charles Jones. 1999. ―Why Do Some Countries Produce So Much More Output Per Worker Than Others?‖ Quarterly Journal of Economics, vol. 114, 1: 83-116.
Johnson, Simon, Daniel Kaufmann, and Pablo Zoido-Lobaton. 1998. ―Regulatory Discretion and the Unofficial Economy,‖ American Economic Review, vol. 88, 2: 387-392.
Kaufmann, Daniel, Gil Mehrez, and Sergio Schmukler. 1999. ―Was the East Asia Crisis Predictable?‖ Unpublished World Bank paper.
Knack, Stephen, and Philip Keefer. 1997. ―Why Don‘t Poor Countries Catch Up? A Cross-national Test of an Institutional Explanation,‖ Economic Inquiry, vol. 35: 590-602.
Kugler, Mark. 2001. ―The Relationship Between a Few Second Generation: Governance Indicators and Measures of Pro-poor Outcomes.‖ Unpublished World Bank paper.
Mauro, Paolo. 1995. ―Corruption and Growth,‖ Quarterly Journal of Economics, vol. 110, 3: 681-712.
Rodrik, Dani. 1997. ―TFPG Controversies, Institutions, and Economic Performance in East Asia,‖ NBER Working Paper No. W5914.
Tanzi, Vito, and Hamid Davoodi. 1997. ―Corruption, Public Investment, and Growth,‖ IMF Working Paper WP/97/139.
NICK MANNING
Nick Manning is Lead Public Sector Management Specialist in the Public Sector Group at the World Bank with responsibility for knowledge management of the Bank‘s work on administrative and civil service reform. His previous positions include: Visiting Scholar at the World Bank; Chief Technical Adviser (UNDP) to the Minister of State for
Administrative Reform, Lebanon; and Adviser (Organisation Structure and Design), Commonwealth Secretariat, London. Nick began his public sector career in local government in the U.K., and has worked extensively in the public and private sectors in the U.K. Nick is Adviser to the Commonwealth Association for Public Administration and Management, member of the International Advisory Board to the International Personnel Management Association and of the International Advisory Panel to the UK Civil Service College. He is also member of the editorial board of the Public
Management Review.
STEPHEN KNACK
Stephen Knack is a Senior Research Economist in the Development Research Group and the Public Sector Group at the World Bank. Much of his research addresses the social and political determinants of growth and effective governance. He is also the author of numerous studies of American political participation and elections. Before coming to the World Bank in 1999, he was a Research Associate at the University of Maryland‘s IRIS Center, and Assistant Professor in American University‘s School of Public Affairs. He earned a PhD in Economics from the University of Maryland in 1991.
MARK KUGLER