Performance Analysis of Proactive and Reactive MANET
Routing Protocols using TCP Traffic for Freeway and
Random Waypoint Mobility Model
Sunil Kr. Maakar ,Sudesh Kumar , Amit Nain
Department of CSE/IT BRCM CET Bahal Haryana - 125001
ABSTRACT
Mobile ad-hoc network is a collection of wireless mobile hosts forming a temporary network without the aid of any stand-alone infrastructure or centralized administration. Mobile ad-hoc network have the attribute such as wireless connection, continuously changing topology, distributed operation and ease of deployment. In this paper we have investigated the performance of two MANET routing protocol (Proactive and Reactive) by using Freeway and Random Waypoint mobility model for mobility of nodes using TCP traffic. Freeway Mobility model has been generated by IMPORTANT (Impact of Mobility Patterns on Routing in Ad-hoc NeTwork) tool, whereas Random Waypoint by inbuilt setdest tool in NS2. A detailed simulation has been carried out in NS2 with TCP traffic sources and AODV as reactive and DSDV as proactive routing protocols. The metrics used for performance analysis are Packet Delivery Fraction, Average end-to-end Delay, Packet Loss, Routing Overhead, Normalized Routing Load and throughput. It has been observed that (proactive routing protocol) DSDV performance is better than (reactive routing protocol) AODV but at the cost of higher average end-end delay in both mobility models. Both routing protocols give optimized result in Random Waypoint mobility model as compared to Freeway Mobility Model.
Keywords
MANET, Routing Protocol, IMPORTANT, TCP, Mobility Model, Performance Metrics
1.
INTRODUCTION
Mobile networks can be classified into infrastructure networks and mobile ad hoc networks (MANET) according to their dependence on fixed infrastructures [2]. In an infrastructure mobile network, mobile nodes have wired access points (or base stations) within their transmission range. In contrast, mobile ad hoc networks are autonomously self-organized networks without infrastructure support. In a mobile ad hoc network, nodes move arbitrarily, therefore the network may experience rapid and unpredictable topology changes. Routing paths in MANETs potentially contain multiple hops, and every node in MANET has the responsibility to act as a router [4]. Routing in MANET has been a challenging task ever since the wireless networks came into existence. The major reason for this is the continues change in network topology because of high degree of node mobility. A number of protocols have been developed to accomplish this task.
There are various mobility models such as Random Way Point, Reference Point Group Mobility Model, Manhattan Mobility Model, Freeway Mobility Model, Gauss Markov Mobility Model etc. have been proposed for evaluation [8, 15]. In this paper we have investigated the performance of reactive (AODV) and proactive (DSDV) routing protocols for performance comparions in the scenario of mobility of nodes on a Highway and for
random distribution of nodes in grounds. For this scenario we have used Freeway mobility model and Random Waypoint Mobility Model. The purpose of this work is to understand their working mechanism and investigate that which routing protocol gives better performance on mobility of nodes for Freeway Mobility Model and Random Waypoint Mobility Model.
1.
Mobility Models
Freeway Mobility Model
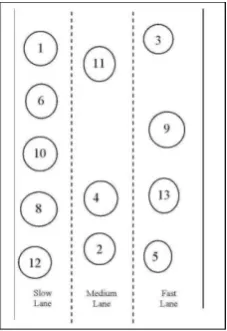
[image:1.595.367.481.392.558.2]This model emulates the motion behavior of mobile nodes on a freeway [7]. It can be used in exchanging traffic status or tracking a vehicle on a freeway. Each mobile node is restricted to its lane on the freeway. The velocity of mobile node is temporally dependent on its previous velocity. Following is an exemples of topography showing the movement of nodes for Freeway Mobility Model with twelve nodes.
Figure 1: Movement of nodes for Freeway Mobility Model
Important Characteristics: In this model we use maps. There are several freeways on the map and each freeway has lanes in both directions. The differences between Random Waypoint and Freeway are the following:
(1) Each mobile node is restricted to its lane on the freeway. (2) The velocity of mobile node is temporally dependent on its previous velocity. Formally,
)
(
()
)
(
)
1
(
t
V
t
random
a
t
V
i
i
i(1) (3) If two mobile nodes on the same freeway lane are within the Safety Distance (SD), the velocity of the following node cannot exceed the velocity of preceding node. Formally,
)
(
)
(
)
(
,
,
,
,
j tD
ijt
SD
V
it
V
jt
i
Due to the above relationships, the Freeway mobility pattern is expected to have spatial dependence and high temporal dependence. It also imposes strict geographic restrictions on the node movement by not allowing a node to change its lane.
Random Waypoint Mobility Model
The Random Waypoint model is most commonly used mobility model in research community [7, 13]. In the current network simulator (NS-2) distribution, the implementation of this mobility model is as follows: at every instant, a node randomly chooses a destination and moves towards it with a velocity chosen uniformly randomly from [0, V_max], where V_ max is the maximum allowable velocity for every mobile node.
After reaching the destination, the node stops for a duration defined by the 'pause time' parameter. After this duration, it again chooses a random destination and repeats the whole process again until the simulation ends
The Random Waypoint model is provided also by the setdest tool in the standard NS-2.
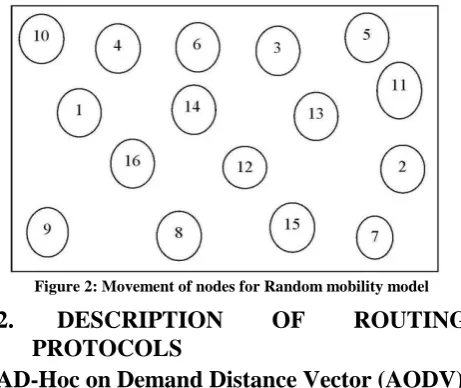
[image:2.595.56.287.309.503.2]Figures 2 illustrate examples of a topography showing the movement of nodes for Random Mobility Model.
Figure 2: Movement of nodes for Random mobility model
2.
DESCRIPTION
OF
ROUTING
PROTOCOLS
AD-Hoc on Demand Distance Vector (AODV)
The Ad Hoc On-Demand Distance Vector Routing Protocol is a reactive routing protocol based on DSDV [1, 3, 14]. It was introduced in 1997. AODV is designed for networks with tens to thousands of mobile nodes. One feature of AODV is the use of a destination sequence number for each routing table entry. Sequence numbers are very important because they ensure loop freedom and simple to program. Sequence numbers are used by other nodes to determine the freshness of routing information. If a node has the choice between 2 routes to a destination, a node is required to select the one with the greater sequence number. AODV deals with routing table. Every node has a routing table. When a node knows a route to the destination, it sends a route reply to the source node. Route Requests (RREQs), Route Replies (RREPs) and Route Errors (RERRs) are message types defined by AODV.
Destination Sequenced Distance Vector (DSDV)
This routing protocol was developed in 1994 by C. Perkins and it is a proactive distance-vector protocol [4, 9, 15].
Destination-Sequenced Distance-Vector Routing protocol is a proactive table driven algorithm based on classic Bellman-Ford routing. In proactive protocols, all nodes learn the network topology before a forward request comes in. In DSDV protocol each node maintains routing information for all known destinations. The routing information is updated periodically.
Each node maintains a table, which contains information for all available destinations, the next node to reach the destination, number of hops to reach the destination and sequence number. The nodes periodically send this table to all neighbors to maintain the topology, which adds to the network overhead. Each entry in the routing table is marked with a sequence number assigned by the destination node. The sequence numbers enable the mobile nodes to distinguish stale routes from new ones, there by avoiding the formation of routing loops.
3.
SIMULATION SETUP
We have used Network Simulator (NS-2) in our evaluation. The NS-2 is a discrete event driven simulator [5, 6] developed at UC Berkeley. We have used Red Hat Linux environment with version of the network simulator is NS-2.34. The goal of NS-2 is to support networking research and education. It is suitable for designing new protocols, comparing different protocols and traffic evaluations. It is an object oriented simulation written in C++, with an OTcl interpreter as a frontend. NS uses two languages because simulator got to deal with two things: i) detailed simulation of protocols which require a system programming language which can efficiently manipulate bytes, packet headers and implement algorithms, ii) research involving slightly varying parameters or quickly exploring a number of scenarios.
[image:2.595.297.546.383.590.2]The protocols maintain a send buffer of 50 packets. To prevent buffering of packets indefinitely, packets are dropped if they wait in the send buffer for more than 30s.The parameter used for carring out simulation are summarized in the table 1.
Table 1: Simulation Parameters
Parameters Value
Routing Protocols AODV DSDV
MAC Layer 802.11
Packet Size 512 bytes
Terrain Size 1000m * 1000m
Nodes 50
Mobility Model Freeway and Random Waypoint Mobility Model
Data Traffic TCP
TCP Source 10
Simulation Time 900 sec.
Maximum Speed 0-60 m/sec (interval of 10)
The movement in the Freeway Mobility model is generated by a software called Mobility Generator which is based on a frame work called Important (Impact of Mobility Patterns on Routing in Ad-hoc NeTwork, from University of Southern California)[16,17].In the scenario we have used two highway with three lane each and having traffic in opposite direction. The traffic source used is of TCP nature and the maximum number of sources are 10 which is generated by inbuilt tool of NS2 [6].
Performance Metrics
Packet Delivery Ratio
It is the ratio of data packets delivered to the destination to those generated by the TCP sources. It is calculated by dividing the number of packet received by destination through the number packet originated from source.
PDF = (Pr/Ps)*100
Where Pr is total Packet received & Ps is the total Packet sent.
Routing Overhead
It is the total number of control or routing (RTR) packets generated by routing protocol during the simulation. All packets sent or forwarded at network layer is consider routing overhead.
Overhead = RTR packets
Normalized Routing Load
Number of routing packets “transmitted” per data packet “delivered” at destination. Each hop-wise transmission of a routing is counted as one transmission. It is the sum of all control packet sent by all node in network to discover and maintain route.
NRL = Routing Packet/Received Packets
Average End-to-End Delay (second)
This includes all possible delay caused by buffering during route discovery latency, queuing at the interface queue, retransmission delay at the MAC, propagation and transfer time. It is defined as the time taken for a data packet to be transmitted across MANET from source to destination.
D = (Tr –Ts)
Where Tr is receive Time and Ts is sent Time
Packet Loss
It occurs when one or more packets fail to reach to their destination.
Packet Loss % = (1-Pr/Ps)*100
Where Pr is total number of Received Packets and Ps is total number of Sent Packets.
Throughput (packets/second)
It is the rate at which network send or receive data. It is good channel capacity of network connections and rated in term of bits or packets per seconds. It is the sum of data rates that are delivered to all nodes in MANET.
Throughput = Pr/Pf
Where Pr is the total number of Received Packets and Pf is the total number of Forwarded Packets.
4.
RESULT AND DISCUSSION
Packet Delivery ratio:
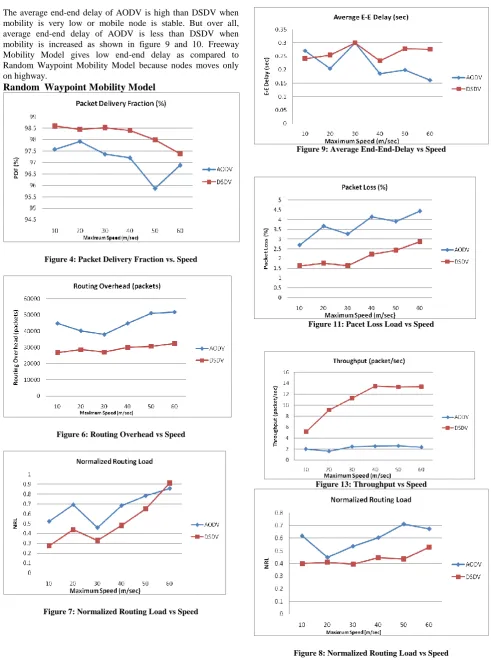
In Freeway Mobility Model, DSDV deliver almost (97-98.5%) originated data packets as compared to AODV which deliver almost (95.5-97.5%) originated data packets as shown in figure 3. Where as in Random Waypoint Mobility Model DSDV deliver almost (97.5-98.5%) as compared to AODV which deliver (96-97.5%) originated data packets (fig. 4). It also shows that initially when the nodes mobility is low the packet delivery ratio of both protocols is high, but with increases in velocity the PDF of both protocols decreases gradually as shown in figure 3 and 4.
In both mobility models proactive routing Protocol gives better result than reactive routing Protocol. It is also infer that both Protocol gives optimized result in Random Waypoint Mobility Model than Freeway Mobility Model.
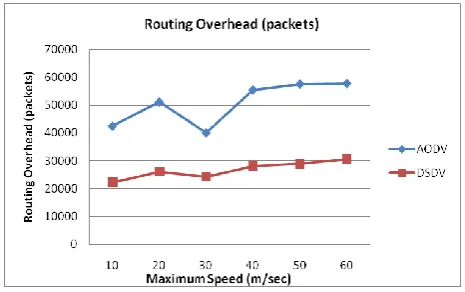
Routing Overhead:
In both Mobility Models the Routing Overhead of DSDV is low as compared to AODV routing Protocol as shown in figure 5 and 6. It also shows that AODV has higher overhead than DSDV due to three main reasons. Firstly, AODV allows local broadcast. Although the discovery packets are broadcasted only when necessary, such as establishing a new route, link breakage or route error, the broadcast instances will often appear for a fast mobile node. Secondly, AODV allows mobile nodes to respond to link breakage and changes in network topology in timely manner.
[image:3.595.306.557.254.406.2]Freeway Mobility Model
Figure 3: Packet Delivery Fraction vs. Speed
Figure 5: Routing Overhead vs Speed
Thirdly, AODV is derived form DSDV. It still has similar feature of proactive routing protocols, when the network topology is often changed because of the fast mobility of nodes, proactive protocols must send more messages to maintain a valid routing table. Routing Overhead is low in Random Waypoint Mobility Model as compared to Freeway Mobility Model.
Normalized Routing Load:
AODV has higher NRL as compared to DSDV routing Protocol in both Mobility Model and NRL is increase with speed as shown in figure 7 and 8. NRL in Freeway Mobility Model is high as compared to Random Waypoint Mobility Model. It is due to the restriction of mobility of nodes on lane in Freeway Mobility Model.
[image:3.595.323.556.436.582.2]The average end-end delay of AODV is high than DSDV when mobility is very low or mobile node is stable. But over all, average end-end delay of AODV is less than DSDV when mobility is increased as shown in figure 9 and 10. Freeway Mobility Model gives low end-end delay as compared to Random Waypoint Mobility Model because nodes moves only on highway.
Random Waypoint Mobility Model
Figure 4: Packet Delivery Fraction vs. Speed
[image:4.595.51.543.65.728.2]Figure 6: Routing Overhead vs Speed
Figure 7: Normalized Routing Load vs Speed
Figure 9: Average End-End-Delay vs Speed
Figure 11: Pacet Loss Load vs Speed
Figure 13: Throughput vs Speed
Figure 10: Average End-End-Delay vs Speed
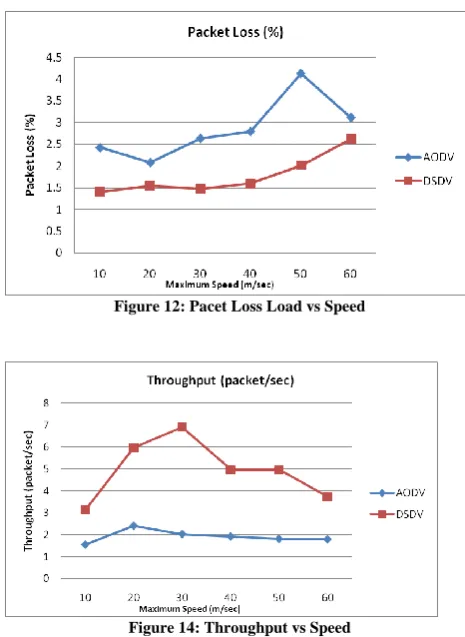
Figure 12: Pacet Loss Load vs Speed
Figure 14: Throughput vs Speed
Packet Loss
The packet loss rate of both the routing protocols is degraded with higher speed due to increase in mobility. The link breakage frequency gets increased and the droping become more in both Mobility Model as shown in figure 11 and 12. The packet loss percentage of DSDV is low as compared to AODV in both mobility models. The figures also show that packet loss percentage is low in Random Waypoint Mobility Model than Freeway Mobility Model.
Throughput:
The figure 13 and 14 revels, that DSDV has higher throughput than AODV in both mobility models. In large network, nodes may communicate mostly with physically nearby nodes. If local communication predominates, path lengths could remain nearly constant as the mobility increases and so DSDV gives better throughput than AODV. AODV gives almost constant throughput at all speed in both mobility model. The throughput
is high in Freeway Mobility Model as compared to Random Waypoint Mobility Model.
5.
CONCLUSIONS
From figure 3 to 14, it is inferred that proactive routing protocol DSDV perform better than Reactive routing protocol AODV in Freeway as well as in Random Waypoint Mobility Model with TCP traffic source. Proactive routing protocol send periodic update information so that use higher bandwidth than Reactive routing protocol AODV. The Average end-end delay of AODV is less than DSDV when speed is high. Over all, the performance of proactive routing protocol DSDV is better than reactive routing protocol AODV at the cost of higher end-end delay. It is also infer that both routing protocol with Random Waypoint Mobility Model gives optimized result than Freeway Mobility Model. Because in Freeway Mobility Model the nodes is restricted to its lane on highway but in Random Waypoint Mobility Model nodes can move any direction.
In this paper, only two routing protocol are used and their performance has been analyzed only under TCP traffic with maximum 10 number of sources using Freeway and Random Waypoint Mobility Models. This paper can be enhanced by analyzing the other MANET routing protocols under different traffic source with more number of connections using different mobility models.
6.
REFERENCES
[1] S. Das, C. E. Perkins, E. Royer, “Ad Hoc On Demand Distance Vector (AODV) Routing”, IETF Draft, June 2002.
[2] C-K Toh “Ad Hoc Mobile Wireless Networks Protocols and Systems”, First Edition, Prentice Hall Inc, USA, 2002.
[3] C.E. Perkins and E.M.Royer, “Ad-Hoc On Demand Distance Vector Routing”, Proceedings of the 2nd IEEE Workshop on Mobile Computing Systems and Applications, New Orleans, LA, USA, pages 90-100, February 1999.
[4] Elizabeth M. Royer and Chai-Keong Toh, “A Review of Current Routing Protocols for Ad Hoc Mobile Wireless Networks”, IEEE Personal Communications, pages 46-55, April 1999.
[5] UCB/LBNL/VINT N/W Simulator cs.berkeley.edu /ns
[6] “The Network Simulator - ns-2,” available at http://www.isi.edu/nsnam/ns/.
[7] Fan Bai, Ahmed Helmy “A Framework to systematically analyze the Impact of Mobility on Performance of Routing Protocols for Adhoc Networks”, IEEE INFOCOM 2003.
[8] Tracy Camp, Jeff Boleng, Vanessa Davies “A Survey of Mobility Models for Ad Hoc Network Research”, Wireless Communication & Mobile Computing (WCMC): vol. 2, no. 5, pp. 483-502, 2002.
[10] Charles E. Perkins and Elizabeth M. Royer, “Ad-Hoc On Demand Distance Vector Routing”, In Proceedings of the Second IEEE Workshop on Mobile Computing Systems and Applications, pp. 90– 100, February 1999.
[11] P. Jacquet, and P. Muhlethaler, et al, “Optimized Link State Routing Protocol”, IETF Internet draft, March 2001.
[12] S.Corson and J.Macker, “Routing Protocol Performance Issues and Evaluation considerations”, RFC2501, IETF Network Working Group, January 1999.
[13] C. Bettstetter, G. Resta and P. Santi, “The node distribution of the random waypoint mobility model for wireless ad hoc networks,” Proc. of IEEE Transactions on Mobile Computing 2, pp. 257–269, July–September 2003.
[14] C. Perkins, E. Belding-Royer, S. Das, quet, “Ad hoc On-Demand Distance Vector (AODV) Routing”, RFC 3561, July 2003.
[15] N. Aschenbruck, E.Gerhands - Padilla, P.Martini, ”A Survey on mobility models for Performance analysis in Tactical Mobile networks,” Journal of
Telecommunication and Information
Technology,Vol.2 pp.54-61,2008.
[16] Harminder S. Bindra, Sunil K. Maakar,A. L. Sanga” Performance Evaluation of two reactive routing protocol of MANET ”IJCSI International Journal of Computer Science Issues, Vol. 7, Issue 3, No 10, May 2010.