A Novel Preprocessing Technique for Session
Construction using Propositional DAGs
S. Chitra
Assistant Professor Department of Computer Science Government Arts College (Autonomous)
Coimbatore, 641 018, India.
B. Kalpana,
PhD. Associate Professor Department of Computer Science Avinashilingam Institution for Home science andHigher Education for Women, Coimbatore, 641 043, India.
ABSTRACT
This paper continues the line of research on Web access log analysis. Web access log analysis is to analyze the patterns of web site usage and the features of users’ behavior. It is the fact that the normal Log data is very noisy and unclear and it is vital to preprocess the log data for efficient web usage mining process. Preprocessing is the process comprises of three phases which includes data cleaning, user identification and session construction. Session construction is very vital and numerous real world problems can be modeled as traversals on graph and mining from these traversals would provide the requirement for preprocessing phase. On the other hand, the traversals on unweighted graph have been taken into consideration in existing works. This paper oversimplifies this to the case where vertices of graph are given weights to reflect their significance. The proposed method constructs sessions as a Propositional Directed Acyclic Graph (PDAGs) which contains pages with calculated weights. We identify a new property called simple-negation, which is an implicit restriction of all Negation Normal Form (NNFs) and Binary Decision Diagram(BDDs). The removal of this restriction leads to Propositional Directed Acyclic Graphs (PDAG), a more general family of graph-based languages for representing Boolean functions or propositional theories. This will help site administrators to find the interesting pages for users and to redesign their web pages. After weighting each page according to browsing time a PDAGs structure is constructed for each user session. Existing system in which there is a problem of learning with the Boolean function and the problem can be overcome by the proposed method.
Keywords---Web Usage Mining, Propositional DAGs, Session Construction, Directed Acyclic Graph (DAG), Preprocessing, Robots Cleaning
1. INTRODUCTION
Nowadays World Wide Web sites on the internet are the sources of useful information. As a result there is a huge improvement in its volume of traffic, the size and difficulty of web sites. World Wide Web grows rapidly day by day. So researchers are paying more and more attention on the effectiveness of services obtainable to the users over the internet. Web usage mining is an active technique which is used in this field of research. It is also called as web log mining in which the data mining techniques are applied to web access log. A web access log is a time series record of user’s requests each of which is sent to a web server at any time a user sent a request. There are many types of web logs due to different server setting parameters. But typically the log files share the same basic information such as client IP address, request time, requested URL, HTTP status code, referrer etc.
Web usage mining extracts regularities of user access behavior as patterns, which are defined by combinations, orders or structures of the pages accessed by the internet. Web usage mining consists of three main steps:
Collection of Web data Data Preprocessing Knowledge Extraction Analysis of Extracted Results
The process in which Collection of data is the first step in which it represents the activities or clickstreams recorded in the Web server log. Preprocessing is an important step since the Web architecture is very complex in nature and 80% of the mining process is done at this phase.
Administrators of the web sites have to know about the users background and their basic needs. For this statistical analysis such as Google Analytics are used to examine the logs in terms of page views, page exit ratio, visit duration etc. With the help of this statistical analysis administrators can know about frequently accessed page, average view time and so on. But there are few drawbacks in statistical analysis. It gives low level error report on unauthorized entry points, invalid URLs are not found properly etc. Web usage mining enables administrators to provide complete analysis than statistical methods. It extracts a lot of patterns for administrators to analyze. This paper provides a method which analyses log files and extracts access patterns containing browsing time of each page using graphs [16].
Graph and traversal are extensively used to model a number of classes of real world problems. For example, the structure of Web site can be modeled as a graph in which the vertices represent Web pages, and the edges correspond to hyperlinks between the pages [7]. Mining using graphs turns out to be a center of interest. Traversals on the graphs are the models of User navigations on the Web site [14]. Once a graph and its traversals are specified, important information can be discovered. Frequent substructure pattern mining is an emerging data mining problem with many scientific and commercial applications [15]. This paper provides a new version to the previous works by considering weights attached to the vertices of graph. Such vertex weight may reflect the importance of vertex. For example, each Web page may have different consequence which reflects the value of its contents.
many areas of computer science and mathematics, most notably in artificial intelligence, digital system design, formal verification, mathematical logic, and combinatorial optimization. In most cases, they are used to represent knowledge as sets of possible states with respect to some propositional variables describing the world. In this sense, Boolean functions are fundamental knowledge representation tools.
The remainder of this paper is organized as follows. The next section presents some basic of web log server. Section 3 provides the main steps of web usage mining. Section 4 describes about PDAGs construction and some experimental results are illustrated in Section 5. Finally, the conclusions are drawn in Section 6.
2. RELATED WORKS
Various commercial available web server log analysis tools are not designed for high traffic web servers and provide less relationship analysis of data relationships among accessed files which is essential to fully utilize the data gathered in the server logs [3]. Web server log file is a simple plain text file which record information about each user. Log file contain information about user name, IP address, date, time, bytes transferred, access request. A Web log is a file to which the Web server writes information each time a user requests a resource from that particular site. When user submit request to a web server that activity are recorded in web log file. Log file range 1KB to 100MB. Log file gives significant information to web server. Web server logs contain more information about visitor’s information in the access logs, usually in W3C format. There are also the error logs for each server that contains information on errors and problems that the server practiced. The statistical analysis introduces a set of parameters to describe user’s access behaviors. With those parameters it becomes easy for administrators to define concrete goals for organizing their web sites and improve the sites according to the goals. But the drawback in this analysis is that the results are independent from page to page. Since user’s behavior is expected to be different dependent on length of browsing time, the calculation of accurate browsing time is more important [5].
A labeled graph is a tuple , where is the set of vertices, is the set of edges and is a labeling function with a finite set of labels [9]. For an edge is the parent of and is the child of . If there is a set of vertices V such that , is called a path, is an ancestor of un and is a descendant of . There is a cycle in the graph if a path can be found from a vertex to itself. An edge of the graph is said to be a transitive edge if besides the edge , there also exists another path from to in . A labeled graph is without cycles. Let be a set of labeled PDAGs and be an absolute frequency threshold. PAG algorithm specifies that a PDAG P is a frequent embedded sub-PDAG of D if it is embedded in at least PDAGs of D.
Prediction of users interest is the most important aspect of web usage mining. For this frequency and order of visited pages are considered. But Time spent on web pages is more important factor which is estimated from the log information and it is used as an indicator in other fields such as information retrieval, human-computer interaction (HCI) and E-Learning [2].
Duration time is the time that a user spends on reading a
page in a session. Let and are two adjacent pages in a session. The timestamp field of is Ti, and of is Ti+1. Suppose is the loading time of , and is the loading time ancillary files. By subtracting the time required for loading and the ancillary files from the time difference between the requests of and that of , the duration time of can be calculated [4].
The browsing time of an accessed page equals the difference between the access time of the next and present page. But with a more careful analysis, this difference includes not only user's browsing time, but also the time consumed by transferring the data over internet, launching the applications to play the audio or video files on the web page and so on. The user's real browsing time is difficult to be determined; it depends on the content of the page, the real-time network transfer rate, user's actions and computer’s specifications and so on [13].
All of these works attempt mainly to find the exact browsing time of users so that web administrators can understand the interest of their users in web pages. In the proposed method a more accurate browsing time is found and creation of sessions as graphs depending on the time accessed.
3. PREPROCESSING
The quality of session construction significantly affects the whole performance of a web usage mining system. To improve the quality log data should be reliable. Preprocessing is a vital phase before mining to select the reliable data. Data Cleaning, user identification, sessions construction are the steps in preprocessing.
3.1. Data Cleaning
Data Cleaning enables to filter out useless data which reduce the log file size to use less storage space and to facilitate upcoming tasks [8]. It is the first step in data preprocessing. The log format used in this method is Extended Common Log Format with the fields as follows: “IP address, username, password, date/timestamp, URL, version, status-code, bytes-sent, referrer-URL, user-agent”.
If a user needs a particular page from server entries like gif, JPEG, etc., are also downloaded which are not helpful for further investigation are eliminated. The records with failed status code are also eliminated from logs. Automated programs like web robots, spiders and crawlers are also to be eradicated from log files. An algorithm for cleaning the entries of server logs is presented below [21].
Input: Log Table (LT)
Output: Summarized Log Table (SLT)
‘*’ = access pages consist of embedded objects
(i.e .jpg, .gif, etc)
‘**’ =successful status codes and requested methods (i.e
200, GET etc)
Begin
1. Read records in LT
2. For each record in LT
3. Read fields (Status code, method)
4. If Status code=‘**’and method= ‘**’
5. Get IP_address and URL_link
6. If suffix.URL_Link= {*.gif,*.jpg,*.css}
Then
7. Remove suffix. URL_link
8. Save IP_sddress and URL_Link
End if
Else
9. Next record
End if
End
Thus removal process includes elimination of irrelevant records as follows:
If the status code of all record is fewer than 200 and better than 299 then those records are eradicated.
The cs-stem-url field is verified for its extension filename. If the filename has gif, jpg, JPEG, CSS, and so on they are eradicated.
The records which request robots.txt are eradicated and if the time taken is incredibly little like less than 2 seconds are considered as automated programs traversal and they are also eradicated [8].
All the records which have the name “robots.txt” in the requested resource name (URL) are recognized and straightly eradicated.
3.2. User Identification
In this step users are identified from log files. Sites needed registration stores that the user data in log records. But those sites are few and often neglected by users. IP address, referrer URL and user agent in the log record is considered for this task. Unique users are identified as follows:
If two records has dissimilar IP address they are differentiated as two different users else if both IP address are similar then User agent field is verified.
If the browser and operating system information in user agent field is dissimilar in two records then they are recognized as different users else if both are identical then referrer url field is checked.
If URL in the referrer URL field in present record is not accessed before or if url field is blank then it is considered as a new user.
3.3. Session Identification
A user session is defined as a sequence of requests made by a single user over a certain navigation period and a user may have a single or multiple sessions during a period of time. The objective of session identification is to segregate the page accesses of each user into individual sessions. Reconstruction of precise user sessions from server access logs is a difficult task because the access log protocol (HTTP protocol) is status less and connectionless. There are two simple methods for session identification. One is based on total session time and other based on single page stay time. The set of pages visited by a specific user at a specific time is called page viewing time. It varies from 25.5 minutes [12] to 24 hours [8] at the same time as default time is 30 minutes by R.Cooley [4]. The second
method depends on page stay time which is calculated with the difference between two timestamps. If it goes over 10 minutes the second entry is understood as a new session. The third method based on navigation of users through web pages. But this is accomplished by using site topology which is not used in our method.
4. PDAGS CONSTRUCTION
In the proposed method sessions are modeled as a graph. Graph mining extracts users access patterns as a graph structure like the web sites link structure. To make efficient analysis when users handle more pages at the same time using tab browsers graph mining gives excellent results. Vertices are represented as web pages and edges are represented as hyperlink between pages. A graph is represented as a tuple of vertices, edges which connect the vertices [13]. User navigations are given as traversals in a graph. Each traversal can be represented as a sequence of vertices, or equivalently as a sequence of edges. PDAGs construction phase has following tasks.
4.1. Calculation of Browsing Time
The first task is to calculate browsing time of each page. For this the timestamp fields of the records are considered. Real Browsing time is very difficult to calculate since it depends on network transfer rate, user’s actions, and computer specifications and so on. Browsing Time and Request Time recorded in log are abbreviated as and . Browsing time of page ‘p’ is equal to the period of time with the time difference between the of the request which include ‘ ’ as a reference and another of the request which include ‘ ’ as a requested page. In the log record one of the fields is bytes_sent which is the size of the web page. ‘ ’ is the data transfer rate. So the real browsing time is assumed as
= ’ – bytes_sent / c
where ’ is the difference between reference and request page of ‘p’.
4.2. Calculation of Weight of Pages
The second task in this method is to fix minimum and maximum browsing time for each page as BTmin and BTmax is used to calculate the weighing function which is to be used as a label in the graph. They are assumed by the administrators. The next step is to discretise the browsing time and given to each page as the weight which denotes the length of browsing time. Weighting function is calculated as follows
Wt (p, BTp ) = 0 when BTp ≠ null and BTp < BTmin
Wt (p, BTp ) = 1 when BTp ≠ null and
BTmin ≤ BTp ≤ BTmax
Wt (p, BTp ) = 2 when BTp ≠ null and BTmax < BTp Wt (p, BTp ) = 3 when BTp = null
4.3. PDAGs Construction
The PDAGs (Propositional Directed Acyclic graph) is used to represent the Boolean function. Consider a set V of r propositional variables and a Boolean function (BF) f: {0, 1} r → {0, 1}. Such a function f can also be viewed as the set of n-dimensional vectors x € {0, 1} r
for which f evaluates to 1. This is the so-called satisfying set or set of models Sf = {x € {0, 1}
r
: f(x) = 1} of f, for which an efficient representation has to be found (Clote & Kranakis 1998). As in the case of BDDs and NNFs, the representation we propose here is based on directed acyclic graphs, but now we impose the following particularities.
A Propositional DAG (PDAG) is a rooted directed acyclic graph of the following form:
1. Leaves are represented by ○ and labeled with ┬ (true), ┴ (false), or x € V ;
2. Non-leaves are represented by ∆ (logical and), (logical or), or ◊ (logical not);
3. ∆- and -nodes have at least one child;
4. ◊-nodes have exactly one child.
Leaves labeled with ┬ (┴) represent the constant BF which evaluates to 1 (0) for all x € {0, 1}r
. A leaf labeled with x € V is interpreted as the assignment x = 1, i.e. it represents the BF which evaluates to 1 iff x = 1. The BF represented by a ∆-node is the one that evaluates to 1, iff the BFs of all its children evaluate to 1. Similarly, a -node represents the BF that evaluates to 1, iff the BF of at least one child evaluates to 1. Finally, a ◊-node represents the complementary BF of its child, i.e. the one that evaluates to 1, iff the BF of its child evaluates to 0. The BF of an arbitrary PDAG will be denoted by f .
Formally, we will write PDAGV for the set of all possible PDAGs with respect to V. We follow the view from (Darwiche 2001a; Darwiche & Marquis 2002) and call PDAGV a language. When no confusion is anticipated, we omit the reference to the set V , i.e. we simply write PDAG instead of PDAGV . Our convention is to denote PDAGs by lower-case
Greek letters such as ψ the like. Note that any node α included in a PDAG defines its own (sub-) PDAG, and is thus another element of PDAG.
The number of edges of a PDAG , € PDAG is called its size and denoted by . A literal is either a leaf or a ◊-node whose child is a leaf. PDAGs are called binary, if no ∆- or -node has more than two children. The set of variables included in a sub-PDAG α of is denoted by vars(α). The path-length of a path from the root to a leave is the number of edges minus the number of ◊-nodes along the path. The height of , denoted by h( ), is its maximal path-length.
Any Boolean function can be represented by a PDAG, so the PDAG language is complete. On the other hand, PDAGs are not canonical, i.e. we may have several equivalent PDAGs representing the same Boolean function. Two PDAGs , €PDAG are equivalent, iff This is denoted by . Furthermore, entails ψ, denoted by , if for all x € {0, 1}r. In terms of their satisfying sets, means equivalence and entailment.
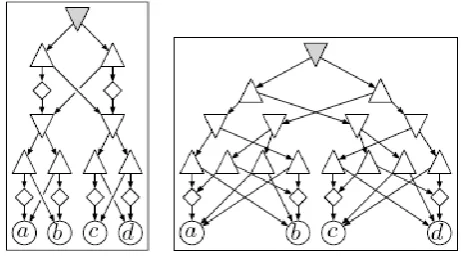
Figure 1 depicts two equivalent PDAGs and representing the so-called odd parity function with respect to V = {a, b, c, d}. They are both binary and have the same
[image:4.595.324.555.109.238.2]height = 4, but with = 24 is substantially smaller than with = 32.
Fig 1: Two PDAGs Represents the Odd Parity Function
4.4 Pattern Extraction Phase
Once a graph and its traversals are specified, valuable information can be retrieved through graph mining. Normally they are in the form of patterns. Frequent patterns which are sub traversals occurred in a large ratio are considered for analysis. To discover PDAGs i.e., sub graphs PDAG mining algorithm is used which derive closed frequent sets. It replaces closed frequent PDAG mining problem with the problem of closed frequent item-set mining on edges with the restriction that all the labels of the vertices in a PDAG must be distinct. By the reconstruction of PDAG structures from the mined closed frequent edge set, closed frequent PDAG’s are obtained..
4.5 Clustering Pattern
The last step is clustering of the mined patterns. The purpose of clustering is to group patterns which have similar page transitions. Each pattern is analyzed as different user behavior with browsing time. Weight of each page is not considered in clustering. The similarity of the patterns is to be estimated. Similarity of graphs is based on the labels of vertices and the edges. There are many clustering algorithms available to group the similar patterns. Administrators have to analyze the patterns respectively and it is time-consuming. They have to understand the meaning of each and every sub pattern to find out the problem of their web sites. If a content page has 0 weights then they have to redesign the page.
5. EXPERIMENTAL RESULTS
To confirm the usefulness and effectiveness of the proposed methodology, an experiment is carried out with the web server log of the library of South-Central University for Nationalities. The preliminary data source of the experiment is from May 28, 2006 to June 3, 2006, which size is 129MB. Experiment is carried out on MATLAB. Table-I is the obtained results from the experiment.
Table-I The Processes and Results of Data Preprocessing in Web Usage Mining
Number of records in
raw web log
Number of records after data
cleaning
Number of users
Number of session construction
using PDAG
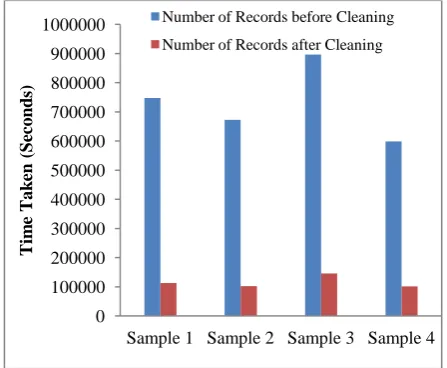
Table 1 show that after data cleaning, the number of log data diminished from 747890 to 112783.
[image:5.595.57.281.137.321.2]Four samples from the same university are obtained to evaluate the cleaning phase. From Figure-1 it is confirmed that the unwanted and irrelevant records are cleaned.
[image:5.595.69.278.399.571.2]Figure-2: Data Cleaning of Sample Records
Table-II The following table summarizes the supported queries of the entire family of PDAG sublanguages.
From Table-II, it can be observed that using the Propositional DAGs the data is identified in short span of time. The PDAG model which as the greater flexibility in representing the data as compared with existing method.
6. CONCLUSION
Web log data is a collection of huge information. Many interesting patterns available in the web log data. But it is very complicated to extract the interesting patterns without preprocessing phase. Preprocessing phase helps to clean the records and discover the interesting user patterns and session construction. But understanding user’s interest and their relationship in navigation is more important. For this along with statistical analysis data mining techniques is to be applied in web log data. In this paper, proposed a method to analyze web logs in detail by constructing sessions as Propositional
DAGs Graphs. The PDAGs is used to find the subset of the system and the Boolean function which are used to calculate the interventions of the system. The proposed method takes advantage of both statistical analysis and web usage mining. Patterns are reduced by closed frequent mining for efficient analysis. Web site administrators follow the results and improve their web sites more easily. From the experimental results it is obvious that the proposed method successfully cleans the web log data and helps in identifying the user session.
7. REFERENCES
[1] Akers, S. B. 1978. Binary decision diagrams. IEEE Transactions on Computers 27(6):509—516.
[2] Blum, M.; Chandra, A. K.; and Wegman, M. N. 1980. Equivalence of free boolean graphs can be decided probabilistically in polynomial time. Information Processing Letters 10(2):80–82.
[3] Chitra, S, and Kalpana, B., “A Novel Preprocessing Directed Acyclic Graph Technique for Session Construction”, International Journal of Computer Science and Information Security, Vol. 9 No. 12, Dec 2011.
[4] Cooley, R., Mobasher, B., and Srivastava, J. (1999). “Data preparation for mining World Wide Web browsing patterns”, Knowledge and Information Systems, 1999.
[5] Cooley, R., Mobasher, B., and Srivastava, J., “Web mining:Information and Pattern Discovery on the World Wide Web,”,International conference on Tools with Artificial Intelligence, pages 558-567, Newport Beach, IEEE,1997.
[6] Koichiro Mihara, Masahiro Terabe and Kazuo Hashimoto,” A Novel web usage mining method Mining and Clustering of DAG Access Patterns Considering Page Browsing Time”,2008
[7] Peter I. Hofgesang , “Methodology for Preprocessing and Evaluating the Time Spent on Web Pages”, Proceedings of the IEEE/WIC/ACM International Conference on Web Intelligence ,2006.
[8] Seong Dae Lee, Hyu Chan Park, “Mining Weighted Frequent Patterns from Path Traversals on Weighted Graph “, IJCSNS International Journal of Computer Science and Network Security, VOL.7 No.4, April 2007.
[9] Spilipoulou M.and Mobasher B, Berendt B. “A framework for the Evaluation of Session Reconstruction Heuristics in Web Usage Analysis,” INFORMS Journal on Computing Spring, 2003.
[10]Suresh R.M. and Padmajavalli .R “An Overview of Data Preprocessing in Data and Web usage Mining, “IEEE, 2006.
[11]Termier, A., Tamada, Y., Numata, K., Imoto, S.,Washio, T., and Higuchi, T. (2007). DIGDAG, a first algorithm to mine closed frequent embedded sub-DAGs. In The 5th International Workshop on Mining and Learning with Graphs (MLG ’07).
[12]WANG Tong,HE Pi-Lian”Find Duration Time Maximal Frequent Traversal Sequence on Web Sites”, IEEE International Conference On Control and Automation , 2007.
0 100000 200000 300000 400000 500000 600000 700000 800000 900000 1000000
Sample 1 Sample 2 Sample 3 Sample 4
Tim
e
Ta
k
en
(S
ec
o
n
d
s)
Number of Records before Cleaning
[13]Yan Li, Boqin FENG and Qinjiao MAO, “Research on Path Completion Technique in Web Usage Mining”, International Symposium on Computer Science and Computational Technology, IEEE, 2008.
[14]Yan Li and Boqin FENG “The Construction of Transactions for Web Usage Mining”, International Conference on Computational Intelligence and Natural Computing, IEEE, 2009.
[15]Etminani, K., Delui, A.R., Yanehsari, N.R. and Rouhani, M., "Web Usage Mining: Discovery of the Users' Navigational Patterns Using SOM", First International Conference on Networked Digital Technologies, Pp.224-249, 2009.
[16]Nina, S.P., Rahman, M., Bhuiyan, K.I. and Ahmed, K., "Pattern Discovery of Web Usage Mining", International Conference on Computer Technology and Development, Vol. 1, Pp.499-503, 2009.
[17]Chu-Hui Lee and Yu-Hsiang Fu, "Web Usage Mining Based on Clustering of Browsing Features", Eighth International Conference on Intelligent Systems Design and Applications, Vol. 1, Pp. 281-286, 2008.
[18]Bamshad Mobasher “Data Mining for Web Personalization,”, LCNS, Springer-Verleg Berlin Heidelberg, 2007.
[19]Whittaker, J.(1990) Graphical Models in Applied Multivariate Statistics Wiley, NJ.
[20]Cochran, W.G. (1938). The omission or addition of an independent variate in multiple linear regression. JRSS Supplement, 5, pp. 171-176.
[21]Richard Son, T.(1996). A discovery algorithm for directed cyclic graphs. Uncertainty in Artificial intelligence, proceeding, 12th conference, Morgan Kaufman, CA.
[22]Theint Theint Aye. 2011. Web Log Cleaning for Mining of Web Usage Patterns IEEE
AUTHORS PROFILE
Mrs. S. Chitra is an Assistant Professor of Computer Science in Government Arts College, Coimbatore. She received her Masters’ degree in Computer Science from Avinashilingam University, Coimbatore. She has around 15 years of teaching experience at the post graduate and under graduate levels. Presently she is a Ph.D research scholar in Avinashilingam University. Her areas of interest are Data Mining and Web Mining. She is a life member of The Indian Science Congress Association, Kolkata.