R E S E A R C H A R T I C L E
Open Access
Agrimonia pilosa
Ledeb. aqueous extract
improves impaired glucose tolerance in
high-fat diet-fed rats by decreasing the
inflammatory response
Hwan Hee Jang
1, Song Yee Nam
1, Mi Ju Kim
1, Jung Bong Kim
1, Jeong Sook Choi
1, Haeng Ran Kim
1and Young Min Lee
2*Abstract
Background:Agrimonia pilosaLedeb. is a medicinal plant with physiological activities such as anti-cancer, antioxidant, anti-inflammatory activities and in vitro anti-diabetic activity. However, the effects of aqueous extracts fromA. pilosaon insulin-resistant rats have not yet been examined. We investigated the effects of aqueous extract fromA. pilosaon impaired glucose metabolism induced by a high-fat diet in rats.
Methods:Male Sprague-Dawley rats were assigned to the following groups: normal-fat diet (NF,n= 9); high-fat diet (HF,n= 9); high-fat diet with 0.1%A. pilosaaqueous extract (HFA,n= 10). Experimental diets were administered for 16 weeks. At the end of the treatment, liver and fat tissues were isolated, and serum was collected for biochemical analysis.
Results:The HF group rats had a significantly higher liver weight than the NF group rats did, and increased hepatic lipid accumulation (p< 0.05); however, supplementation withA. pilosadecreased liver weight. Blood glucose levels in the HFA group were lower than levels measured in the HF group 30, 60, and 120 min after glucose administration (p< 0.05). In addition, dietaryA. pilosasupplementation decreased tumor necrosis factorαand interleukin 6 levels, while increasing serum adiponectin concentrations (p< 0.05 vs. the HF group). These effects were accompanied by reduced hepatic and adipose tissue expression of inflammation-related genes such asTnfandIl1b(p< 0.05).
Conclusions:Our findings indicate thatA. pilosaaqueous extract can ameliorate insulin resistance in high-fat diet-fed rats by decreasing the inflammatory response.
Keywords:Agrimonia Pilosa, Glucose tolerance, High-fat diet, Inflammation, Obesity
Background
The incidence of obesity has risen dramatically during the past 50 years. In Korea, obesity (defined as having a body mass index greater than 25 kg/m2) is prevalent in 32.9% of the adult population [1]. Obesity affects adults and children worldwide, and its recent dramatic increase has been caused by decreased energy expenditure and increased energy intake.
Excessive calorie intake usually causes obesity, glucose intolerance, and insulin resistance [2]. Insulin resistance is defined as a decreased sensitivity of the peripheral tissues to insulin action [3]; it increases the risk of car-diovascular disease, type 2 diabetes, hypertension, and nonalcoholic fatty liver disease (NAFLD) [4]. Insulin re-sistance is also known to cause a metabolic syndrome, which manifests as steatosis in hepatic tissue [5].
NAFLD has been defined as the accumulation of he-patic lipid not due to excess alcohol consumption. It en-compasses a spectrum of disorders, ranging from hepatic steatosis to nonalcoholic steatohepatitis (NASH), cirrhosis, and hepatocellular carcinoma [6]. Although * Correspondence:[email protected]
2Division of Applied Food System, Major of Food and Nutrition, Seoul
Women’s University, Seoul 01797, South Korea
Full list of author information is available at the end of the article
NAFLD per se may be a benign process, it can progress to inflammatory liver disease. Its high prevalence and contribution to causes of death are also an important issue for management of life expectancy [7]. Therefore, NAFLD should be diagnosed and regulated early, before it progresses.
It is now well-established that insulin resistance-related metabolic syndrome and NAFLD are associated with a chronic inflammatory response, also termed metaflammation [8]. Chronic low-grade inflammation is characterised by the increased production of inflamma-tory adipose tissue-specific secreinflamma-tory proteins (adipo-kines), such as tumor necrosis factor (TNF) α and interleukin (IL) 6, contributing to glucose intolerance and insulin resistance. Unlike levels of other adipokines, those of adiponectin (also known as Acrp30, AdipoQ, and GBP28) decrease in obesity-induced metabolic dis-orders, including insulin resistance [9].
Agrimonia pilosaLedeb. is a medicinal plant known to exert anti-cancer [10] and antioxidant [11] effects, acetyl-cholinesterase inhibition [12], and anti-inflammatory activities [13, 14]. Our previous study indicated that A. pilosaextracts improved the free fatty acid-induced insu-lin resistance in C2C12 myotubes [15]. However, the effects of aqueous extracts from A. pilosa on insulin-resistant rats have not yet been examined. The purpose of this study was to investigate the effects ofA. pilosa aque-ous extract on insulin resistance induced by a high-fat diet (HFD) in rats.
We used HFD to establish glucose intolerance, and in-vestigated the effects of A. pilosa treatment on glucose tolerance and the potential underlying molecular mechanisms.
Methods
Plant material and extraction
The aerial parts of A. pilosa were purchased from the Gokseong Agricultural Association (Jeollanam-do, Korea) in 2011 as dried form and identified by the Classi-fication and IdentiClassi-fication Committee of the Korea Insti-tute of Oriental Medicine (KIOM). A voucher specimen (KIOM109-122Aa) was kept in the herbarium of the Department of Herbal Resources Research of the KIOM. Dried A. pilosa was extracted twice with 10 volumes of water at 80 °C for 3 h. The extracts were filtered through No. 6 filter paper (Whatman, Maidstone, UK) and were concentrated under reduced pressure by a rotary evapor-ator (EYELA, Tokyo, Japan) at 40 °C. The water filtrates were frozen and lyophilised (Ilshin Lab). The final lyophi-lised extracts were stored at−20 °C until use.
Animals and diets
Seven-week-old male Sprague-Dawley (SD) rats with an average weight of 271.9 ± 8.7 g were purchased from
Orient Bio Co. Ltd. (Seongnam, Korea). All rats were housed individually in plexiglass cages and maintained in an air-conditioned room at 22 ± 2 °C under an auto-matic lighting schedule. To help with adaptation to the laboratory conditions, the rats were fed a standard pellet diet with free water for the first week prior to the experi-ment. After the acclimation period, the rats were ran-domly blocked into three groups (n= 10 per group) with similar mean body weights. The rats were assigned to the following groups: Normal-fat diet (NF); HFD (HF, 36% of energy as fat); HFD with 0.1% A. pilosa aqueous extract (HFA). These experimental diets were main-tained for 16 weeks. The composition of the experimen-tal diets is shown in Additional file 1. This experimenexperimen-tal design was approved by the Institutional Animal Care and Use Committee (IACUC) of the National Academy of Agricultural Science (reference number: NAAS-1203).
Preparation of blood and tissue samples
On the last day of the experiment, after fasting for 16 h, all rats were anesthetized with CO2and blood was col-lected via the heart. The colcol-lected blood was kept in cold water for approximately 30 min, and the serum was separated by centrifugation at 3000 rpm for 20 min at 4 °C. After cutting the abdomen open, small pieces of liver and fat tissues were rapidly excised and frozen im-mediately in liquid nitrogen for Real-time quantitative reverse transcription PCR. The liver and fat tissues were removed, rinsed with cold phosphate-buffered saline, and weighed. Hepatic sections for histological evaluation were stored in 10% buffered neutral formalin. The resi-due was frozen immediately in liquid nitrogen and stored–in a−70 °C freezer.
Oral glucose tolerance test (OGTT)
Rats were subjected to an overnight fast for 16 h before the OGTT. The baseline glucose level was measured by OneTouch Ultra Glucose Monitoring System (Johnson & Johnson Medical, New Brunswick, NJ, USA). The 75% glucose solution (2 g/kg b.w.) was orally injected, and serum glucose in the blood sample from the tail vein was estimated by a glucometer at 0, 30, 60, and 120 min. Assays were carried out in triplicate (n= 10). The area under the curve (AUC) was also calculated.
Blood biochemical assays
duplicate (n= 10). The homeostasis model assessment of insulin resistance (HOMA-IR) was obtained by the calcula-tion (HOMA-IR = glucose (mg/dL) × insulin (mU/L)/405).
Liver histology
Liver tissue was fixed with 10% neutral buffered formalin and embedded in paraffin. Sections were cut and stained with Oil red O staining. Images were captured using an Olympus AX 70 camera (Center Valley, PA, USA). The initial assessment was performed under low magnifica-tion (40 × to 200 ×), and confirmed under high magnifi-cation (400 ×). Hepatic steatosis was graded as 0 (fatty hepatocytes occupying < 5%), 1 (fatty hepatocytes occu-pying 5–33%), 2 (fatty hepatocytes occupying 34–66%), or 3 (fatty hepatocytes occupying > 66%) according to the percentage of hepatic lipid [16].
Real-time quantitative reverse transcription PCR
Total RNA was isolated from liver and fat tissues using the RNeasy Microarray Tissue Kit (Qiagen, Valencia, CA, USA), and RNA integrity (RIN > 9.0) was assessed using a Bioanalyzer 2100 (Agilent Technologies, Santa Clara, CA, USA). The Rat Fatty Liver PCR array and In-sulin Resistance PCR array (SABiosciences, Frederick, MD, USA) were used to profile the genes differentially expressed in liver and fat tissue, respectively, according to the manufacturer’s instructions. The complete list of genes assayed on the array is provided on the manufac-turer’s website (http://www.sabiosciences.com/Metabo-lic_Diseases.php). For each plate, 0.5 μg of RNA was converted to double-stranded cDNA using the RT2first strand synthesis kit (Qiagen). After mixing this with the SABiosciences RT2qPCR master mix, the cDNA was pi-petted into the 96-well profile plate and amplified on CFX96TM Real-Time PCR Detection System Bio-Rad Laboratories (Hercules, CA, USA). Data were normal-ised using lactate dehydrogenase A as an endogenous control, and fold-changes in expression were calculated using SABiosciences online software (http://pcrdataana lysis.sabiosciences.com/pcr/arrayanalysis.php).
Statistical analysis
Data were expressed as mean ± standard error (S.E.). Sta-tistical comparisons were performed by one-way ANOVA followed by Duncan’s multiple range test. Values were considered statistically significant whenp< 0.05.
Results
Effects on body weight, food intake, and organ weight
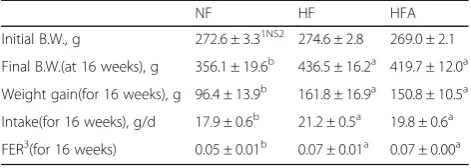
Body weight, food intake, and food efficiency ratio (FER) are presented in Table 1. The experimental groups were rearranged by initial body weight (between 269.0 g and 274.6 g) before HFD feeding began. After 16 weeks on the assigned diets, the weight of rats in the HFD groups
was significantly different from the weights of the NF group rats. However, the HFA group rats showed a slight loss compared to that reported for the HF group rats. Although intake was significantly different in the HFD groups, the HFA and HF groups were similar. In addition, the FER did not differ significantly between the HF and HFA groups throughout the experimental period.
Table 2 outlines liver and epididymal fat tissue weight in the rats. The HF group rats showed significant in-creases in liver and epididymal adipose weights com-pared to that reported for the NF group rats. However, supplementation of A. pilosa aqueous extract decreased liver weight significantly. Although there was no statis-tical significance, the HFA group rats showed a tendency of reduced epididymal adipose weight compared to that reported for the HF group rats.
Serum glucose, insulin, and HOMA-IR
Levels of serum glucose, insulin, and HOMA-IR are shown in Table 3. Glucose levels did not differ signifi-cantly between the experimental groups. Insulin levels increased significantly in the HF group in comparison to that in the NF group. However, A. pilosa supplementa-tion decreased insulin levels in the HFA group signifi-cantly. Consequently, the HOMA-IR in the HFA group was also restored to the levels seen in the NF group.
OGTT findings
[image:3.595.304.540.99.183.2]OGTT results are shown in Fig. 1. After 5 weeks of administering the experimental diets, glucose levels in the HFA group were lower than levels in the HF group 30 min
Table 1Body weight, weight gain, intake and FER of rats
NF HF HFA
Initial B.W., g 272.6 ± 3.31NS2 274.6 ± 2.8 269.0 ± 2.1
Final B.W.(at 16 weeks), g 356.1 ± 19.6b 436.5 ± 16.2a 419.7 ± 12.0a
Weight gain(for 16 weeks), g 96.4 ± 13.9b 161.8 ± 16.9a 150.8 ± 10.5a
Intake(for 16 weeks), g/d 17.9 ± 0.6b 21.2 ± 0.5a 19.8 ± 0.6a
FER3(for 16 weeks) 0.05 ± 0.01b 0.07 ± 0.01a 0.07 ± 0.00a
1 Data are expressed as Mean ± S.E.(n= 9, NF & HF or 10, HFA) 2 Values with different alphabet within the same raw are significantly different atp< 0.05 by Duncan’s multiple range test. NS, not significantly different
[image:3.595.305.540.647.690.2]3 FER: Food efficiency ratio = weight gain(g/day)/food intake(g/day) Abbreviations:NFnormal fat diet,HFhigh fat diet,HFAhigh fat diet with 0.1%Agrimonia pilosawater ext
Table 2The liver and epididymal fat tissue weight of rats
NF HF HFA
Liver, g 10.74 ± 0.641c2 23.1 ± 2.04a 18.42 ± 0.81b
Epididymal fat, g 2.46 ± 0.30b 3.6 ± 0.20a 3.04 ± 0.16ab
1 Data are expressed as Mean ± S.E.(n= 9, NF & HF or 10, HFA)
2 Values with different alphabet within the same raw are significantly different atp< 0.05 by Duncan’s multiple range test
Abbreviations:NFnormal fat diet,HFhigh fat diet,HFAhigh fat diet with 0.1%
after glucose administration. The AUC was not signi-ficantly different between HFD-fed groups. At 15 weeks, glucose levels in the HFA group were lower than levels in the HF group 30, 60, and 120 min after glucose adminis-tration. The AUC decreased significantly as well.
Serum IL-6, TNF-α, and adiponectin
The effect of A. pilosa on serum inflammation related proteins is shown in Table 4. Levels of IL-6 and TNF-α increased significantly in the HF group in comparison to that reported for the NF group. However, the HFA group showed a significant decrease. Adiponectin levels signifi-cantly decreased in the HF group compared with levels in the NF group, but increased approximately two-fold in the HFA group compared to that in the HF group.
Liver histology using oil red O staining
We investigated the suppressive effect ofA. pilosa aque-ous extract on lipid accumulation. Liver sections from the NF group showed a normal architecture (Fig. 2a). However, liver sections from the HF group showed a marked rise in staining within the cytoplasm of hepatocytes, indicating lipid accumulation (Fig. 2b). Lipid accumulation was re-duced byA. pilosatreatment (Fig. 2c). The steatosis grade scores were lower in the HFA group compared to the HF group (Fig. 2d).
Real-time quantitative reverse transcription PCR
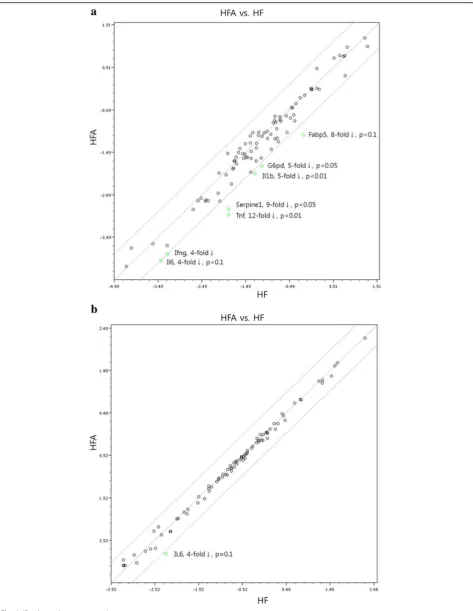
To identify inflammatory genes modulated by A. pilosa, we compared the hepatic gene expression profiles in the HF and HFA groups using the Rat Fatty Liver PCR array (SABiosciences). Quantitative RT-PCR array experiments showed that expression of most genes in the HFA group remained unchanged, by at least a 4-fold margin (Fig. 3a). However,A. pilosatreatment modulated several genes as-sociated with insulin resistance and inflammation. Expres-sion of the genes glucose-6-phosphate dehydrogenase (G6pd), interleukin 1 beta (Il1b), serpin peptidase inhibi-tor, clade E (nexin, plasminogen activator inhibitor type 1 [PAI-1]), member 1 (Serpine1), and tumor necrosis factor (TNF superfamily, member 2) (Tnf) was markedly down-regulated in the HFA group. Although not statistically significant, Fatty acid binding protein 5 (Fabp5)and Inter-leukin 6 (Il6) expression decreased eight-fold and four-fold, respectively, afterA. pilosatreatment, compared with their expression in the HF group (p= 0.10). Suppressor of cytokine signalling 3 (Socs3) was also downregulated three-fold in the HFA group.
[image:4.595.304.540.110.166.2]Expression profiles of genes in epididymal tissue of the HF and HFA groups were investigated using the Rat In-sulin Resistance PCR array (SABiosciences). Expression of the gene encoding IL-6 was significantly downregu-lated in the HFA group (Fig. 3b).
Table 3The effect ofA. pilosaon serum glucose, insulin, and HOMA-IR
NF HF HFA
Glucose, mg/dL 227.1 ± 23.81NS2 215.3 ± 31.9 230.1 ± 15.0
Insulin, ng/mL 3.19 ± 1.52a 8.75 ± 6.55b 4.08 ± 2.17a
HOMA-IR 51.55 ± 24.56a 134.05 ± 100.35b 66.80 ± 35.53a
1 Data are expressed as Mean ± S.E.(n= 9, NF & HF or 10, HFA)
2 Values with different alphabet within the same raw are significantly different atp< 0.05 by Duncan’s multiple range test. NS, not significantly different
Abbreviations:NFnormal fat diet,HFhigh fat diet,HFAhigh fat diet with 0.1%
A. pilosawater ext
Fig. 1Oral glucose tolerance test at (a) 5 and (b) 15 weeks. Data are expressed as Mean ± S.E. (n= 9–10). Abbreviations: NF, normal-fat diet; HF,
[image:4.595.56.292.110.167.2]high-fat diet; HFA, high-fat diet with 0.1%Agrimonia pilosaaqueous extract. Values with different letters are significantly different (p< 0.05) by Duncan’s multiple range test
Table 4The effect ofA. pilosaon serum IL-6, TNF-α, and adiponectin
NF HF HFA
IL-6, pg/mL 18.1 ± 8.91b2 32.8 ± 17.5a 17.7 ± 9.8b
TNF-α, pg/mL 12.3 ± 5.8b 37.1 ± 21.7a 14.3 ± 5.1b
Adiponectin,μg/mL 153.9 ± 19.4a 49.6 ± 4.5c 96.7 ± 15.5b
1 Data are expressed as Mean ± S.E.(n= 9, NF & HF or 10, HFA)
2 Values with different alphabet within the same raw are significantly different atp< 0.05 by Duncan’s multiple range test
Abbreviations:NFnormal fat diet,HFhigh fat diet,HFAhigh fat diet with 0.1%
[image:4.595.58.540.546.696.2]Discussion
The present study was performed to investigate the effects of aqueous extract from A. pilosa on impaired glucose metabolism induced by HFD in rats. In the present study, the HF group rats had significantly higher body and liver weight, hepatic steatosis, impaired glu-cose tolerance, and increased insulin resistance com-pared to that reported for the NF group rats (p< 0.05). Inflammation in hepatic and adipose tissues was also in-duced by the HFD.
Excess calorie intake increases body weight and adipose tissue weight. Nutrient excess causes adipocyte signalling that results in inflammatory responses [17]. In mice, obese adipose tissue secretes inflammatory cytokines, TNF-α, and IL-6 [18]. In obese or HFD-fed mice, the macrophage population also increases in adipose tissues compared to that in lean controls, leading to increased cytokine expres-sion [19]. These obesity-induced inflammatory responses may affect not only adipose tissue but important target organs, such as the liver, as well.
Obesity or HFD increases free fatty acid supply to the liver, resulting in a fatty liver and leading to hepatic in-flammation through NF-κB activation and cytokine
production [20]. Obese liver tissue shows an increased inflammatory cytokine expression. Although the liver is not infiltrated by macrophages in obesity-induced in-flammation, hepatic inflammation is activated in macrophage-like Kupffer cells within the liver [21].
These inflammatory signals in adipose and hepatic tissues can activate c-jun N-terminal kinase (JNK) and inhibitor of κ kinase (IKK). These kinases may target insulin receptor substrate 1 (IRS-1) for serine phosphor-ylation, leading to inhibition of the insulin receptor signalling cascade. In the present study, the HF group showed higher adipose and liver weight, inflammation, and insulin resistance, which was confirmed by the OGTT and HOMA-IR.
However, supplementation with A. pilosa aqueous ex-tract significantly decreased liver weight and serum inflam-matory cytokine (TNF-αand IL-6) levels, while increasing the levels of the anti-inflammatory cytokine adiponectin.
A. pilosa aqueous extract also reduced the expression of hepatic insulin resistance-related genes and hepatic and adipose tissue inflammation-related genes. These effects improved glucose tolerance and lowered insulin resistance in the HFA group (p< 0.05 vs. the HF group).
a
b
c
d
Fig. 2Effect ofA. pilosaon hepatic steatosis in rats fed a high-fat diet. Photomicrographs of Oil red O-stained liver samples from representative
[image:5.595.59.537.87.379.2]Adiponectin is an anti-inflammatory adipocytokine produced in adipose tissue. Kim et al. demonstrated that chronic overexpression of adipose tissue adiponectin de-creased circulating IL-6 and TNF-α levels and reduced hepatic fat content, ameliorating insulin resistance [22]. Therefore, production of adiponectin may play a role in preventing local and systemic inflammation [23].
In our quantitative RT-PCR array experiments, expres-sion of hepaticG6PD, which has been reported to be as-sociated with insulin resistance [24], markedly decreased in the HFA group.Serpine1encodes PAI-1, and elevated serum PAI-1 levels are strongly correlated with insulin resistance and liver steatosis [25]. As PAI-1 expression is regulated by pro-inflammatory cytokines, this is in ac-cordance with our findings, whereIl1b andTnf expres-sion was markedly downregulated in the HFA group.
Socs3 expression was also downregulated in the HFA group, although not to a statistically significant extent.
Socs3 has been reported to be highly expressed in the obese liver, and to bind to the insulin receptor, inducing insulin resistance [26]. Collino et al. [27] reported that pioglitazone administration reduced hepatic inflamma-tory responses in rats fed a high-cholesterol fructose diet for 15 weeks, and that reduced hepaticSocs3expression was linked to a significant improvement in insulin resist-ance. Expression of the gene encoding IL-6 significantly decreased in the epididymal tissue of the HFA group. These results indicate that A. pilosa protected against HFD-induced insulin resistance by reducing the inflam-matory response.
A. pilosa has been reported to exert nitric oxide-scavenging effects in lipopolysaccharide-stimulated RAW264.7 macrophages [13]. Although few previous reports have characterised the chemical components of
A. pilosa, polyphenolic components such as flavonoids have been found [12, 28, 29]. In our previous study, flavonoids found in A. pilosa extract include apigenin glucuronide (21.81%), apigenin hexose (19.46%), and luteolin glucuronide (13.03%) [30]. The different mo-lecular targets of dietary polyphenols, including apigenin and luteolin, and their anti-inflammatory effects have been well-reviewed [31]. It is expected that the positive effects ofA. pilosasupplementation on insulin resistance can likely be attributed to these flavonoids, such as api-genin and luteolin, within A. pilosa. Further investi-gations to isolate and characterize the single compound ofA. pilosaare needed.
These results suggest thatA. pilosa is a healthful food for human that may potentially be used to treat obesity-related insulin resistance and metabolic syndrome. Al-though A. pilosais edible wild plant, there is an urgent need for research to investigate the impact on human health due to the metabolic and cellular differences be-tween rats and humans and difficulties to accurately ex-trapolate animal’s results to humans.
Conclusions
The results of the present study indicate that A. pilosa
prevents inflammatory signaling and may ameliorate im-paired glucose tolerance in HFD-fed rats.A. pilosamay potentially be used to treat obesity-related insulin resist-ance and metabolic syndrome.
Additional file
Additional file 1: Table S1.Composition of experimental diets (g/kg diet).
(DOCX 15 kb)
Abbreviations
AUC:Area under the curve; HF: High-fat diet-fed group; HFA: High-fat and Agrimonia pilosaaqueous extract-fed group; HFD: High-fat diet; HOMA-IR: Homeostasis model assessment of insulin resistance; IL: Interleukin; NAFLD: Nonalcoholic fatty liver disease; NASH: Nonalcoholic steatohepatitis; NF: Normal-fat diet-fed group; OGTT: Oral glucose tolerance test; PAI-1: Plasminogen activator inhibitor type 1; TNF: Tumor necrosis factor
Acknowledgements
Not applicable.
Funding
This study was supported by a research project of the National Institute of Agricultural Science of the Rural Development Administration, Republic of Korea (project no. PJ01178701), and by a young researchers grant (to YML) from Seoul Women’s University (2015).
Availability of data and materials
All data generated or analysed during this study are included in this published article [and its Additional file].
Authors’contributions
HHJ performed the experiments and analysed the data; SYC and MJK conducted the animal experiments and analysed the data; JBK, JSC, and HRK participated in data interpretation and reviewed the manuscript; YML contributed to study design and wrote the manuscript. All authors read and approved the final manuscript.
Ethics approval and consent to participate
This experimental design was approved by the Institutional Animal Care and Use Committee (IACUC) of the National Academy of Agricultural Science (reference number: NAAS-1203).
(See figure on previous page.)
Fig. 3Focused quantitative RT-PCR analysis of hepatic (a) and adipose (b) tissues (n= 4). Abbreviations: NF, normal-fat diet; HF, high-fat
Consent for publication
Not applicable.
Competing interests
The authors declare that they have no competing interests.
Publisher’s Note
Springer Nature remains neutral with regard to jurisdictional claims in published maps and institutional affiliations.
Author details 1
Functional Food & Nutrition Division, National Institute of Agricultural Sciences, Rural Development Administration, Wanju 55365, Republic of Korea. 2Division of Applied Food System, Major of Food and Nutrition, Seoul
Women’s University, Seoul 01797, South Korea.
Received: 23 June 2017 Accepted: 25 August 2017
References
1. Korean Center for Disease Control. 2014 National Health Statistics: Korea National Health and Nutrition Examination Survey. Seoul. 2015. https:// knhanes.cdc.go.kr/knhanes/main.do. Accessed 29 Jun 2016.
2. Kadowaki T, Hara K, Yamauchi T, Terauchi Y, Tobe K, Nagai R. Molecular mechanism of insulin resistance and obesity. Exp Biol Med (Maywood). 2003;228:1111–7.
3. Goldstein BJ. Insulin resistance as the core defect in type 2 diabetes mellitus. Am J Cardiol. 2002;90:3g–10g.
4. Reaven GM. The insulin resistance syndrome: definition and dietary approaches to treatment. Annu Rev Nutr. 2005;25:391–406. 5. Utzschneider KM, Kahn SE. Review: the role of insulin resistance in
nonalcoholic fatty liver disease. J Clin Endocrinol Metab. 2006;91:4753–61. 6. Mulhall BP, Ong JP, Younossi ZM. Non-alcoholic fatty liver disease: an
overview. J Gastroenterol Hepatol. 2002;17:1136–43.
7. Korean National Statistical Office. Annual report on the cause of death statistics. Seoul. 2014. http://kosis.kr/index/index.jsp. Accessed 29 Jun 2016. 8. Shoelson SE, Lee J, Goldfine AB. Inflammation and insulin resistance. J Clin
Invest. 2006;116:1793–801.
9. Kadowaki T, Yamauchi T, Kubota N, Hara K, Ueki K, Tobe K. Adiponectin and adiponectin receptors in insulin resistance, diabetes, and the metabolic syndrome. J Clin Investig. 2006;116:1784.
10. Miyamoto K, Kishi N, Koshiura R. Antitumor effect of agrimoniin, a tannin of Agrimonia pilosaLedeb., on transplantable rodent tumors. Jpn J Pharmacol. 1987;43:187.
11. He C, Ji X, Pan Y, Wang H, Wang K, Liang M, Yang L. Antioxidant activity of alcoholic extract ofAgrimonia pilosaLedeb. Med Chem Res. 2010;19:448–61. 12. Jung M, Park M. Acetylcholinesterase inhibition by flavonoids fromAgrimonia
pilosa. Molecules. 2007;12:2130–9.
13. Taira J, Nanbu H, Ueda K. Nitric oxide-scavenging compounds inAgrimonia pilosaLedeb on LPS-induced RAW264.7 macrophages. Food Chem. 2009;115:1221–7.
14. Jung CH, Kim JH, Park SJ, Kweon DH, Kim SH, Ko SG. Inhibitory effect of Agrimonia pilosaLedeb. On inflammation by suppression of iNOS and ROS production. Immunol Investig. 2010;39:159–70.
15. Kim SM, Lee YM, Kim M-J, Nam S-Y, Kim S-H, Jang H-H. Effects of Agrimonia Pilosa Ledeb. Water extract onα-Glucosidase inhibition and glucose uptake in C2C12 skeletal muscle cells. Korean J Food & Nutr. 2013;26:806–13. 16. Jang H-H, Park M-Y, Kim H-W, Lee Y-M, Hwang K-A, Park J-H, Park D-S, Kwon
O. Black rice (Oryza Sativa L.) extract attenuates hepatic steatosis in C57BL/6 J mice fed a high-fat diet via fatty acid oxidation. Nutri & Metab. 2012;9:27. 17. Gregor MF, Hotamisligil GS. Inflammatory mechanisms in obesity. Annu Rev
Immunol. 2011;29:415–45.
18. Hotamisligil GS, Arner P, Caro JF, Atkinson RL, Spiegelman BM. Increased adipose tissue expression of tumor necrosis factor alpha in human obesity and insulin resistance. J Clin Invest. 1995;95:2409.
19. Weisberg SP, McCann D, Desai M, Rosenbaum M, Leibel RL, Ferrante AW. Obesity is associated with macrophage accumulation in adipose tissue. J Clin Invest. 2003;112:1796–808.
20. Cai D, Yuan M, Frantz DF, Melendez PA, Hansen L, Lee J, Shoelson SE. Local and systemic insulin resistance resulting from hepatic activation of IKK-β and NF-κB. Nat Med. 2005;11:183–90.
21. Baffy G. Kupffer cells in non-alcoholic fatty liver disease: the emerging view. J Hepatol. 2009;51:212–23.
22. Kim J-Y, van de Wall E, Laplante M, Azzara A, Trujillo ME, Hofmann SM, Schraw T, Durand JL, Li H, Li G. Obesity-associated improvements in metabolic profile through expansion of adipose tissue. J Clin Invest. 2007;117:2621–37. 23. Tilg H, Hotamisligil GS. Nonalcoholic fatty liver disease: cytokine-adipokine
interplay and regulation of insulin resistance. Gastroenterol. 2006;131:934–45. 24. Park J, Rho HK, Kim KH, Choe SS, Lee YS, Kim JB. Overexpression of
glucose-6-phosphate dehydrogenase is associated with lipid dysregulation and insulin resistance in obesity. Mol Cell Biol. 2005;25:5146–57.
25. Juhan-Vague I, Alessi MC, Mavri A, Morange P. Plasminogen activator inhibitor-1, inflammation, obesity, insulin resistance and vascular risk. J Thromb Haemostasis. 2003;1:1575–9.
26. Ueki K, Kondo T, Kahn CR. Suppressor of cytokine signalling 1 (SOCS-1) and SOCS-3 cause insulin resistance through inhibition of tyrosine phosphorylation of insulin receptor substrate proteins by discrete mechanisms. Mol Cell Biol. 2004;24:5434–46.
27. Collino M, Aragno M, Castiglia S, Miglio G, Tomasinelli C, Boccuzzi G, Thiemermann C, Fantozzi R. Pioglitazone improves lipid and insulin levels in overweight rats on a high cholesterol and fructose diet by decreasing hepatic inflammation. Brit J Pharmacol. 2010;160:1892–902.
28. Xu X, Qi X, Wang W, Chen G. Separation and determination of flavonoids in Agrimonia pilosaLedeb. By capillary electrophoresis with electrochemical detection. J Sep Sci. 2005;28:647–52.
29. Miyamoto K, Koshiura R, Ikeya Y, Taguchi H. Isolation of agrimoniin, an antitumor constituent, from the roots ofAgrimonia pilosaLedeb. Chem Pharm Bull. 1985;33:3977–81.
30. Lee YM, Kim JB, Bae JH, Lee JS, Kim PS, Jang HH, Kim HR. Estrogen-like activity of aqueous extract fromAgrimonia pilosaLedeb. In MCF-7 cells. BMC Complement Altern Med. 2012;12:260.
31. Yoon J-H, Baek SJ. Molecular targets of dietary polyphenols with anti-inflammatory properties. Yonsei Med J. 2005;46:585–96.
• We accept pre-submission inquiries
• Our selector tool helps you to find the most relevant journal • We provide round the clock customer support
• Convenient online submission • Thorough peer review
• Inclusion in PubMed and all major indexing services • Maximum visibility for your research
Submit your manuscript at www.biomedcentral.com/submit