16
Facial Expression Recognition by Statistical, Spatial
Features and using Decision Tree
Nazil Perveen
Assistant Professor CSIT Department GGV BIlaspur, Chhattisgarh
India
Darshan Kumar
Assistant Professor Electronics (ECE) Department JECRC Jaipur, Rajasthan India
IshanBhardwaj
Student of Ph.D. Electrical Department NIT Raipur, Chhattisgarh India
ABSTRACT
Facial Expression reflects the emotional stage of the person. Sensing and responding appropriately to the user’s emotional state is one of the most powerful, natural and abrupt means, which have the capability to enrich man-machine interaction and to regulate inter-personal behavior. In this paper we apply a novel technique to recognize different expression effectively using classification and regression trees (CART). Firstly, we compute spatial features of the face which provide 73.66% correct classification rate. Secondly, we compute statistical features of the face which provide 79.4%. In last we merge both features in order to increase accuracy and classification rate increases to 83.4%. The proposed technique is tested using JAFFE database and implemented in MATLAB environment 7.0.
General Terms
Pattern Recognition.
Keywords
CART, Facial expression recognition, Rule extraction, Spatial features and Statistical features.
1.
INTRODUCTION
Over the last decade significant effort are being made in developing the methods for facial expression recognition. Facial expression is produced by the activation of facial muscles, which are triggered by the nerve impulses. There are basic seven facial expressions neutral, happy, surprise, fear, sad, angry and disgust, postulated by Paul Ekman and Wallace V. Friesen [1]. These six basic facial expressions are needed to be recognized so that, it will be boon to different research areas. Facial expression recognition has wide variety of applications, such as, to develop the friendly man-machine interface to enable the systemto have communication analogous to man-to-man communication, behavioral science, clinical studies, psychological treatment, video conferencing and many more. Facial expression play important role in cognition of human emotions and facial expression recognition is base of emotions understanding [2]. Human facial expression contains abundant information of human’s behavior and can further reflect human’s corresponding mental state. As human face plays a crucial role in interpersonal communication, facial expression analysis is active in the fields of affective computing and intelligent interaction.
2.
LITERATURE REVIEW
In 1971, Ekman and Freisen defined six basic facial expressions and devised FACS- Facial Action Coding System [1]. In FACS, facial expression analysis is done through standardized coding in-order to reflect different facial
movements. Among 46 Action units (AU) that show the basic movement of facial muscles, 16 AU’s are results due to the movement of cheek, chin and wrinkles and 30 AU’s are directly associated with movement of eyes, eyebrows and mouth [3]. Over the 90’s different researches have been proposed, for example [4]-[10] and the references there in. According to Mehrabian [11], the verbal part (i.e. spoken words) of a message contributes only 7% effect in communication of any message; the voice information contributes for 38% while facial expression contributed for 55% effect in communication of any message. Hence, facial expression play important role in cognition of human emotions and facial expression recognition and emotion understanding [12].
Several techniques had been proposed to devise facial expression classification using neural network. In 2007, Tai and Chung[13] proposed automatic facial expression recognition system using ‘Elman neural network’ with accuracy in recognition rate is 84.7%, in which they extracted the features using canthi detection technique. In 1999, Chen and Chang [14] proposed facial expression recognition system using ‘Radial Basis Function and Multi-Layer Perceptron’ with accuracy in recognition rate is 92.1% in which they extracted the facial characteristic points of the 3 organs. In 2004, Ma and Khorasani[15] proposed facial expression recognition system using ‘Constructive Fees Forward Neural Networks’ with accuracy in recognition rate is 93.75%. In 2011, Chaiyasit, Philmoltares and Saranya[16] proposed facial expression recognition system using ‘Multilayer Perceptron with the Back-Propagation Algorithm’ with the recognition rate 95.24%, in which they implements graph based facial feature extraction.
3.
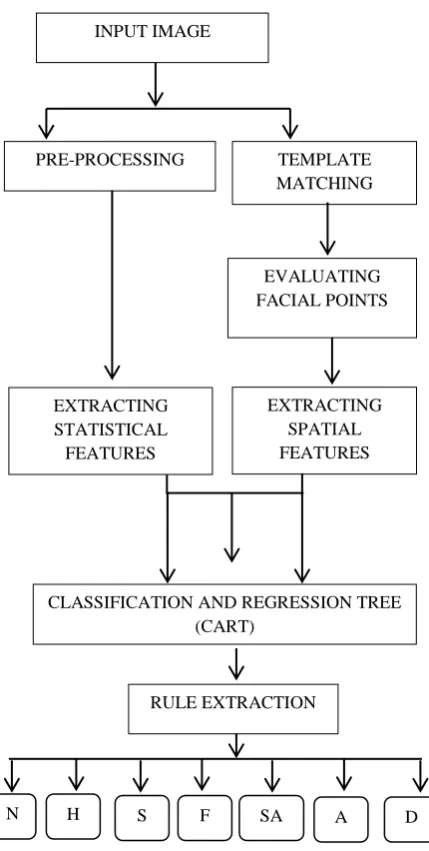
PROPOSED METHODOLOGY
Fig. 1.Schematic Diagram of the Proposed Research work
4.
IMPLEMENTATION
4.1
Pre-processing
Pre-processing is the initial stage in-order to extract the statistical feature. During pre-processing region of interest is obtain because not all the section of the image contribute enough information to recognize the expressions. Hence, first step is to crop the images from resolution 256×256 to 161×111. Table 1 shows the results obtained after cropping.
4.2
Extracting Statistical Features
Once the region of useful information is being extracted statistical features namely, kurtosis, skewness, entropy, energy, moment, mean, standard deviation and variance is being evaluated in following manner.
4.2.1.
Mean
There are different ways where, average of the values is calculated in statistics, one of them are mean. Mean is the average where we add up all the values and then divide by the number of values. t is typically denoted by x.
4.2.2. Standard Deviation
The standard deviation σ of a probability distribution is defined as the square root of the variance σ². It is the measure of how spread out the data set from the mean.
Standard deviation (σ) = (1)
PRE-PROCESSING TEMPLATE
MATCHING
EXTRACTING STATISTICAL FEATURES
EVALUATING FACIAL POINTS
EXTRACTING SPATIAL FEATURES
N H S F SA A D
RULE EXTRACTION INPUT IMAGE
CLASSIFICATION AND REGRESSION TREE (CART)
TABLE 1
DEDUCING ROI FROM THE INPUT FACE IMAGES.
Expression Input Images 256×256
ROI Images 161×111
Neutral Face
Happy Face
Surprise Face
Fear Face
Sad Face
Angry Face
[image:2.595.327.547.84.482.2]18 4.2.3. Variance
Variance is the measure of the dispersion of a set of data points around their mean value. It is mathematical expectation of the average squared deviations from the mean.
Variance (σ²) = (2)
4.2.4. Kurtosis
Kurtosis is the degree of peakedness of a distribution, defined as a normalized form of the fourth central moment of a distribution. It is termed as a statistical measure used to describe the distribution of observed data around the mean. Kurtosis= (3)
4.2.5. Skewness’
Skewness is a measure of the degree of asymmetry of a distribution. If the left side of the distribution is more pronounced than right side of the distribution, the function is said to have negative skewness. And reverse, it is positive skewness. If two are equal, it has zero skewness.
Skewness= (4) Were, E is the expected value of the quantity t.
4.2.6. Moment
Moment is a quantitative measure of the shape of set of data points. The ‘second moment’, for example, is widely used and measures the ‘width’ of a set of data points.
= (5) Were, k is the order and in order to calculate central moment its value is 2.
4.2.7. Entropy
Entropy is a measure of uncertainty associated with random variables. Entropy of the gray scale images is a statistical measure of randomness that can be used to characterize the texture of the input image. Entropy is defined as
Entropy= sum (6) 4.2.8. Energy
Energy is also termed as uniformity in Matlab which is also used to characterize the texture of the input image. Energy defined the properties of gray-level co-occurrence matrix. In Matlab, energy is achieved from ‘graycoprops’ function. The ‘graycoprops’ function 4 properties, i.e. ‘Contrast’, ‘Correlation’, ‘Energy’, ‘Homogeneity’. We consider here the 2 properties i.e. ‘Contrast’ and ‘Correlation’ as the variation in the values are obtained in these two parameters.
Were,
Correlation= (7) And
Contrast= (8) Contrast returns a measure of the intensity contrast between a pixel and its neighbor over the whole image. It is 0 for constant image. Whereas correlation returns a measure of how correlated a pixel is to its neighbor over the whole image. It is not a number for the constant image and 1,-1 for a perfectly positively or negatively correlated image.
4.3.
Template Matching.
Template matching is the initial stage of evaluating spatial features which are evaluated using facial points. As, facial expression information are mostly concentrated on facial expression information regions, so the mouth, eye, eyebrows regions are segmented from the facial expression images firstly. These segments are termed as templates whose size is specified in Table 2.
Once the template of the specified size is created the template matching algorithm is run in-order to draw bounding rectangles around the matched templates. These bounding rectangles are used to compute the facial points.
4.3.1.
Template Matching Algorithm.
Once the template according to size specified in Table 2 is created, next step is to match these templates in following manner:
Table 3 defines the template matching of the different components to be matched of different faces. Once the bounding rectangles are drawn around the matched templates facial points for computing spatial features are evaluated.
4.3.2.
Computing Facial Points.
There are in total 30 facial points which are also known as facial characteristic points [17]. Table 4 describes some of the facial point evaluation. In the similar manner calculate all 30 facial points which are spread out over the facial information regions.
4.3.3.
Computing Spatial Features.
The spatial features are being evaluated [18] as follows: Openness of eyes:
((fp7_y-fp5_y) + (fp8_y-fp6_y))/2 (9) Width of eyes:
((fp1_x-fp3_x) + (fp4_x-fp2_x))/2 (10) Height of eyebrows:
((fp19_y-fp1_y) + (fp20_y-fp2_y))/2 (11)
Table 2. Size of image and templates
Image/Template Height(in pixel) Width(in pixel)
Input Image 256 256
Eye Template 15 30
Eyebrow 15 40
Template
Mouth Template 20 45
Step 1: Send the respective image and its template as input to the template matching procedure
Step 2: Convert the image and template into gray scale by using rgb2gray ().
Step 3: Find the convolution of the original image and mean of the template required to be matched
Step 4: Then we find the correlation to get the highest matching of the template in the whole image.
19 Opening of mouth:
(fp26_y - fp25_y) (12) Width of mouth:
(fp24_y – fp23_y) (13) Were,
fp1_x, fp2_x, fp3_x, fp4_x, fp7_y, fp5_y, fp8_y, fp6_y, are the x, y coordinate position of the facial points detected around the eye template. Similarly the facial points fp1_y, fp2_y, fp19_y, fp20_y are the x, y coordinate position detected around the eyebrow template. Facial points fp23_y, fp24_y, fp25_yand fp26_y are the y coordinates of mouth template. After all these facial points are calculated the spatial features openness of eyes, width of eyes, opening of mouth, width of mouth and height of eyebrows are being calculated.
4.4.
Classification and Regression Tree
(CART)
CART was popularized by Breiman, Freidman, Olshen, & Stone in 1984. It is recursive partitioning method, builds classification and regression trees for predicting continuous dependent variables (regression) and categorical predictor variables (classification) [27]. Basically CART can be adapted for two type of problems one for regression type problems, where the attempt to predict values of a continuous variable from one or more continuous or a categorical predictor variables is performed. The next problem is classification problem where values of a categorical dependent variables, like class, group membership etc., from one or more continuous or categorical variables are predicted.
Since these categorical variables are considered in this research hence the research problem is categorized as a classification problem. The main purpose of the analyses is to determine a set of logical split conditions that permit accurate classification of the classes.In general CART create the tree that have binary splits which is based on one variable.. CART process of computing the tree involves four steps:
Step 1: Specifying the criteria for predictive accuracy. Step 2: Selecting splits.
Step 3: determining when to stop splitting. Step 4: Selecting the “right-sized” tree.
Once the right-sized tree start building the calculation of impurity at each node, need a measure of impurity at each node help to decide on how to split a node, or which node to split.This measure should be at maximum when a node is equally dividing amongst all classes and the impurity should zero if the node is all one class. We make use of the function ‘classregtree()’ to find out the best classification tree
[image:4.595.334.552.107.244.2]Now next step is to create the classification tree for all the features evaluated above in separate and merge manner. Based on the classification tree the confusion matrix is created in table 5, 6, and 7. In table 5, the number of expression classified using spatial features specified in equation (9)-(13)
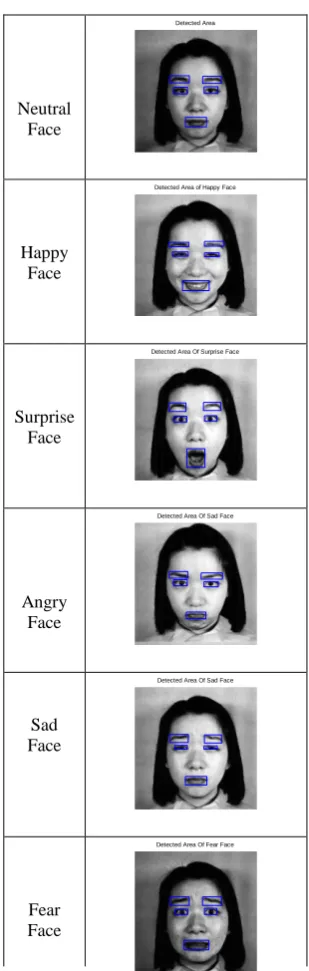
Table 3. Matched Templates
Neutral Face
Happy Face
Surprise Face
Angry Face
Sad Face
Fear Face
Detected Area
Detected Area of Happy Face
Detected Area Of Surprise Face
Detected Area Of Sad Face
Detected Area Of Sad Face
Detected Area Of Fear Face
Table 4. Evaluation of the Facial Points
Region Facial point
X
coordinate Y
coordinate Left eye 1 lle + wle tle + hle*4/5
Right eye 2 lre tre + hre/2
Left eyebrow
17 llb + wlb/2 tlb + hlb/3
Right eyebrow
18 lrb + wrb/2 trb + hrb/2
Mouth 23 lmo tmo + hmo/2
lle, lre, llb, lrb, lmo:- left of left eye, right eye, left eyebrow, right eyebrow, mouth.
wle, wre, wrb, wlb:- width of left eye, right eye, left eyebrow, right eyebrow.
tle, tre, trb, tlb, tmo :- top of left eye, right eye, left eyebrow, right eyebrow, mouth.
[image:4.595.88.243.245.732.2]20 are used to classify the expression. The total numbers of
images considered are 224, i.e. 32 for each seven expression.
In the similar manner Table 6, specified the number of expression classified using the statistical feature defined in equation (1)-(8).
The merge features of the statistical and spatial features are used for classification where, the confusion matrix of expression classified are described in table 7.
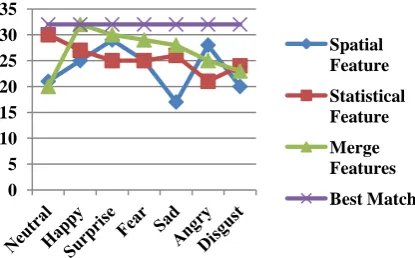
So these are the result obtained from classification by using different features, i.e. spatial, statistical and merge patterns. The accurately classified expressions are in merge pattern with 83.4 %.Figure 2 shows, chart for classified expressions using different features
Fig. 2 Chart for classified expressions using different features.
5.
RULE EXTRACTION.
Classification and regression tree methods are popular method of classification technique, which is easier to understand how CART work and they are having greater accuracies. Rules are very good way of representing the knowledge. Decision tree when become large then it is difficult to interpret, hence we need to transform it into rule to be easier to specify and build the interactive Facial Expression Recognition system. The rule can be extracted using IF-THEN rules. We generally recognized expression using the merge patterns as it produces more accurate results than other. There total 67 rules which are formed to correctly recognize the data, although specifying all rule is not possible here, hence we gives the first 10 rules to classify the expressions.
6.
RESULTS AND CONCLUSION
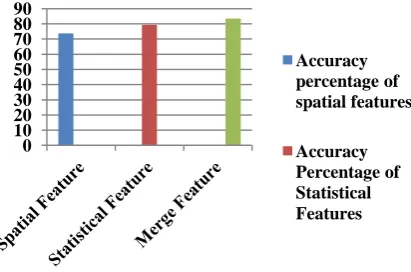
According to the confusion matrices specified in table 5,6 and 7 we can deduce the percentage of classification. Table 8 shows the percentage of accurate classification of each expressions and overall percentage of accurate classification. Hence, the proposed work is a very simple technique to evaluate features namely spatial and statistical technique and merging both the features to obtain more suitable results. Alsothe comparison among all the features is evaluated and the result obtained shows the merged feature are having higher accuracy than other two. The total numbers of JAFFE images consider are 224, i.e. 32 for each seven expression. Figure 3 shows, chart for overall accuracy obtained in different featuresFigure 4 shows the result obtained on testing the face where the correct classification of the surprise face is shown.
0 5 10 15 20 25 30 35
Spatial Feature
Statistical Feature
Merge Features
[image:5.595.59.277.119.211.2]Best Match Table 5. Classified expression using spatial features
Expressions N H S F SA A D
N 21 - 1 7 2 - -
H 2 25 - - 3 - 2
S 1 1 29 1 - - -
F 3 1 2 25 - - 1
SA 1 - 3 2 17 4 5
A 1 - - 1 1 28 1
[image:5.595.57.278.276.368.2]D 2 1 1 1 7 20
Table 6. Classified expression using statistical features
Expressions N H S F SA A D
N 30 - - - 2 - -
H 3 27 - 1 - - 1
S 2 1 25 2 - - 2
F - 1 3 25 2 - 1
SA 2 2 - 2 26 - -
A 2 1 1 2 2 21 3
[image:5.595.58.277.428.520.2]D 2 4 1 1 - - 24
Table 7 Classified expression using merge features
Expressions N H S F SA A D
N 20 1 2 2 6 - 1
H - 32 - - - - -
S 1 30 1 - - - -
F - 1 1 29 1 - -
SA 1 2 1 - 28 - -
A - 3 - - 4 25 -
D - - - 2 4 3 23
Decision tree for classification 1 if x10<20.75 then node 2 else node 3 2 if x11<40.75 then node 4 else node 5 3 if x4<2.44322 then node 6 else node 7 4 if x12<22.8333 then node 8 else node 9 5 if x1<112.741 then node 10 else node 11 6 class = Fear
7 if x2<6.10757 then node 12 else node 13 8 if x7<6.83737 then node 14 else node 15 9 if x7<6.75745 then node 16 else node 17 10 class = Fear.
Were,
x10 is feature value 10, i.e. openness of eyes, eq. (9) x11 is feature value 11, i.e. width of eyes, eq. (10) x4 is feature value 4, i.e. kurtosis of whole face, eq. (9) x12 is feature value 12, i.e. height of eyebrows, eq. (11) x1 is feature value 1, i.e. mean of whole face, eq. (9) x2 is feature value 2, i.e. std. dev. of whole face, eq. (9) x7 is feature value 7, i.e. entropy of whole face, eq. (9)
Table 8 Percentage of accurate classification of each expression
Features-> Spatial Features
Statistical Features
Merge Features Expressions
Neutral 65 93 62.5
Happy 78 84 100
Surprise 90 78 93
Fear 78 78 90
Sad 53 81 87
Angry 87 65 78
Disgust 62 75 71
Overall classification
accuracy
[image:5.595.61.269.592.721.2]Fig. 3Chart for overall accuracy obtained in different features.
7.
FUTURE SCOPE
The proposed work is an ongoing project where different innovative ideas can be explored.Also different statistical features are used in-order to increase its accuracy more than 83.4%. The above procedure may also be applied for different databases other than JAFFE database.
8.
ACKNOWLEDGMENT
We would like to thank Michael J. Lyons, Shigeru Akamatsu,MiyukiKamachi&JiroGyoba [19] to provide the JAFFE database and make our research easier and successful.
9.
REFERENCES
[1] P. Ekman and W. Friesen, Facial Action Coding System, Consulting Psychologists Press, 1977.
[2] Yuwen Wu, Hong Liu, HongbinZha, “Modeling facial expression space for recognition”, National Natural Science Foundation of China (NSFC). Project No: 60175025, P.R.China.
[3] Hiroshi kobayashi, fumiohara.”Recognition of 6 basic facial expressions and their strength by neural network”, IEEE international workshop on Robot and Communication.
[4] F. Kawakami, H. Yamada, S. Morishima and H. Harashima, “Construction and Psychological Evaluation of 3-D Emotion Space,” Biomedical Fuzzy and Human. Sciences, vol.1, no.1, pp.33–42 (1995). 2427.
[5] M. Rosenblum, Y. Yacoob, and L. S. Davis, “Human expression recognition from motion using a radial basis function network architecture,” EEE Trans. on Neural Networks, vol.7, no.5, pp.1121-1138(Sept.1996)C. J. Kaufman, Rocky Mountain Research Lab., Boulder, CO, private communication, May 1995.
[6] M. Pantic and L. J. M. Rothkrantz, “Automatic analysis of facial expressions: the state of the art,” EEE Trans. Pattern Analysis & Machine Intelligence, vol.22, no.12, pp.1424-1445(Dec. 2000).
[7] Y. S. Gao, M. K. H. Leung, S. C. Hui, and M. W. Tananda, “Facial expression recognition from line-based caricature,” EEE Trans. System, Man, & Cybernetics (Part A), vol.33, no.3, pp.407-412(May, 2003).
[8] Y. Xiao, N. P. Chandrasiri, Y. Tadokoro, and M. Oda, “Recognition of facial expressions using 2-D DCT and neural network,” Electronics and Communications in Japan, Part 3, vo.82, no.7, pp.1-11(July, 1999).
[9] L. Ma, K. Khorasani, “Facial expression recognition using constructive feedforward neural networks,” IEEE Trans. System, Man, and Cybernetics (Part B), vol.34, no.4, pp.1588-1595 (2003).
[10]L. Ma, Y. Xiao, K. Khorasani, R. Ward, “A new facial expression recognition technique using 2-D DCT and K-means algorithms,” IEEE
[11]A. Mehrabian, “Communication without words,” Psychology today, volume 2, no.4, pp.53-56, 1968. [12]Yuwen Wu, Hong Liu, HongbinZha, “Modeling facial
expression space for recognition”, National Natural Science Foundation of China (NSFC). Project No: 60175025, P.R.China.
[13]S.C.Tai and K.C.Chung, “ Automatic Facial Expression Recognition using neural network,” EEE 2007.
[14]Jyh-Yeong Chang and Jia-Lin Chen,”Facial Expression Recognition System Using Neural Networks”, 1999 IEEE.
[15]L. Ma and K. Khorasani,” Facial Expression Recognition Using Constructive Feedforward and Neural Networks”, IEEE transactions on systems, man and cybernetics- part B: Cybernetics, vol.34, No. 3, June 2004.
[16]Chaiyasit, Philmoltares and Saranya,” Facial Expression recognition using graph based feature and artificial neural network”,
[17]“Extracting Facial Characteristic Points from expressionless face”, from the book.
[18]Jyh-Yeong Chang and Jia-Lin Chen,” A Facial Expression Recognition System Using Neural Network”, IEEE 1999.
[19] Michael J. Lyons, Shigeru Akamatsu, Miyuki Kamachi, JiroGyoba,”Coding Facial Expressions with Gabor Wavelets”, Third EEE nternational Conference on Automatic Face and Gesture Recognition, April 14-16 1998, Nara Japan, IEEE Computer Society, pp. 200-205.
0 10 20 30 40 50 60 70 80 90
Accuracy percentage of spatial features
Accuracy Percentage of Statistical Features
Fig. 4 Detected Area Of the test face as surprise face.