Munich Personal RePEc Archive
Trust and reciprocity in incentive
contracting
Rigdon, Mary
University of Michigan
May 2005
Online at
https://mpra.ub.uni-muenchen.de/2007/
Trust and Reciprocity in Incentive Contracting
Mary Rigdon∗
Research Center for Group Dynamics Institute for Social Research
University of Michigan Ann Arbor, MI 48104 email: [email protected]
May 15, 2006
“Homer, the key to worker motivation is trust.”
Hank Scorpio, CEO Globex Corporation
“Behold! The greatest breakthrough in labor relations since the cat o’ nine tails.”
C. M. Burns, Owner, Springfield Nuclear Power Plant
Abstract
Principals can attempt to get agents to perform certain actions preferable to the prin-cipal by usingex post punishments or rewards to align incentives. Field data is mixed on whether, and to what extent, such informal incentive contracting (paradoxically) crowds out efficient solutions to the agency problem. This paper explores, via a novel set of laboratory experiments, the impact of ex post incentives on informal contracts between principals and agents in bargaining environments in which there are gains from exchange and when there is an opportunity for the principal to relay a no-cost demand of the di-vision of those gains. Incentive contracting in these environments does not crowd-out off-equilibrium cooperation, and at high incentive levels cooperation is crowded in.
JEL Classification: C91, C70, D63, D81
∗This work has been supported by NSF Grant No. SES-0355425. Thanks are due to James Alt and the
1
Introduction
A key feature of many bilateral bargaining situations is that they involve one party (the
principal) enlisting the other (the agent) to affect some action for a fee. Delegating the
action by trusting the agent is costly to the principal, but there are potential joint gains from
delegating—and it is the agent’s action that determines the distribution of those gains. There
may be many actions open to the agent, and the principal and agent may value the outcomes
of each such action differently. In particular, the action the agent most values may be the
least-valued alternative to the principal. Since there is no guarantee that an agent will take
the principal’s most valued action, a principal can try to get the agent to perform certain
actions and not others by structuring incentives in the right way—i.e., by imposing anex post
punishment or reward. The interesting economic issue is to find out what ways of structuring
incentives are efficient: Should principals try to mitigate the agency problem by appeal to
explicit rewards and punishments, and if so, what size of carrots and sticks work best? Or,
does such explicit incentive contracting (paradoxically) destroy the seemingly robust natural
tendency of agents to reciprocate trusting behavior, crowding cooperation out?
Concrete examples of principal–agent relationships like this are easy to find. One such
example is the interaction between firms and workers. Both parties have an interest in a
workplace in which each trusts the other—the firm, in particular, has an interest in
high-worker productivity with little shirking and low monitoring costs. A second example is in the
interaction between shareholders and CEOs. Notoriously, in recent years shareholders of large
corporations have enlisted CEOs who have chosen actions to the detriment of the company
but have nevertheless reaped lucrative severance packages for themselves. While sometimes
these incentives are pre-committed (e.g., stock options and performance-based incentives in
sports contracts), often they areex post—agents know that some incentive may be enacted,
but whether the principal rewards or punishes is a decision made after the agent performs
the delegated action. This is the standard, for instance, in the distribution of year-end
teachers.1
The presence ofex postincentives on principal–agent relationships—what we might
call “incomplete contracts”—are the focus of this paper.
Although there is field evidence suggesting that carrots and sticks do align incentives
(Yamagishi, 1988; Groves, Hong, McMillan, and Naughton, 1994; Fernie and Metcalf, 1996;
Prendergast, 1999; Lazear, 2000; Fernie and Metcalf, 2000; Ensminger, 2001), there is also
a considerable body of work suggesting that, paradoxically, making incentives explicitly tied
to performanceerodes an agent’s intrinsic motivations with an overall net effect of decreased
efficiency (Deci, 1971; Lepper and Greene, 1978; Deci and Ryan, 1999; Gneezy and
Rusti-chini, 2000a; Benz, Kucher, and Stutzer, 2002). In managerial circles, this is known as the
“Paradox of Organizational Trust” (Barnes, 1981; Kohn, 1993): by showcasing carrots and
sticks, managers signal that they do not trust their employees to perform well on their own,
and this undermines the goal of cooperation. This substitution effect is also known within
economics as “motivation crowding out” (Frey, 1997). With field data, it is difficult to vary
parameters in a systematic way to separate the effects on trust due to incentive schemes, as
most settings have both. The laboratory is useful here since it allows us to systematically
vary the parameters and environments to help illuminate the paradox.
This paper systematically investigates incentive contracting under a novel set of laboratory
conditions. First, I extend the investment game (Berg, Dickhaut, and McCabe, 1995) by
allowing principals to state their (cheap-talk) expectations of the agents, forming a contract
with them. Second, I add anincentive stage to the game during which agents can be either
punished or rewarded, conditional on whether they shirked or fulfilled the terms of the
(cheap-talk) contract. In particular, I consider two kinds of incentive environments: environments
in which principals may punish under-performing agents (P only), and environments in
which principals may reward adequately and over-performing agents (R only). Third, in
the incentive stage, I investigate bothlow incentive environments (with a 1:1 exchange rate
for rewards/punishments) and high incentive environments (with a 1:3 exchange rate for
1
rewards/punishments).2
This set of conditions is importantly different from previous work for at least three
rea-sons. First, there is an existing body of work that systematically investigates the impact
of the availability of punishments and/or rewards in, for example, ultimatum and proposer–
responder games (Andreoni, Harbaugh, and Vesterlund, 2003; B¨uchner, et al., 2003; Gneezy,
2003). Yet there are no gains from exchange in these contexts, and that is an important
feature of the kinds of real-world principal–agent problems we find interesting. Second, much
is known about the impact of cheap-talk in coordination settings and in ultimatum games
(Cooper, et al., 1989, 1992; Clark, et al., 2000; Duffy and Feltovich, 2002; Boles, Croson,
and Murnighan, 2003; Blume and Ortmann, in press).3
However, the issue of how
cheap-talk interacts with both the ability to punish and the ability to reward in trust settings—like
those involving workers and firms where such talk is highly likely to occur—is under-explored.
Third, this is the first paper to investigate how such cheap-talk contracts, in a game with gains
from exchange, and thelevels of both punishments and rewards that are costly interact with
efficient, cooperative behavior.4
This is significant since, in general, it may be easy and cheap
for a principal (e.g., a firm) to impart a significant (relatively speaking) reward or punishment
upon on an agent (e.g., a wage employee).
The most closely related experiments are those testing the role of incentives in an efficiency
wage game (Fehr, G¨achter, and Kirsteiger, 1997; Fehr,et al., 1998; Fehr and G¨achter, 2000b;
Fehr and Fischbacher, 2002). 5
However, there are several key differences between these earlier
experiments and the research reported here. These early experiments were conducted
single-2
The messages sent by principals are, strictly speaking, cheap-talk (in the sense of Crawford and Sobel (1982)) only in the baseline environment defined below—in that environment the messages have no direct payoff implications. However, once we consider environments with the incentive stage, the contents of the messages may have payoff implications since it will be on the basis of the terms in the message that a principal has the opportunity to imposeex post rewards/punishments. But the promises and threats carried by the message will still be incredible. Rather than change what we call the message between the environments, I will stretch standard terminology a little and continue to call such contracts “cheap-talk” contracts throughout.
3
See Crawford (1998) for a review in coordination games.
4
Fehr and Rockenbach (2003) and Fehr and List (2004) experimentally examine how only one level of pre-committedpunishment interacts with transfers and returns in an investment game. Moreover, punishment was costlessto the principal.
5
blind, and there is some experimental evidence suggesting that this procedural difference can
significantly increase cooperation in these settings (Rigdon, 2002). The experiment reported
here was run double-blind; thus any movement toward cooperation induced by changes in
the incentive scheme under these more extreme conditions of social distance is therefore a
comparatively stronger result. Additionally, the earlier experiments do not explore the effects
of changing the relative costs of punishment and reward, which—as the results reported here
suggest—is an important determinant in whether or not cooperation is crowded in. Most
importantly, the efficiency wage game investigations only include a systematic examination of
a strong-reciprocity treatment—bothex postpunishmentand reward are possible—where the
largest benefits to cooperation have been estimated (see Andreoni, Harbaugh, and Vesterlund,
2003). The experiment here, on the other hand, systematically investigates varying levels of
ex post punishment and reward independently, aiming to isolate the effects of each incentive
mechanism on cooperation in environments with incomplete contracts.
The rest of the paper is organized as follows. Section 2 puts forward the implicit and
incentive contracting environments. Section 3 discusses the experimental design and Section
4 presents the results. A significant benefit to studying bilateral bargaining experimentally is
that the control of the laboratory can be marshaled to better understand the gender differences
we see in bargaining situations in the real world. Thus the results section also explores how
incentive contracting may differentially impact male and female principals and agents. Section
5 provides final remarks.
2
Contracting Games
We first consider a simple extension of the investment game (Berg, et al., 1995). The
in-vestment game is a two-person bargaining game, where the principal or Player 1 (P1) is
paired with the agent or Player 2 (P2), and are endowed withM1, M2 (respectively), where
M∗
1 is some investable portion of M1. In the first stage, P1 can send some, all, or none
of M∗
1 (0 ≤ X ≤ M1∗) to P2; any amount sent is multiplied by some factor (growth rate)
(M1−M1∗) + (M1∗−X) +Y and the payoff to P2 isM2+rX−Y. If players are only concerned
about their own material well-being and there is common knowledge of opportunism, then
any amount P2 receives, she will keep. So P1, knowing this, sends $0 dollars. This is the
unique subgame-perfect equilibrium: P1 earnsM1 and P2 earns M2. However, behavior by
P1sandP2s does not match this prediction. In fact, whenM1 =M1∗ =M2= $10 and r= 3,
30 of 32 P1s send money ($5.16 on average) and investments of $5 had an average payback
of $7.17.6
We focus on environments whereM1 = 20, M1∗ = 10, M2= 10, andr = 3. The asymmetry
in endowments between P1 and P2 will give P1 resources for imposing ex post punishments
and rewards in the incentive contracting games defined below.
2.1 Implicit Contracting Game
To more closely resemble our motivating principal-agent situation, the investment game is
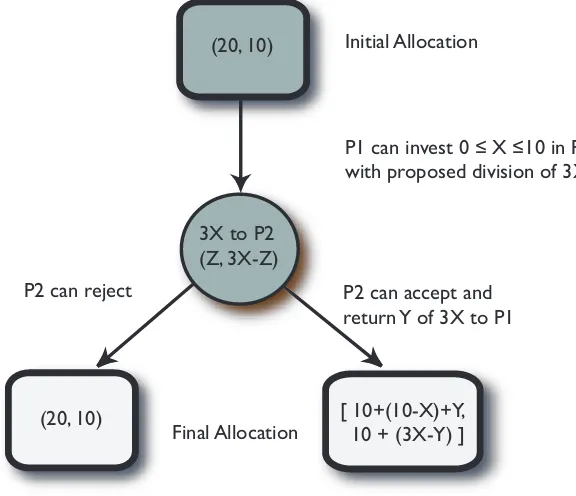
extended in two ways. The resulting environment is the implicit contracting game (Figure
1). First, in addition to specifying an amount X (0 ≤ X ≤ M∗
1) to be invested in P2, P1
proposes a division of the gains from exchange, Z and 3X−Z, where Z is the amount P1
wants returned and 3X−Z is the amount suggested for P2 to keep. In short, the principal
can send a cheap-talk message to the agent. Second, P2 has the opportunity to accept or
reject P1’s transfer and proposed division. If P2 rejects the offered contract, P1 earns 20 and
P2 earns 10 (i.e., the outside option). On the other hand, if P2 accepts the offered contract,
P1’s endowment is decreased by X and P2’s increased by 3X. Then P2 decides on a final
allocation; that is, she selects some amount Y of 3X to return to P1, keeping 10 + 3X−Y
for herself. Note that the actual distribution of the gains from exchange (Y,3X−Y) may
be different from P1’s requested distribution of those gains (Z,3X−Z) signaled in the first
stage. In this game, if P2 does not fulfill the contract, there are no financial consequences
faced by P2.
6
(20, 10)
3X to P2 (Z, 3X-Z)
[ 10+(10-X)+Y, 10 + (3X-Y) ]
Initial Allocation
P1 can invest 0 ≤ X ≤10 in P2, with proposed division of 3X
P2 can accept and return Y of 3X to P1
Final Allocation P2 can reject
[image:8.612.179.467.91.339.2](20, 10)
Figure 1: Implicit Contracting Game
There are two subgame perfect strategy profiles in the implicit contracting game, both
determining the final allocation of $20 for P1 and $10 for P2. If P1 and P2 are utility
maximizers and have a strictly increasing utility for money, then for any value of X 6= 0,
P2 has a dominant strategy to accept the offered contract and keep 3X, returning 0 to P1;
thus a utility maximizing P1, knowing that P2 is also a utility maximizer, will chooseX= 0.
Therefore, P2 is indifferent between accepting and rejecting the offer; in either case, the
outcome will be (20, 10).
This solution is inefficient. This naturally leads to asking how we can do better. When
there are gains to be had from exchange, what mechanism—implicit contracting or incentive
contracting—provides the agent with the greatest incentive to follow through on the contract
with the principal? Is there any evidence for the Paradox of Organizational Trust—does
incentive contracting crowd out cooperation? If carrots and sticks turn out to be more efficient
devices than implicit contracts, does their relative size matter?
2.2 Incentive Contracting Games
An implicit contract is an offered contract of an investment amount X and a proposed
di-vision Z. But the proposed division by P1 is not enforceable, and so P1 performs a purely
trusting action when investing X in P2. P1’s decision of how much to invest in their
coun-terpart determines the gains from exchange, and Z represents how P1 wants those gains to
be redistributed back. However, P1 is unable to either punish or reward P2 for shirking or
meeting the terms of the accepted contract. Incentive contracts, on the other hand, endow P1
with punishment and reward options conditional on P2’s behavior. There are two broad
cat-egories of incentive contracts: those in which the principal only has the enforcement option
of punishing the shirkers (Punish) and those in which the principal only has the
enforce-ment option of rewarding the trustworthy (Reward). For instance, many firms use year-end
bonuses as a reward strategy, and many universities use annual salary raises for both reward
and punishment of faculty—a low raise for punishment and a high raise for rewards.
To implement incentive contracting into the general framework, we add a third stage to
the implicit contracting game. The resulting games—we discuss two kinds—are incentive
contracting games. In the third stage, upon observing P2’s action, P1 can reward or punish
depending on whether or not the action matches the accepted contract.
Rewards are transfers which are either neutral or efficiency enhancing; punishment is
utility reducing to both P1 and P2. P2 chooses an action
ρ=λc
by choosing a value for c where λ is a scalar representing the impact of the incentive and c
(0≤c≤M1−M1∗) is thecost to P1 of enforcing the incentive. In our games,M1−M1∗= 10.
The resources for enacting a punishment/reward is given by the endowment less the investable
portion. Hence, the resources for imposing incentives is independent of the amount invested
by P1 and is independent of the amount returned by P2.
reward if λ is positive, a punishment if it is negative; ρ is a high incentive if |λ| is large, a
low incentive if it is low. We focus on λ taking values from{±1,±3}. When a punishment
or reward is enacted,ρ is added to P2’s final allocation andc is subtracted from P1’s.
In theRewardvariants of the incentive contracting games, P1 has the option of rewarding
P2 if the amount returned is greater than or equal to the request (i.e., if P2 follows through on
the accepted contract: Y ≥Z). The two Rewardgames are Low and High. In Low Reward,
P1 can spend 1 to increase P2’s earnings by 1 (ρ= 1c). In High Reward, P1 can spend 1 to
increase P2’s earnings by 3 (i.e., it is relatively cheap for P1 to reward P2: ρ= 3c).
In thePunishvariants of the incentive contracting game, P1 has the option of punishing
P2 if the amount returned is less than the request (i.e., if P2 deviates from the accepted
contract: Y < Z). Punishment is utility-reducing to both parties. The two Punish games
are Low and High. In Low Punish, P1 can spend $1 to reduce P2’s earnings by $1 (ρ=−1c).
In High Punish, P1 can spend 1 to reduce P2’s earnings by 3 (i.e., it is relatively cheap for
P1 to punish P2: ρ=−3c).
The incentive contracting games provide a mechanism for P1 to align the incentives of
P2. But these mechanisms are costly—if these games are played between utility maximizers
(with the usual common knowledge assumptions) there will be no demand by P1 for either
punishment or reward, the proposed divisions are indeed cheap-talk, and the subgame perfect
equilibria remain unchanged.
The aim here is to see how adding this third stage impacts the cheap-talk messages and
whether it will crowd out or crowd in transfers and returns.
3
Experimental Design and Procedures
The experimental design consists of five treatments: in each treatment subjects play one of the
contracting games. The baseline is the implicit contracting game, orTrust. There are two
low incentive treatments,Low Reward and Low Punish, where there is a $1: $1 exchange
rate for rewards (λ= +1) or punishments (λ=−1). There are two high incentive treatments,
or punishments (λ = −3). The cost of enforcing an incentive mechanism, c, is constrained
by and deducted from P1s $10 show-up fee (i.e., M1 −M1∗). The design is implemented
across-subjects; subjects are randomly allocated to one of the treatments. The goal is to vary
the enforcement device and examine the impact on behavior and efficiency achieved between
principals and agents.
The experiments were run at the Harvard Business School’s Computational Laboratory
for Experimental Research with undergraduate students from universities in the Boston area.7
The sessions were run January 2004 through June 2004. Subjects who had previously
partici-pated in similar experiments were excluded. The participants played the game once and only
once, and this fact was common information. Sessions had twelve to twenty-eight subjects
and took less than 1 hour to complete. Each participant received $10 for showing up on time.
Participants in the role of P1s were allocated an additional $10 for the decision task. The
average earnings were $20.65 for P1s and $22 for P2s, and varied from $1 to $45.
The only difference in the instructions for the treatment conditions was in the description
of the third stage (see Appendices A and B). The instructions for reward (R only) indicated
that if the amount returned was equal or greater than that requested, P1 would have the option
of increasing the earnings of P2; whereas the instructions for punish (P only) indicated that
if the amount returned was strictly lower than that requested, P1 would have the option of
decreasing the earnings of P2.
The experimental protocol for all treatments was double-blind as in Berg, et al. (1995).8
To implement this, subjects drew a blank envelope prior to the start of the experiment
con-taining a code and entered it into their computer. Subjects retrieved their final earnings
anonymously by sliding their envelope containing the code under a door, the experimenter
looked up the code, placed their earnings in the envelope, and slid the envelope back under
the door to them. As they exited the laboratory, a monitor, chosen from the subject pool
before instructions were given, had each participant sign an earnings receipt.9
Additionally,
7
Data are available from the author at request.
8
The protocols differ in implementation—the sessions reported here were computerized, and the Berget al. sessions were hand-run—but both ensure complete (double-blind) anonymity.
9
Trust Low Reward High Reward Low Punish High Punish Transfer ($)
5.45 (3.90)
6.68 (3.31)
6.53 (3.92)
6.41 (4.10)
7.37∗
(3.71)
Desired Payback (%)
46.97 (14.58)
50.73 (13.43)
56.68∗
(21.40)
51.05 (13.49)
47.93 (11.60)
Actual Payback (%)
29.58 (21.15)
31.13 (21.76)
47.16∗
(34.35)
31.81 (21.11)
39.33∗
(19.2)
Total
Pairs 38 34 34 38 30
[image:12.612.109.503.82.260.2]Standard deviations in parentheses;∗significantly different from Trust(p <0.05)
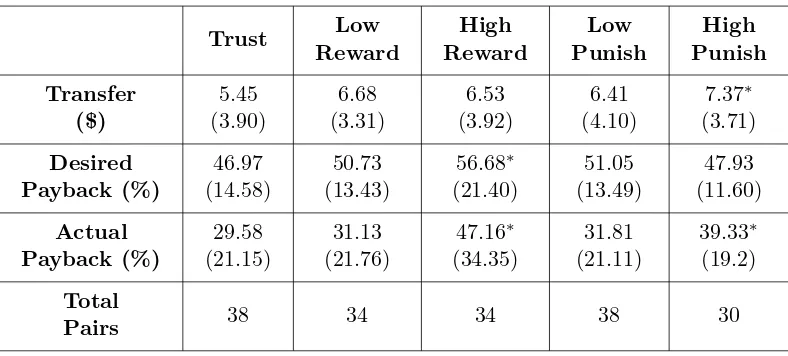
Table 1: Comparison of Trust with Incentive Conditions
the monitor had the task of collecting the codes and placing them in an appropriately labeled
box “male” or “female”. Using this process, the experimenter is unable to match individual
decisions with a particular person; yet collection of gender information on the subject pool
was possible.
4
Results
Table 1 reports for all conditions the average transfer by P1 to P2 (X), the average percentage
of the gains P1 requested be returned ( Z
3X), the average actual percentage returned by P2
(3YX), and the total number of pairs (N). The first line shows that the same amount of money
relative to the Trust condition is transferred by P1 in all treatment conditions, except
significantly more money is transferred in the High Punish condition (p = 0.05).10
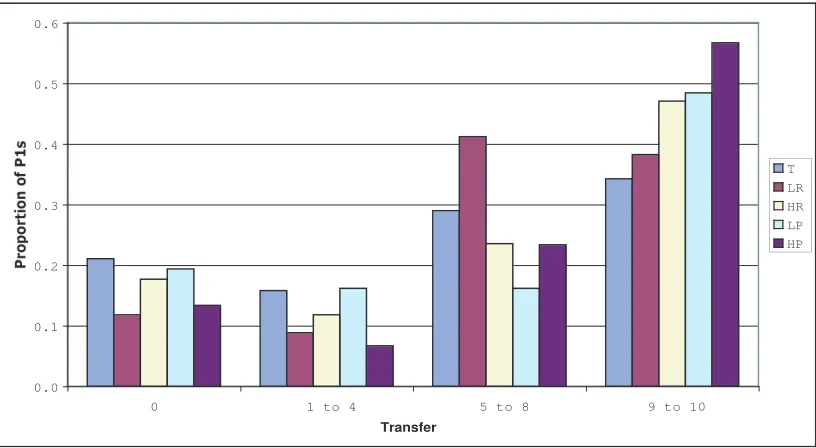
Figure
2 graphically displays the distribution of transfer amounts. The proportion of P1s sending
$0—roughly 20%—is higher in the implicit contracting game than in the standard investment
game, where 6.25% send $0 (Berg, et al., 1995). Although the proportion obtained in a
replication study by Ortmann, Fitzgerald, and Boeing (2000) found 18.75% sent $0, which
10
0.0 0.1 0.2 0.3 0.4 0.5 0.6
0 1 to 4 5 to 8 9 to 10
Transfer
[image:13.612.102.510.86.310.2]T LR HR LP HP
Figure 2: Transfers Across Treatments
is much closer to these data. The proportion of P1s sending $10—more than 30%—is also
higher in the implicit contracting game than in the standard investment game, where 15%
(Berg,et al., 1995) and 18% (Ortmann, Fitzgerald, and Boeing, 2000) send $10. The addition
of $10 to P1’s starting capital seems to increase both the number of P1s who keep all of their
endowment and the number who pass on as much as possible. Figure 2 also reveals that the
largest proportion of P1s investing the maximum amount in P2—57%—occurs when there is
a potential for relatively inexpensive retribution by P1 (i.e., underHigh Punish).
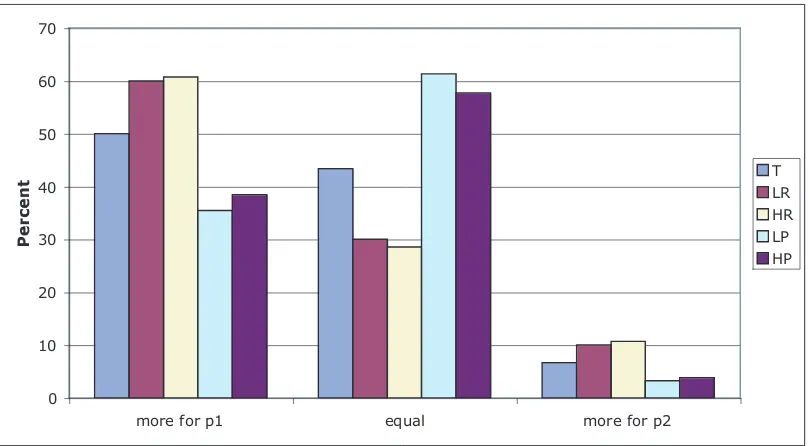
Desired payback is P1s cheap-talk message, which provides an opportunity for P1 to
make expectations clear. The second line in Table 1 shows Z
3X, the percentage of the gains P1
requested returned from P2. On average, the desired payback is roughly 50% in all conditions,
except a significantly larger request is made by P1 in theHigh Reward condition than in
theTrustcondition (p= 0.0388). Under High Reward, where P1 has the opportunity to
inexpensively positively reciprocate if P2 follows through on the accepted contract, P1 places
significantlyhigher demands on P2.
cheap-0 0.1 0.2 0.3 0.4 0.5 0.6 0.7
more for p1 equal more for p2
[image:14.612.111.503.87.308.2]T LR HR LP HP
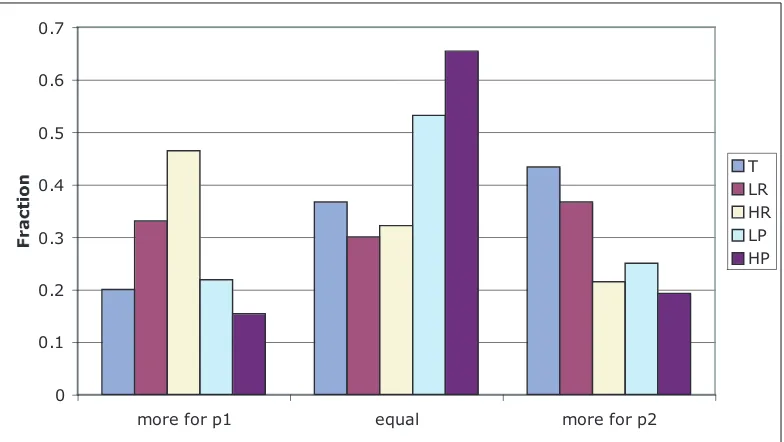
Figure 3: Desired Payback: All Treatments
talk messages. Figure 3 plots the fraction of P1s who request a larger share of the gains for
themselves (more for P1), an equal share (equal), and those who request a smaller share of the
gains for themselves (more for P2).11
There is a spike in the more for P1 category underHigh
Rewardand also a spike in the equal category under High Punish. Figure 4 displays how
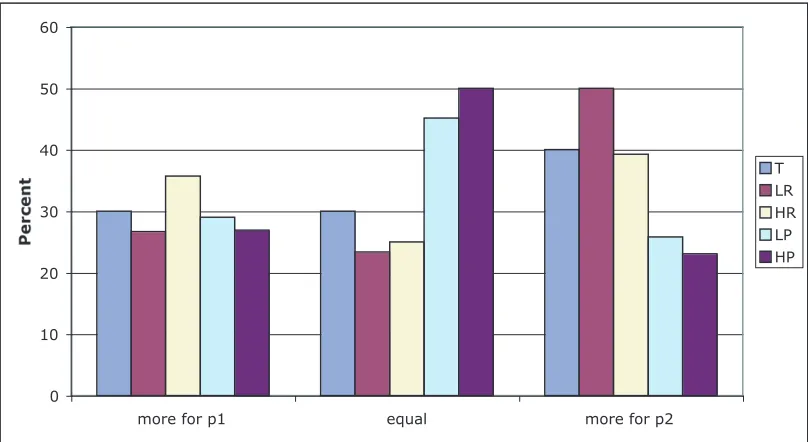
these requests translate into desired final earnings. Given that P1 begins with an additional
$10, if he wants to equalize final earnings, the desired payback request will have to differ
conditional on the amount sent. For example, if P1 transfers $3, then the desired payback
would only request 11% of the gains from exchange; if P1 transfers $7, then the desired
payback would request more of the gains be returned, 39%; only if $10 is transferred should
the request by P1 be to split the gains equally at 50%. In the two punish conditions, P1s
more frequently want to equalize final earnings: they are most equitable toward their agents
when only punishment is available as a means of enforcement and do not show this taste for
equalizing final distributions when relying on rewards or (purely) implicit contracts—in these
11
0 10 20 30 40 50 60 70
more for p1 equal more for p2
[image:15.612.105.509.86.309.2]T LR HR LP HP
Figure 4: Desired Share Earnings: All Treatments
environments P1s get greedy.12
This is somewhat surprising as it would be natural to expect
P1s to request higher final earnings for themselves when it is common information that they
have the option to punish should that request not be met; instead underp onlymechanisms
is where principals try to equalize earnings.
4.1 Player 2s’ Behavior
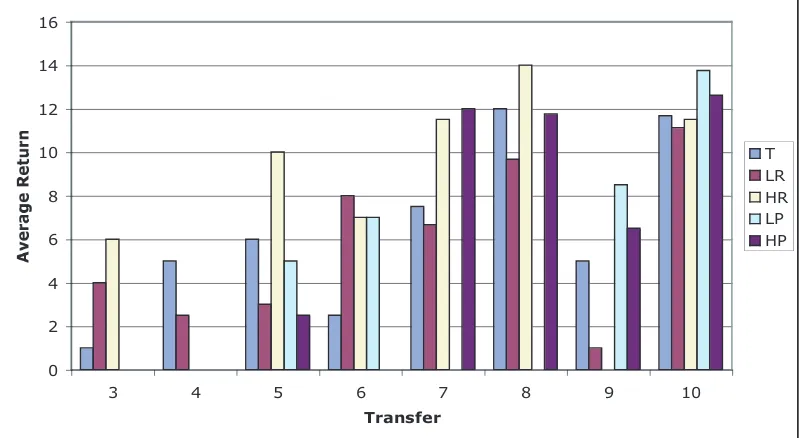
How do P2s respond to the cheap-talk message sent by P1s and the availability of rewards
or punishments across the conditions? Figure 5 shows the amount of 3X returned by P2
conditional on the amount sent (X). The average amount returned in High Reward and
High Punishis significantly higher than underTrust (p= 0.0484 and 0.0177). Note that,
like in the investment game, itnever pays to send $1 or $2 inany of the contracting games.
Moreover, it pays on average in all of the treatments to invest as the average return is larger
than the average amount sent. Additionally, the returns on investment correlate positively
with the investment level, suggesting that agents are responding reciprocally as the investment
12
0 2 4 6 8 10 12 14 16
3 4 5 6 7 8 9 10
Transfer
T LR HR LP HP
[image:16.612.107.507.89.308.2]∗The average returns are: $6.8 (T), $7.3 (LR), $11.8 (HR), $8.7 (LP), and $10.9 (HP).
Figure 5: Returns Across Treatments Conditional on Amount Sent
level increases.13
The third row in Table 1 shows Y
3X, the mean actual percentage of the gains returned by P2
to P1. P2 returns a significantlylarger percentage in the two high incentive conditions,High
Rewardand High Punish, than underTrust(p= 0.0367 and 0.05).14
Finally, comparing
the actual share of the gains Y
3X (row 3) with the desired share of the gains 3ZX (row 2) by
treatment, we see that P1s ask for more than they receive—except in High Reward and
High Punish. In these high incentive environments, the demands of the cheap-talk message
are met: 3YX and 3ZX arenotsignificantly different (p= 0.259 inHigh Rewardandp= 0.114
inHigh Punish).
To examine the degree of positive reciprocity exhibited by P2s across the treatments, we
13
The pairwise correlation coefficients for amount sent and amount returned are 0.68 (T), 0.49 (LR), 0.48 (HR), 0.74 (LP), and 0.47 (HR), which are all significant atp < .01.
14
0 10 20 30 40 50 60
more for p1 equal more for p2
[image:17.612.104.508.87.308.2]T LR HR LP HP
Figure 6: Actual Share Earnings: All Treatments
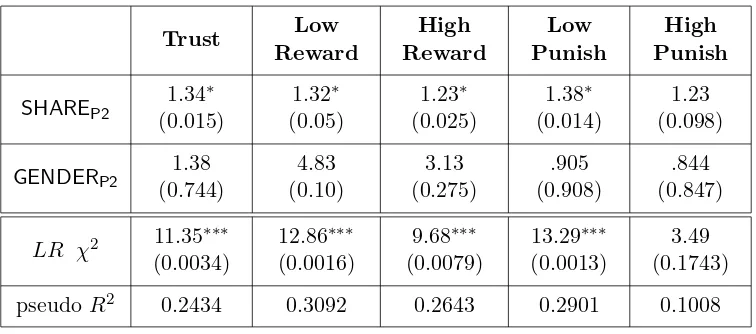
estimated the following logit regression separately for each treatment:
ln p(t)
1−p(t) =α+βSHAREP2+γ GENDERP2+ǫ
wherep(t) is the probability P2 fulfilled the terms of the cheap-talk message in Round 1, and
1−p(t) is the probability that P2 shirked on the terms specified by P1. The independent
variables areSHARE
P2, which is the amount of the gains from exchange P1 offered to P2 in
the cheap-talk message (i.e., 3X−Z), andGENDERP2, which is a dummy variable capturing
the gender of P2 with a value of 1 for females, 0 for males. See Table 2 for the results. The
columns report the logit odds ratio coefficient estimates and p-values. For all treatments,
GENDERP2 is insignificant in determining the likelihood that the contract is fulfilled. Also
notice that in each treatment, except High Punish, for every $1 increase in the amount of
the gains from exchange offered to P2, the odds of the contract being fulfilled increases by a
statistically significant amount. Together these results suggest that as P1 is more generous
to P2 in the first stage of the contracting game, P2 is much more likely to reciprocate by
Trust Low Reward High Reward Low Punish High Punish SHARE P2
1.34∗
(0.015)
1.32∗
(0.05)
1.23∗
(0.025)
1.38∗
(0.014)
1.23 (0.098)
GENDERP2 1.38
(0.744)
4.83 (0.10)
3.13 (0.275)
.905 (0.908)
.844 (0.847)
LR χ2 11.35∗∗∗
(0.0034)
12.86∗∗∗
(0.0016)
9.68∗∗∗
(0.0079)
13.29∗∗∗
(0.0013)
3.49 (0.1743)
pseudo R2 0.2434 0.3092 0.2643 0.2901 0.1008
[image:18.612.118.496.82.249.2]p-values in parentheses;p-values: ∗≤0.05,∗∗≤.01,∗∗∗≤.001
Table 2: Determinants of the Probability of P2 Fulfilling Contract
inHigh Punish—the likelihood P2 follows through on the contract is not influenced by the
distribution of the gains offered by P1.
4.2 Summary of Results: First Two Stages
Below are the key results from the implicit contracting game and the first two stages of the
incentive contracting treatments:
Result 1. There is little evidence of subgame perfect play in any of the conditions.
This is unsurprising and consistent with the stylized facts from bilateral bargaining
experi-ments. P1s send $0 at very low rates: 26.67% inTrust, 11.76% in Low Reward, 17.65%
inHigh Reward, 16.22% in Low Punish, and 13.33% in High Punish.
Result 2. No crowding out of transfers or returns—low incentives have no impact relative to
the baseline.
Average (and median) transfers are thehighestinHigh Punish—$7.37 andlowestinTrust—
$5.45 (p = 0.040); average (and median) returns are highest in High Reward—$11.8 and
High Punish—$10.9 andlowest inTrust—$6.8 (p= 0.0484 and 0.0177). Moreover, there is
not a significant difference between transfers and returns in the low reward/punish conditions
forTrust vs. Low Punish). The conclusion then is that the incentive treatments do not
crowd out transfer or returns.
Result 3. Carrots and Sticks work the same at low levels, and at low levels work no better
than implicit contracts.
There is no difference between average transfers underLow RewardandLow Punish($6.68
vs. $6.41,p= 0.536) and also no difference between average returns ($7.3vs. $8.7,p= 0.662).
These levels, moreover, are no different from transfers and returns in the implicit contracting
game. If potential reward and punishment levels are low, there is no efficiency advantage to
incentive contracts over implicit contracts.
Result 4. Big Carrots and Big Sticks induce greater efficiency than implicit contracts. Big
Carrots induce higher returns; Big Sticks increase investment levels.
Transfers in High Reward and Trustare no different, but returns inHigh Reward are
greater than in Trust. In High Punish, more is transferred and more is returned than
in Trust. In fact, High Punish is the only environment that generates larger investment
levels. Average transfers in High Reward are lower than under High Punish ($6.53 vs.
$7.37) and yet, average returns are not different. A natural explanation is that P1s expect
P2s, under the threat of a Big Stick, to behave themselves—and so P1s transfer more. On
the other hand, P1s do not seem to expect Big Carrots to carry the same motivation as Big
Sticks—so they transfer less inHigh Reward.
Result 5. Desired payback is largest under Big Carrots.
InHigh Reward, P1s ask for a larger relative share of gains from exchange (56.68%) than
underTrust(p= 0.0388) and a weakly larger share than underHigh Punish (p= 0.0703).
So P1s make more significant requests of P2s when there is a potential for relatively
inexpen-sive rewards. It looks as though P1s anticipate that P2s will attempt to seek a reward by
following through on the request, so P1s choose to ask for more of the gains from exchange.
Putting these two results together suggests an interesting picture about how principals
better than Big Carrots. P1s transfer more inHigh Punish—but they hedge their
compara-tively liberal investment: they ask forless of the gains back, a priori making it relatively less
likely they will have touse the Big Stick. (P2 has to keep a lot to qualify for punishment.) In
High Reward, on the other hand, P1s hedge their comparatively conservative investment—
they ask formore of the gains back,a priori making it relatively less likely they will have to
use the Big Carrot. (P2 has to do more to qualify for a reward.) The returns are the same
inHigh Rewardand High Punish: the two investment-plus-hedge strategies seem to align
P2s behavior to the same extent.
Result 6. Under Big Carrots and Big Sticks, actual payback is equivalent to desired payback.
The high incentive treatments are the only treatments where the desired distributional
out-come is equivalent to the final distributional outout-come (p = 0.6115 and 0.172). The level of
the incentive matters to the degree to which P2 follows through on the request made by P1
via the cheap-talk message. Since P1s request a greater return under High Reward than
High Punish, P1s are better off in the former than the latter.
4.3 Rewards and Punishments
Based on the difference in return behavior by P2s in the high incentive conditions as compared
to the baseline, it looks as though she has the expectation that P1 will provide rewards or
impose punishment. An interesting question is whether these expectations are met. If players
are myopically self-interested, the prediction is that there will be no demand for reward and
punishment. Since it is costly for P1 to provide rewards and to impose punishment, if given
the opportunity to do so, P1 will choosec = 0. Thus ρ=λ0 = 0, no matter the value ofλ.
However, previous experimental results have demonstrated a significant demand for rewards or
punishment in different contexts (Andreoni, Harbaugh, and Vesterlund, 2003; Sefton, Shupp,
and Walker, 2002; Gneezy, 2003; Fehr and List, 2004). One can imagine that whether or not
P1 rewards or punishes will partly depend on (1) the degree to which P2 follows through or
deviates from the accepted contract and (2) the relative cost (i.e., the relationship between
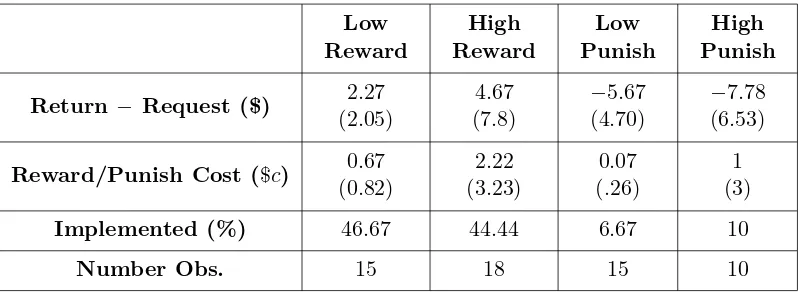
Low Reward High Reward Low Punish High Punish
Return − Request ($) 2.27 (2.05)
4.67 (7.8)
−5.67 (4.70)
−7.78 (6.53)
Reward/Punish Cost ($c) 0.67 (0.82)
2.22 (3.23)
0.07 (.26)
1 (3)
Implemented (%) 46.67 44.44 6.67 10
Number Obs. 15 18 15 10
[image:21.612.107.506.83.229.2]Cases whereY ≥Z under Reward andY < Z under Punish
Table 3: Demand for Reward and Punishment
from that requested for only those cases where P1 had the opportunity to reward or punish,
i.e. Y ≥Z in reward environments and Y < Z in punishment environments. In the reward
conditions, P2 returns more on average than P1 requested and in the punish conditions P2
returnsfar less than P1 requested.
The second line in Table 3 shows at what cost P1s enforce incentives by reporting mean
values forc. Under both of the low incentive conditions very little reward or punishment is
implemented in the third stage. Yet, in High Reward, ¯ρ = $6.50, more than making up
for the (almost) $5 more returned by P2 to P1. However, in High Punish, even though P2
aresignificantly under-fulfilling the contracts, punishments are relatively low: ¯ρ=−$3. The
third line in Table 3 indicates that when the option was available to reward, a significant
fraction—almost half—of P1s chose to reward; yet, a significantly smaller fraction made use
of the punishment mechanism. In fact, underHigh Punishonlyoneindividual punished—he
initially invested all $10 of his investable endowment, requested a 50/50 split of the gains,
but P2 kept all $30 of the gains. So P1 then spent $9 to reduce P2’s earnings by $27, erasing
nearly the entire original gains from exchange!
4.4 Summary of Results: Third Stage
Below are the key results from the third stage of the incentive contracting treatments:
The demand by P1s for Carrots (at any level) far exceeds the demand for Sticks (at any
level). When given the opportunity, about 50% of P1s reward their counterpart in both
reward treatments by choosing c > 0; however, far fewer P1s punish their counterpart—
only 6% and 10% choosing c >0 in Low Punish and High Punish, respectively (using a
proportion test,p= 0.0132 and 0.0615).
Result 8. When implemented, principals use significantly larger Carrots than Sticks across
incentive treatments.
P1s opted for rewards uniformly greater than punishments. InLow Punish, an average of
only $.07 is imposed on deviating P2s which is significantly lower than the $.67 reward issued
inLow Reward (p= 0.012). Similarly for the high-incentive treatments: inHigh Punish
only ρ=−3(.90) is imposed; that is weakly different from the rewards of ρ= 3(2) issued in
High Reward (p= 0.1048).
4.5 Gender Differences
The evidence on gender differences in the standard investment game seems to be converging:
males are more trusting than females (male P1s transfer more than female P2s), but females
are more reciprocal than males (female P2s return more than male P2s).15
There is no
research that tracks gender differences in environments like the contracting games considered
here in which there are gains from exchange and cheap-talk messages communicating desired
distributions of those gains. The analysis sheds light on the degree to which males and females
trust and trustworthy behavior can be differentially impacted by the nature of the institutional
arrangement between a principal and their agent.
The gender results in the contracting games can be grouped around three variables:
in-vestment levels (X), actual relative share of gains (Y
3X), and desired relative share of the gains
in the cheap-talk message (Z
3X).
15
Investment levels inTrust,Low Reward, andLow Punish, are gender invariant (p=
0.329, 0.3329, and 0.6302). Given the standard gender differences in the investment game,
this suggests that the cheap-talk messages differentially affect choice behavior of P1s across
genders—after all, the only salient difference between the implicit contracting game and the
investment game is the cheap-talk message. However, there are significant differences in
behavior in the high incentive conditions, females investing significantly less than males in
both High Reward and High Punish. Moreover, this difference is more exaggerated in
High Reward—$4.94 vs. $8.31 (p = 0.0074)—than it is in High Punish—$6.67 vs. $7.8
(p = 0.0412). There are significant increases in efficiency that high incentives bring to the
contracting environment. The gender differences suggest that these gains are largely due to
increasing investments made primarily by males.
Return behavior as measured by actual relative share returned is gender invariant across
all conditions.16
Again, given the standard gender differences in the investment game, this
suggests that the cheap-talk messages differentially affect choice behavior of P2s across
gen-ders. In contrast to P1 behavior, the presence of high incentives does not induce any gender
difference for returns.
The presence of a cheap-talk message about desired distribution of gains affects choice
behavior of both P1s and P2s. A natural question is to ask whether the cheap-talk messages
themselves are gender invariant across treatments. Indeed, they are gender invariant across
the incentive treatments LR, LP, HR, and HP.17
However, in the implicit contracting game—
the investment game-plus-cheap-talk—there is a significant gender difference in Z
3X. Under
Trust, females ask for a significantly smaller share in the gains from exchange—40%
com-pared to 53% requested by males (p = 0.05). So although females invest at the same levels
as their male counterparts, females ask for less from their agents.18
This may be because the
16
Trust: p= 0.6324; Low Reward: p= 0.1721; High Reward: p = 0.1913; Low Punish: p= 0.591; High Punish: p = 0.2648. The results are not affected by measuring return behavior by actual amount returned.
17
Low Reward: p = 0.7204; High Reward: p = 0.4252; Low Punish: p = 0.2964; High Punish:
p= 0.7832.
18
implicit contract is seen as a relatively risky environment—there is no means of enforcing the
cheap-talk contract—and asking for a smaller relative share of the gains offers some insurance.
This difference in negotiation behavior is washed out in the presence of incentives. Depending
on how robust these results prove to be in the long run, the institutional implications seem
clear.
4.6 General Summary of Results
Overall, the results support four conclusions. First, there is no evidence of a Paradox of
Organizational Trust nor any evidence that sanctions (or rewards) have detrimental effects
on cooperative behavior. This is in contrast to the results reported by Fehr and Rockenbach
(2003). Neither is there any evidence of a “W-effect” of incentives—Gneezy’s (2003) finding
in the proposer–responder game that low levels of incentives crowd out transfers and high
levels crowd them in.19
Moreover, the results reported here differ from those in Gneezy and
Rustichini (2000b), where the effect of incentives on performance on an IQ test and fund
raising task is also non-monotonic. Rather, in a game with gains from exchange and
cheap-talk contracts, low-level incentives have no behavioral effect and high-level incentives crowd
in. Incentives, at high-levels, are efficiency-enhancing contract mechanisms.20
Second, the cheap-talk messages do not vary across games—except in High Reward.
The ability to deploy a Big Carrot seems to give P1s a sense of entitlement over the final
distribution, and they ask for more of the gains from exchange. Holding the ability to impose
a big fine creates no such entitlement. It is an open question what the relationship is
be-tween this sense entitlement over a final distribution and the sort of earned entitlement that
accompanies property-right manipulations of ultimatum and dictator games (Hoffman,et al.,
1994).
Third, it is only in the high-incentive environments that actual relative share of the gains
Y
3X equals desired relative share of the gains 3ZX. This suggests that P2s behavior in these
19
A plot with five treatments on the horizontal axis with fines on the left hand side relative to the baseline and rewards on the right hand side, and average offer of proposers on the vertical axis results in a W-shaped graph.
20
conditions is being driven by different expectations. In particular, it is natural to conclude
that agents, in high incentive environments, expect that the incentives will be enacted. It
is, after all, relatively cheap to heap a large reward on the dutiful at high levels and cheap
to slap a serious fine on shirkers. But these expectations are not uniformly borne out by
principals’ behavior. Principals willreward in high-incentive environments—about half of the
time, and at significant levels. But principals only very rarelypunish in these high-incentive
contexts. It is unclear what accounts for this mismatch between how willing people are to
impose punishments/rewards and their expectations about how willing people are to impose
punishments/rewards.
Fourth, the presence of cheap-talk messages affects choice behavior across genders
differ-entially. Males typically invest more than females in the investment game. However, this is
not the case in the presence of a cheap-talk message (whether in an implicit contract, or a low
incentive contract). These differences do re-emerge in high incentive contexts, but it is not
because females are less trusting but because males become hyper-trusting, investing much
more than they do in any other treatment. Similarly, females tend to return more as agents in
the investment game than their male counterparts. This result disappears in the presence of
cheap-talk messages, whether the contract is implicit or incentive based. Cheap-talk contracts
differentially affect the choice behavior of males and females, and yet (with the exception of
T) thecontent of those contracts is no different across genders. And where they do differ (in
Trust), it is females asking for significantly less.
5
Conclusion
One of the main goals of this paper has been to address, using laboratory methods, the
Paradox of Organizational Trust. There is no evidence that motivating a worker solely by
trusting him (a la Hank Scorpio) is more efficient than wielding a Carrot or a Stick or a cat
o’ nine tails (a la Monty Burns). Indeed, in high-incentive contexts—those in which it is
relatively cheap for a principal to deliver a large punishment or reward—quite the opposite is
More generally, the goal has been to explore the behavioral foundations for efficient
so-lutions to principal–agent contracting problems, and to better understand how institutional
structure interacts with those solutions. Further experimental probes are needed to better
understand some of the findings reported here. For instance, we have simplified the
envi-ronments considerably by allowing punishmentsonly, or by allowing rewardsonly. In future
experiments this assumption is relaxed in contracting environments with the ability to do
either at the principal’s discretion.21
Since many principal–agent problems are repeated
in-teractions, it will also be interesting to see what effect that may have on behavior in these
games. The goal is to use the laboratory as a controlled probe, collecting information on
very specific behavioral variables in principal–agent contracting games in order to constrain
developing theory.22
In this respect, the project is no different from any project in behavioral
game theory.
21
Andreoni, Harbaugh, and Vesterlund (2003) find such a mechanism in the proposer–responder game to induce the greatest move toward efficiency.
22
References
Andreoni, James (2005). “Trust, Reciprocity, and Contract Enforcement: Experiments on
Satisfaction Guaranteed,” Working Paper, The University of Wisconsin.
Andreoni, James, William Harbaugh, and Lise Vesterlund (2003). “The Carrot or the Stick:
Rewards, Punishments, and Cooperation,” American Economic Review93: 893–902.
Andreoni, James and Lise Vesterlund (2001). “Which Is the Fair Sex? Gender Differences in
Altruism,”The Quarterly Journal of Economics 116(1): 293–312.
Babcock, Linda and Sara Laschever (2003).Women Don’t Ask: Negotiation and the Gender
Divide(Princeton, NJ: Princeton University Press).
Barnes, Louis B. (1981). “Managing the Paradox of Organizational Trust,”Harvard Business
Review59: 107–116.
Benz, Matthias, Marcel Kucher, and Alois Stutzer (2002). “Stock Options for Top Managers:
The Possibilities and Limitations of a Motivational Tool,” in Frey, Bruno and Margit
Oster-loh (eds.).Successful Management by Motivation. New York, NY: Springer-Verlag Press).
Berg, Joyce, John Dickhaut, and Kevin McCabe (1995). “Trust, Reciprocity, and Social
His-tory,”Games and Economic Behavior 10: 122–142.
Blume, Andreas and Andreas Ortmann (in press). “The Effects of Costless Pre-play
Commu-nication: Experimental Evidence from Games with Pareto-Ranked Equilibria,” Journal of
Economic Theory.
Bohnet, Iris, Bruno S. Frey and Steffen Huck (2001). “More Order with Less Law: On Contract
Performance, Trust, and Crowding,” American Political Science Review95(1), 131–144.
Bohnet, Iris and Richard Zeckhauser (2004). “Trust, Risk, and Betrayal,”Journal of Economic
Boles, Terry, Rachel Croson, and J. Keith Murnighan (2003). “Cheap Talk in Bargaining
Experiments: Lying and Threats in Ultimatum Games,” Journal of Economic Behavior
and Organization51(2): 143–159.
Buchan, Nancy, Rachel Croson, and Sara Solnick (2003). “Trust and Gender: An Examination
of Behavior, Biases, and Beliefs in the Investment Paper,” The Wharton School, University
of Pennsylvania.
Buchan, Nancy, Eric Johnson, and Rachel Croson (in press). “Let’s Get Personal,” Journal
of Economic Behavior and Organization.
B¨uchner, Susanne, Luis Gonzalez, Werner G¨uth, and M. Vittoria Levati (2003). “Incentive
Contracts Versus Trust in a Three-Person Ultimatum Game,” Working Paper, Max Planck
Institute for Research into Economic Systems, Jena, Germany.
Camerer, Colin F. (2003). Behavioral Game Theory (Princeton, NJ: Princeton University
Press).
Cameron, Judy and W. David Pierce (1994). “Reinforcement, Reward, and Intrinsic
Motiva-tion,”Review of Educational Research64: 363–423.
Charness, Gary and Uri Gneezy (2004). “Gender Differences in Financial Risk-taking,”
Work-ing Paper
Chaudhuri, Ananish and Lata Gangadharan (2003). “Gender Differences in Trust and
Reci-procity,” Working Paper, University of Auckland.
Clark, Kenneth, Stephen Kay, and Martin Sefton (2000). “When Are Nash Equilibria
Self-Enforcing? An Experimental Analysis,” International Journal of Game Theory29: 495–
515.
Cooper, Russell, Douglas DeJong, Robert Forsythe, and Thomas Ross (1992).
Cooper, Russell, Douglas DeJong, Robert Forsythe, and Thomas Ross (1989).
“Communi-cation in the Battle of the Sexes Game: Some Experimental Results,” Rand Journal of
Economics 20: 568–587.
Crawford, Vince (1998). “A Survey of Experiments on Communication via Cheap Talk,”
Journal of Economic Theory78: 286–98.
Crawford, Vince and Joel Sobel (1982). “Strategic Information Transmission,”Econometrica
50: 1431–1452.
Croson, Rachel and Nancy Buchan (1999). “Gender and Culture: International Experimental
Evidence from Trust Games,”American Economic Review, Papers and Proceedings89(2):
386–391.
Deci, Edward L. (1971). “Effects of Externally Mediated Rewards on Intrinsic Motivation,”
Journal of Personality and Social Psychology18: 105–115.
Deci, Edward and Richard Ryan (1999). “A Meta-analytic Review of Experiments Examining
the Effects of Extrinsic Rewards on Intrinsic Motivation,”Psychological Bulletin125: 627–
668.
Duffy, John and Nick Feltovich (2002). “Do Actions Speak Louder than Words? Observation
vs. Cheap Talk as Coordination Devices,”Games and Economic Behavior 39(1): 1–27.
Eckel, Catherine and Philip Grossman (1998). “Are Women Less Selfish Than Men? Evidence
from Dictator Experiments,”Economic Journal108(448): 726–35.
Eckel, Catherine and Philip Grossman (in press). “Differences in the Economic Decisions of
Men and Women: Experimental Evidence,” in C. Plott and V. Smith (eds.) Handbook of
Experimental Economic Results(Amsterdam: Elsevier).
Eckel, Catherine and Rick Wilson (2002). “Conditional Trust: Sex, Race, and Facial
Eckel, Catherine and Rick Wilson (2004). “Is Trust a Risky Decision?”Journal of Economic
Behavior and Organization55(4): 447–465.
Eisenberger, Robert, Linda Rhodes, and Judy Cameron (1999). “Does Pay for Performance
Increase or Decrease Perceived Self-Determination and Intrinsic Motivation,” Journal of
Personality and Social Psychology 77: 1026–1040.
Ensminger, Jean (2001). “Reputations, Trust, and the Principal Agent Problem,” in K. Cook
(ed.)Trust in Society (New York, NY: Sage), pp.185–201.
Fehr, Ernst and Armin Falk (2002). “Psychological Foundations of Incentives,” European
Economic Review46: 687–724.
Fehr, Ernst and Urs Fischbacher (2002). “Why Social Preferences Matter—The Impact of
Non-selfish Preferences on Competition, Cooperation, and Incentives,” The Economic
Journal112: C1–C33.
Fehr, Ernst and Simon G¨achter (2000). “Cooperation and Punishment in Public Goods
Ex-periments,”American Economic Review90(4): 980–994.
Fehr, Ernst and Simon G¨achter (2000). “Do Incentive Contracts Crowd Out Voluntary
Co-operation?” University of Z¨urich, Working Paper No. 34.
Fehr, Ernst, Simon G¨achter and Georg Kirchsteiger (1997). “Reciprocity as a Contract
En-forcement Device,”Econometrica 65(4): 833–860.
Fehr, Ernst, Erich Kirchler, Andreas Weichbold, and Simon G¨achter (1998). “When Social
Norms Overpower Competition: Gift Exchange in Experimental Labor Markets,” Journal
of Labor Economics 16(2): 324–351.
Fehr, Ernst and John List (2004). “The Hidden Costs and Returns of Incentives: Trust and
Trustworthiness among CEOs,”Journal of the European Economic Association 2(5): 743–
Fehr, Ernst and Bettina Rockenbach (2003). “Detrimental Effects of Sanctions on Human
Altruism,”Nature 422: 137–140.
Fernie, Sue and David Metcalf (1996). “Its Not What You Pay Its the Way That You Pay It
and That’s What Gets Results,”Labour13(2): 385–411.
Fernie, Sue and David Metcalf (2000). “Ricky Don’t Lose that Number. . .Payment
Perfor-mance in Call Centers,” in Sue Fernie (ed.)Human Resource CentersManchester:
Manch-ester University Press.
Frey, Bruno (1997). “A Constitution for Knaves Crowds Out Civic Virtues,”The Economic
Journal107: 1043–1053.
Glaeser, Edward, David Laibson, Jos´e Scheinkman, and Christine Soutter (2000). “Measuring
Trust,”Quarterly Journal of Economics 115: 811–846.
Gneezy, Uri (2003). “The W effect of Incentives,” Working Paper, The University of Chicago.
Gneezy, Uri and Aldo Rustichini (2000a). “A Fine is a Price,”Journal of Legal Studies29(1):
1–18.
Gneezy, Uri and Aldo Rustichini (2000b). “Pay Enough or Don’t Pay At All,” Quarterly
Journal of Economics115(3): 791–810.
Groves, Theodore, Yongmiao Hong, John McMillan, and Barry Naughton (1994). “Autonomy
and Incentives in Chinese State Enterprises,”Quarterly Journal of Economics109(1): 183–
209.
Halachmi, Arie and Marc Holtzer (1986). “Merit Pay, Performance Targeting, and
Produc-tivity,”Review of Public Personnel Administration 7: 80–91.
Harbaugh, William, Kate Krause, Steven Liday, and Lise Vesterlund (2003). “Trust in
Chil-dren,” in Elinor Ostrom and James Walker (eds.) Trust and Reciprocity: Interdisciplinary
Lessons from Experimental Research (New York, NY: Russell Sage Foundation), pp 302–
Healy, Paul J. (2004). “Fairness, or Just Gambling on it? An Experimental Analysis of the
Gift Exchange Game,” Working Paper 1183, California Institute of Technology, Division of
the Humanities and Social Sciences.
Hoffman, Elizabeth, Kevin McCabe, and Vernon Smith (1996). “Preferences, Property Rights,
and Anynomity in Bargaining Games,”Games and Economic Behavior 7(3): 346–380.
Kohn, Alfie (1993). “Why Incentive Plans Cannot Work,”Harvard Business Review5: 54–63.
Lazear, Edward (2000). “Performance, Pay and Productivity,” American Economic Review
90(5): 1346–1361.
Lazzarini, Sergio G., Gary J. Miller, and Todd R. Zenger (2003). “Order with Some Law:
Complementarity vs. Substitution of Formal and Informal Arrangements,”Journal of Law,
Economics, and Organization20(2): 261–298.
Lepper, Mark R. and David Greene (1978). The Hidden Costs of Reward: New Perspectives
in the Psychology of Human Motivation(NJ: John Wiley and Sons).
McCabe, Kevin, Mary Rigdon, and Vernon Smith (2002). “Cooperation in Single Play,
Two-Person Extensive Form Games between Anonymously Matched Players,” in Rami Zwick and
Amnon Rapoport (eds.)Experimental Business Research(Boston, MA: Kluwer), pp.49–67.
McCabe, Kevin, Mary Rigdon, and Vernon Smith (2003). “Positive Reciprocity and Intentions
in Trust Games,” Journal of Economic Behavior and Organization52(2): 267–275.
McCabe, Kevin and Vernon Smith (2000). “A Two-person Trust Game Played by Na¨ıve and
Sophisticated Subjects,” Proceedings of the National Academy of Sciences 97(7): 3777–
3781.
Ortmann, Andreas, John Fitzgerald and Boeing, Carl (2000). “Trust, Reciprocity, and Social
History: A Re-examination,”Experimental Economics3(3): 81–100.
Prendergast, Canice (1999). “The Provision of Incentives in Firms,” Journal of Economic
Rigdon, Mary (2002). “Efficiency Wages in an Experimental Labor Market,” Proceedings of
the National Academy of Sciences 99(20): 13348–13351.
Scharlemann, J¨orn, Catherine Eckel, Alex Kacelnik, and Rick Wilson (2001). “The Value of
a Smile: Game Theory with a Face,” Journal of Economic Psychology22(5): 617–640.
Sefton, Martin, Robert Shupp, and James Walker (2002). “The Effect of Rewards and
Sanc-tions in the Provision of Public Goods,” Working Paper, University of Nottingham.
Slonim, Robert (2004). “Gender Selection Discrimination: Evidence from a Trust Game,”
Working Paper, Case Western Reserve.
Yamagishi, Toshio (1988). “The Provision of a Sanctioning System in the United States and
A
Instructions for Baseline
You have been asked to participate in an economics experiment. Now that the experiment
has started, we ask that you do not talk during the experiment.
Experiment Description
In this experiment each of you will be paired with another individual, your counterpart for
the experiment. You will not be told who this person is either during or after the experiment.
Each person has received a $10 show-up fee. Each of you will be randomly selected to either
be a first mover or a second mover; therefore, half of the people in today’s experiment will be
first movers and the other half will be second movers.
There are two stages. In the first stage, the first mover is allocated an additional $10.
Each first mover will have the opportunity to send any part of this $10 (from $0 to $10) to
their counterpart, a second mover. Each dollar sent will be tripled. Here are two examples:
if a first mover sends $2, the second mover will receive $6; if a first mover, sends $9, the
second mover will receive $27. These are only examples—the actual decision is up to each
first mover. Along with any amount sent, the first mover will also propose a division of the
tripled amount ($x, $y), where $x is the amount to be returned to the first mover and $y is
the amount to be kept by the second mover.
In the second stage, the second mover has the opportunity to accept or reject the amount
sent. If he/she rejects, the first mover earns $20 and second mover earns their $10 show-up
fee. If he/she accepts, then the second mover has a decision to make: how much of the money
to send back to the first mover and how much to keep. The amount of money the second
mover returns to the first mover can be the same or different from the proposed division.
Once the second mover decides, the first mover will learn of the decision.
THE EXPERIMENT IS THEN OVER.
Complete Privacy
Today’s experiment is structured so that no one, neither the experimenter nor the other people
in the experiment, nor anyone else, will ever know the personal decisions of anyone in the
Once the experiment begins, you should enter the code into your computer, and then click the
“OK” button. Be sure to place the code back in the envelope! At the end of the experiment,
you will walk one by one and slide the envelope containing your code under the door. We
will then look up your code, place your experiment earnings in the envelope, and slide it back
under the door.
Since your decision is private, we ask that you do not tell anyone your decision either
during, or after, the experiment.
Are there any questions before we begin?
B
Instructions for Treatment Conditions
The instructions for the four treatment conditions contains the description below of the
ad-ditional, third stage. The instructions are for Low Reward [High Reward]. The Punish
conditions’ instructions are exactly the same, except “equal orgreater than” is replaced with
“strictlylower”.
In the third stage, if the amount of money the second mover returns to the first mover
is equal or greater than the amount proposed by the first mover in the first stage, the first
mover must decide to do oneof the following:
1. Make no change to the second mover’s earnings, in which case the first mover’s and the
second mover’s earnings are the same as those in the second stage.
2. Increase the earnings of the second mover, in which case the second mover’s earnings
increase by $1 [$3] for every $1 increase chosen by the first mover.
Note that if the first mover chooses to increase the earnings of the second mover, it costs the
first mover $1 for every $1 [$3] change that he/she makes to the second mover’s earnings. It
does not cost the first mover anything to make no change to the second mover’s earnings.
C
Figures for Desired Distribution of Gains from Exchange
Appendix C contains the distributions of the cheap-talk messages P1s sent to P2, (Z,3X−Z).
Notice that underTrust much of the distribution has messages favoring P2, i.e. those that
lie above the 45-degree line. Under the Reward treatments, much of the distribution has
messages that favor P1, i.e. those that lie below the 45-degree line. An interesting data point
that does not possess this feature is underHigh Reward: P1 sent all $10 and requested P2
keep all of the gains from exchange; P2 responded by sending it all back to P1 and P1 chose
c= $8, resulting in P2 being rewarded with ρ= $24 for final earnings of $32 for P1 and $34
for P2. Under thepunishtreatments, much of the distribution lies around the 45-degree line,
0
2
4
6
8
10
Y
0 2 4 6 8 10
X
0 5 10 15 20 25 30
0 5 10 15 20 25 30
For P1
T
9
0 5 10 15 20 25 30
0 5 10 15 20 25 30
For P1
LR HR
4,6
5,6
0 5 10 15 20 25 30
0 5 10 15 20 25 30
For P1
LP HP