Technology (IJRASET)
Analysis of Transmission Tower for Seismic
Loading Considering Different Height and Bracing
System
Sourabh Rajoriya1, K.K. Pathak2, Vivekanand Vyas3 1
PG student, Dept. of Civil & Env. Engg, NITTTR Bhopal 462002 2
Professor, Dept. of Civil Engineering, IIT (BHU), Varanasi 221005 3
Asst. Prof., Dept. of Civil Engineering, Radharaman Engineering College, Bhopal M.P
Abstract--The four legged self-supporting tower is being used all over the world for transmitting electricity supply and for other purposes. Including the self-weight, transmission tower has to withstand against all forces like earthquake, wind and snow load etc. Therefore, transmission towers are generally designed for both structural and electrical requirements. In this study, four legged square type transmission tower has been analyzed for all four seismic zones (as per IS:1893(part-3)) considering three heights (40m, 50m and 60m) using STAAD.Pro software. Results are collected in terms of maximum deflection, maximum support reaction, maximum support moment, axial stress and bending stress criteria based on which salient conclusions are drawn.
Keywords: Transmission tower, Seismic analysis, Bracing system.
I. INTRODUCTION
A transmission tower is a tall structure also called as electricity pylon is usually a steel lattice tower used for supporting overhead cables. It is used in high AC and DC voltage and come in various shapes and sizes. They are the structures built to carry one or two circuits, although some transmission towers are also built to carry three or four circuits. Each circuit consists of three phases. Transmission towers support the phase conductors & earth wires of a transmission line. The necessity of electric power consumption has continued to enhance the rate of demand for developing countries. Transmission line tower is one of the important power supply structure. Transmission towers are necessary for the purpose of conveying electricity to various regions of the nation. This has led to increase in the structure of power stations and consequently increase in power transmission lines from the inducing stations to the various other corners where it’s needed. Inter-connections between systems are increasing to enhance reliability and economy. Some of the important literature on the topic are as follows:-
Technology (IJRASET)
analysis were tabulated, compared and conclusions were drawn. Shivam Panwar, Yogesh Kaushik, Anubhav Singh, Nikhil Sharma (2016), analyzed and designed of a steel lattice transmission line towers using STAAD.ProV8i for wind and earthquake loading. They used two wind zones II and IV and compared to seismic zone IV for the same configuration of tower. In this study, the importance was given to the wind loading. The comparative study was done between wind and earthquake with respect to axial forces, deflections, maximum sectional properties and critical loading condition for both the zones. Sumit Pahwa,Vivek Tiwari, Harsha Jatwa (2014), analyzed 1S2 transmission tower under wind and earthquake loadingby taking into consideration of optimizing technique and comparative study is done between the wind and seismic loads. The optimization of wind and earthquake loading is conducted by plotting graph between wind forces with height, earthquake forces with height and tower with X and K bracing under wind and seismic load. All the analysis is performed using STAAD.Pro software and EXCEL spreadsheet. Srikanth, Neelima Satyam (2014), analysed transmission tower using Indian Standard IS: 1893:2002 (Earthquake) and dynamic analysis of tower performed considering ground motion of 2001 Bhuj Earthquake (India). They performed the analysis using numerical time stepping finite difference method. The tower was analysed using response spectrum analysis.
II. MODELLING AND LOADING DETAILS
This study includes comparative study of behavior of transmission tower with different geometrical configurations (12 cases) under seismic forces. A comparison of analysis results such as deflection, support reaction, support moment, axial stress and bending stresses have been carried out.
A. Problem Formulation Selection of tower geometry
Selection of four seismic zones (Table 1)
Table 1: Seismic zone with zone factor
Formation of load combination (13 load combinations) for seismic (Table 3) Modeling of transmission tower
Analysis considering different height, seismic zones and each load combinations
[image:3.612.63.545.593.715.2]Comparative study of results in terms of maximum deflection, maximum support reaction, maximum support moment, axial stress and bending stress for all different height tower.
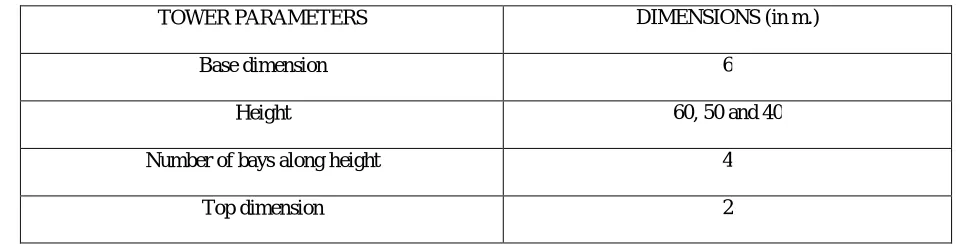
Table 2: Proposed dimensions of transmission tower
TOWER PARAMETERS DIMENSIONS (in m.)
Base dimension 6
Height 60, 50 and 40
Number of bays along height 4
Top dimension 2
Seismic Zones as per IS 1893:2002(part-1)
Zone Factor
II 0.1
III 0.16
IV 0.24
Technology (IJRASET)
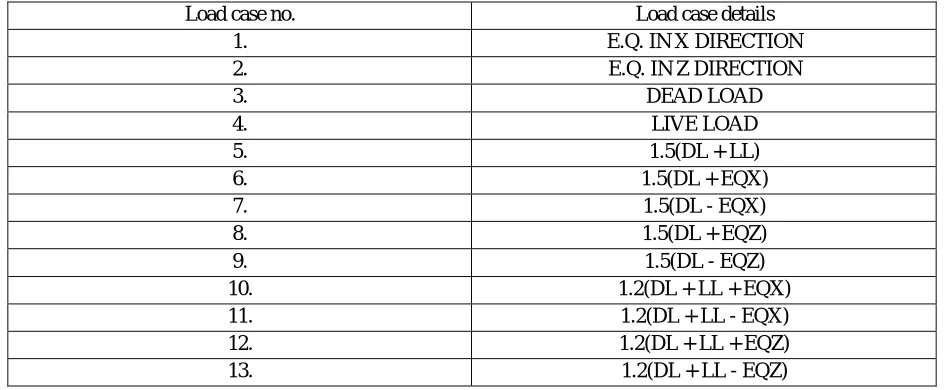
Table 3: Table for load case details for seismic forces
Load case no. Load case details
1. E.Q. IN X DIRECTION
2. E.Q. IN Z DIRECTION
3. DEAD LOAD
4. LIVE LOAD
5. 1.5(DL + LL)
6. 1.5(DL + EQX)
7. 1.5(DL - EQX)
8. 1.5(DL + EQZ)
9. 1.5(DL - EQZ)
10. 1.2(DL + LL + EQX)
11. 1.2(DL + LL - EQX)
12. 1.2(DL + LL + EQZ)
13. 1.2(DL + LL - EQZ)
B. Details Of Seismic Parameter
The following seismic parameters are used in evaluating the seismic loads on the structure: Zone factor (Z) as per IS-1893:2002 Part -1 for different Zone as per clause 6.4.2.(See Table 1) Importance factor (I) - depending upon the fundamental use. We have considered I as 1.5 in this study. Average Response acceleration
Coefficient Sa/g - for medium soil site Sa/g = 1+15T 0.00≤T≤0.1 2.5 0.1≤T≤0.55 1.36/T 0.55≤T≤4.00 Design horizontal seismic co-efficient Ah for the structure: - Ah = Z.I.Sa /2.R g
C. Cases Of Analysis
[image:4.612.73.539.500.695.2]Table 4 shows the cases which are used for analysis with respect of zone factors, height and seismic zones.
Table 4: Cases used for seismic analysis Seismic
Zone
Case Number Height (m) No. of bays Top dimension Bottom dimension
II
Case 1 40 4 2 6
Case 2 50 4 2 6
Case 3 60 4 2 6
III
Case 1 40 4 2 6
Case 2 50 4 2 6
Case 3 60 4 2 6
IV
Case 1 40 4 2 6
Case 2 50 4 2 6
Case 3 60 4 2 6
V
Case 1 40 4 2 6
Case 2 50 4 2 6
Case 3 60 4 2 6
Technology (IJRASET)
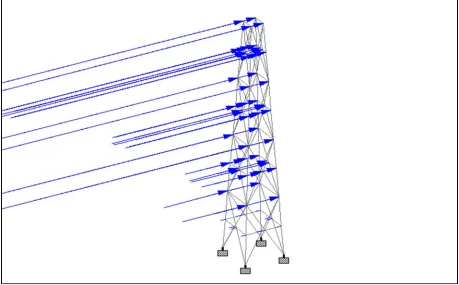
Fig. 1: Model of Transmission tower in STAAD.Pro
Application of Seismic Loads according to Zone II,III,IV & V on same sets of transmission line structures.
[image:5.612.77.536.404.689.2]Technology (IJRASET)
Load 6
X Y
Z
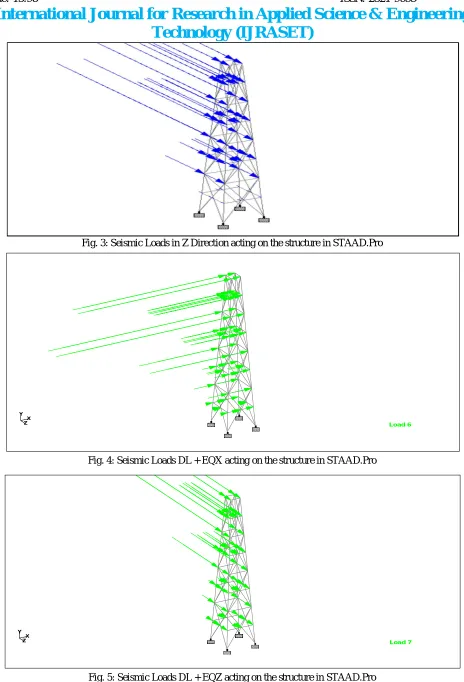
Fig. 3: Seismic Loads in Z Direction acting on the structure in STAAD.Pro
[image:6.612.74.538.35.717.2]Fig. 4: Seismic Loads DL + EQX acting on the structure in STAAD.Pro
Fig. 5: Seismic Loads DL + EQZ acting on the structure in STAAD.Pro Load 7
X Y
Technology (IJRASET)
Analysis considering different diaphragm models (12 cases mentioned above) used STAAD.Pro software. Results presented in the form of graphs and tables.
Parametric and comparative study of all cases in terms of maximum deflection, maximum support reaction, maximum support moment, axial stress and bending stress.
Fig.6: Flow chart of adopted methodology
III. RESULT AND DISCUSSION
The behavior of towers under different loading conditions has been analyzed for four seismic zones with different parameters. The START
SELECTION OF TRANSMISSION
TOWER
TRANSMISSION TOWER MODELING
VARITION IN HEIGHT
SEISMIC ZONES
ANALYSIS
IF ALL LOADS CONSIDERED
IF ALL GEOMETRY CONSIDERED
COMPARIVE STUDY AND RESULTS
STOP
Yes
No
Technology (IJRASET)
3.364 5.381
8.07 12.104 6.201 9.981 14.876 22.286 10.368 16.582 24.867 37.54 0 5 10 15 20 25 30 35 40
II III IV V
D e fl e c ti o n (m m ) Zones
Maximum deflection(mm) in all seismic zone
Maximum deflection(mm) in all seismic zone
Maximum deflection(mm) in all seismic zone
Maximum deflection for different zones and cases are given in Table 5 and shown in Fig.7. Table 5: Deflection for all zones of seismic
Maximum deflection(mm) in all seismic zone
Zones
Cases
case-1 case-2 case-3
II 3.364 6.201 10.368
III 5.381 9.981 16.582
IV 8.07 14.876 24.867
[image:8.612.76.537.100.443.2]V 12.104 22.286 37.54
Fig. 7: Deflection (mm) for all earthquake zones.
From Fig. 7, it is observed that deflection for 60m high transmission tower in seismic zone V is maximum than all seismic zones of 40m and 50m high transmission tower. Deflection increases linearly with respect to seismic zone for all the cases.
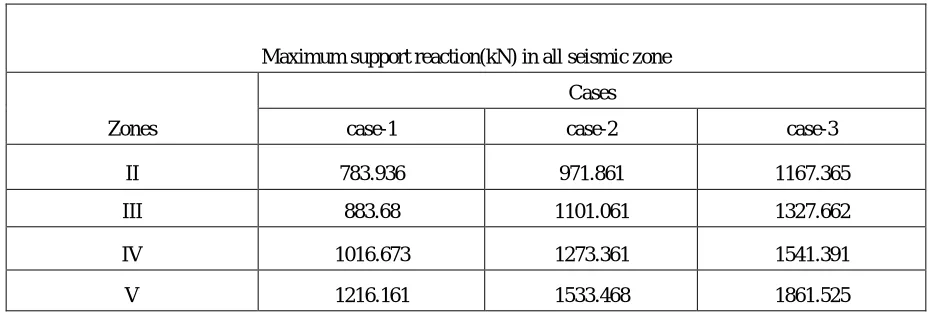
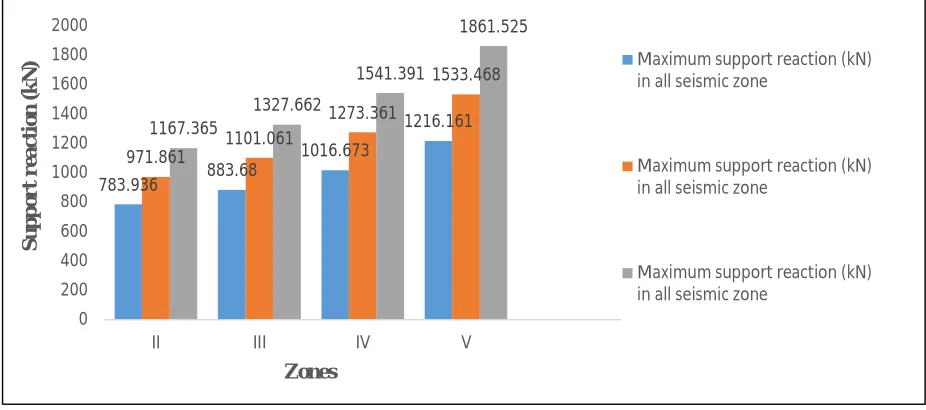
[image:8.612.73.542.549.706.2]Support reaction for all zones are given in Table 6 and shown in Fig. 8.
Table 6: Support reaction for all zones of seismic
Maximum support reaction(kN) in all seismic zone
Zones
Cases
case-1 case-2 case-3
II 783.936 971.861 1167.365
III 883.68 1101.061 1327.662
IV 1016.673 1273.361 1541.391
Technology (IJRASET)
783.936 883.68
1016.673
1216.161
971.861 1101.061
1273.361 1533.468 1167.365 1327.662 1541.391 1861.525 0 200 400 600 800 1000 1200 1400 1600 1800 2000
II III IV V
S u p p o r t r e ac ti o n (k N ) Zones
Maximum support reaction (kN) in all seismic zone
Maximum support reaction (kN) in all seismic zone
Maximum support reaction (kN) in all seismic zone
22.231 27.587
34.728
45.439
26.764 33.075
41.493 48.694 76.293 84.098 94.503 110.339 0 20 40 60 80 100 120
II III IV V
S u p p o r t m o m e n t (k N m ) Zones
Maximum support moment (kN-m) in all seismic zone
Maximum support moment (kN-m) in all seismic zone
[image:9.612.73.536.80.285.2]Maximum support moment (kN-m) in all seismic zone
Fig. 8: Support reaction (kN) for all seismic zones.
From Fig. 8, it is observed that support reaction for 60m high transmission tower in seismic zone V is maximum than all seismic zones of 40m and 50m high transmission tower. It can be observed that zone II for case 3 is equivalent to zone III for case 2.
[image:9.612.73.540.379.709.2]Support moment for all the seismic zones for all cases are given in Table 7 and shown in Fig. 9.
Table 7: Support moment for all zones of seismic Maximum support moment (kN-m) in all seismic zone
Zones
Cases
case-1 case-2 case-3
II 22.231 26.764 76.293
III 27.587 33.075 84.098
IV 34.728 41.493 94.503
Technology (IJRASET)
23.928 25.961
28.672
32.738
21.7 23.428
25.731 26.152
9.662 15.46 23.189 34.345 0 5 10 15 20 25 30 35 40
II III IV V
A x ial S tr e ss (N /m m 2) Zones
Maximum Axial stress(N/mm2) in all seismic zone
Maximum Axial stress(N/mm2) in all seismic zone
Maximum Axial stress(N/mm2) in all seismic zone
From Fig. 9, it is observed that support moment for 60m high transmission tower inseismic zone V is maximum than all wind zones of 40m and 50m high transmission tower. Support moment increases linearly with increase in tower height.
[image:10.612.74.538.140.517.2]Axial stress for all the zones and cases are given in Table 8 and shown in Fig. 10.
Table 8: Axial stress for all zones of seismic Maximum Axial stress(N/mm2) in all seismic zone
Zones
Cases
case-1 case-2 case-3
II 23.928 21.7 9.662
III 25.961 23.428 15.46
IV 28.672 25.731 23.189
[image:10.612.70.539.611.714.2]V 32.738 26.152 34.345
Fig. 10: Graphs of Axial stress for all zones of seismic.
From Fig. 10, it is observed that axial stresses for 60m high transmission tower in seismic zone V is maximum than all zones of 40m and 50m high transmission tower. Rate of increase of axial stress increases with increase in height.
Bending stress for all the zones are given in Table 9 and shown in Fig. 11.
Table 9: Bending stress for all zones of seismic.
Maximum Bending stress(N/mm2) in all seismic zone
Zones
Cases
case-1 case-2 case-3
II 13.061 20.349 23.088
III 20.323 21.444 23.147
IV 21.827 31.384 23.226
[image:10.612.70.540.612.713.2]Technology (IJRASET)
13.061
20.323 21.827
31.969
20.349 21.444
31.384
57.792
23.088 23.147 23.226 22.55
0 10 20 30 40 50 60 70
II III IV V
B e n d in g S tr e ss ( N /m m 2 ) Zones
Maximum Bending stress(N/mm2) in all seismic zone
Maximum Bending stress(N/mm2) in all seismic zone
[image:11.612.72.534.80.317.2]Maximum Bending stress(N/mm2) in all seismic zone
Fig. 11: Bending stress (N/mm2) for all seismic zones.
From Fig. 11, it is observed that bending stresses for 50m high transmission tower in seismic zone V is maximum than all zones of 40m and 60m height. Bending stress is minimum and constant for 60m height.
IV. CONCLUSIONS
The following are the salient conclusions of this study:
A. Deflection
Maximum deflection of tower which has 40m of height deviates between 3.3 to 12.2 mm, the tower which has 50m of height deviates between 6.2 to 22.3 mm and the tower which has 60m of height deviates between 10.3 to 37.6 mm, So it is clear that the deflection is critical for 60m high tower in all zones of seismic.
B. Support Reaction
Support reaction of tower which has 40m of height deviates between 783 to 1217 kN, the tower which has 50m of height deviates 971 to 1534 kN and the tower which has 60m of height deviates between 1167 to 1862 kN. It is clear that the support reaction for 60m high transmission tower in seismic zone V has larger value than 40 and 50m high transmission tower in all zones of seismic.
C. Support Moment
Support moment for the tower of 40m height deviates between 22 to 46 kN-m in all zones of seismic, the tower which has 50m of height deviates between 26 to 49 kN-m and the tower which has 60m of height, it’s support moment values deviate between 76 to 111 kN-m for all zones of seismic, So it is observed that the support moment values are critical for 60m high tower in seismic zone V.
D. Axial Stress
Technology (IJRASET)
between 20 to 58 N/mm2 in all zones of seismic and the tower which has 60m of height deviates between 22 to 24 N/mm2. It is observed that the bending stress value for 50m high tower in seismic zone V is critical than all the seismic zones of 40 or 60m high tower.
So, from the above results, it is clear that the 60m high tower is critical than 40m and 50m high tower in case of deflection, support reaction, support moment and also in the case of axial stress in seismic zone V, but for bending stress, 50m high tower is critical than 40m and 60m high tower in all seismic zones. This paper will help in understanding the effect of seismic load on tower structure by considering different seismic zones.
REFERENCES
[1] Alaa C. Galeb, Mohammed Khayoon Ahmed, Optimum Design of Transmission Towers Subjected to Wind and Earthquake Loading, Jordan Journal of Civil
Engineering, Vol. 7, No.1, pp. 70-92, (2013).
[2] Jithesh Rajasekharan, Vijaya,S, Analysis of Telecommunication Tower Subjected to Seismic & Wind loading, International Journal of Advancement in
Engineering Technology, Management & Applied Science, ISSN 2349-3224, Vol. 1, Issue 2, pp. 68-79, (2014).
[3] Shivam Panwar, Yogesh Kaushik, Anubhav Singh and Nikhil Sharma, Structural Analysis and Design of Steel Transmission Tower in Wind Zones II and IV-
A Comparative Study,International Journal of Engineering Technology, Management and Applied Sciences, ISSN 2349-4476, Vol. 4, Issue 5, pp. 168-177, (2016).
[4] Siddu Karthik C S, Static and Dynamic Analysis of Transmission Line Towers under Seismic Loads, International Journal of Engineering Research &
Technology(IJERT), ISSN: 2278-0181, Vol. 4, Issue 8, pp. 29-33, (2015).
[5] Srikanth L., Neelima Satyam D., Dynamic Analysis of Transmission Line Tower, International Journal of Civil, Environmental, Structural, Construction and
Architectural Engineering, Vol. 8, No. 4, pp. 434-437, (2014).
[6] Sumit Pahwa, VivekTiwari, HarshaJatwa, Analytical Study of Transmission Tower Subjected to Wind and Seismic Loads Using Optimization Technique,
International Journal of Emerging Technology and Advanced Engineering(IJETAE),ISSN 2250-2459, Vol.4, Issue 9, pp. 375-383, (2014).
[7] Yash N. Patel, Jasmin A. Gadhiya, Hitesh K. Dhameliya, Kosha S. Pachchigar, Comparitive Study of Transmission Line Tower in Different Seismic Zone With
Different Configuration, Scientific Journal of Impact Factor(SJIF): 3.314, E-ISSN(O) : 2348-4470, P-ISSN(P): 2348-6406, Vol. 2, Issue 12, pp. 205-213, (2015).
[8] Yusuf Mansur Hashim, Reliability Assessment, Static and Dynamic Response of Transmission Line Tower: A Comparative Study, 2nd International Conference
on Science, Technology and Managenent (ICSTM) 978-81-931039-6-8, pp. 1065-1077, (2015).
[9] Indian Standards, Use of structural steel in overhead transmission line tower, IS 802(part 1):1967, Bureau of Indian Standards, New Delhi.
[10] IS: 1893 (part 1): 2002, Indian Standard Criteria for Earthquake Resistant Design of Structures, Part 1: General Provisions and Buildings. Bureau of Indian
Standards, New Delhi.
[11] Indian Standards, General construction in steel, IS 800:2007, Bureau of Indian Standards, New Delhi.