5
IX
September 2017
Performance Analysis of Four Stroke Compression
Ignition Engine using Water Diesel Emulsion
Shree Dewangan1, Saurabh Kumar2
1
(MTech, Thermal engineering scholar, Mechanical engineering department, Raipur institute of technology, Raipur, India)
2
(Assistant Professor, Mechanical engineering department, Raipur institute of technology, Raipur, India)
Abstract: Increase in air pollution level causes too many health problems which increase concern of many researchers and scientists to find alternative fuel which reduce pollutant level and also give better thermal efficiency. In this regard a research has been carried out using water diesel emulsion which gives a better thermal efficiency with respect to diesel and also from heat balance sheet it has been found that less amount of heat is liberated from exhaust
Keywords: Diesel, Emulsion, Brake thermal efficiency, fuel consumption, brake power
I. INTRODUCTION
Emulsion is colloid of two or more immiscible liquids where one is in dispersed phase and another is in dispersion phase. Emulsified fuels are example of fuels which contain water mixed with combustible liquid for example water mixed with diesel or vice versa. Emulsified fuels can be further classified into two category micro emulsion and microemulsion. The property which differentiate both emulsion are their colloidal size and stability of emulsion.
Stabilizing agent of an emulsion is called emulsifier. Generally surfactant are used to provide stability to emulsion. Surfactants are basically surface active agents. There are three kind surfactant anionics cationics, nonionics and amphoterics.
Objective of this research is to find out comparison of diesel with that of water diesel emulsion according to their performance like brake thermal efficiency, specific fuel consumption and brake specific fuel consumption apart from this heat losses by engine have been also discussed when using diesel and emulsion.
II. EXPERIMENTAL SETUP
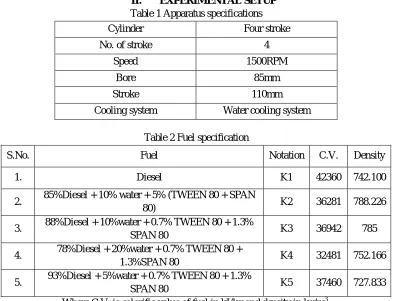
Table 1 Apparatus specifications Cylinder Four stroke
No. of stroke 4
Speed 1500RPM
Bore 85mm
Stroke 110mm
[image:2.612.110.503.420.721.2]Cooling system Water cooling system
Table 2 Fuel specification
S.No. Fuel Notation C.V. Density
1. Diesel K1 42360 742.100
2. 85%Diesel + 10% water + 5% (TWEEN 80 + SPAN
80) K2 36281 788.226
3. 88%Diesel + 10%water + 0.7% TWEEN 80 + 1.3%
SPAN 80 K3 36942 785
4. 78%Diesel + 20%water + 0.7% TWEEN 80 +
1.3%SPAN 80 K4 32481 752.166
5. 93%Diesel + 5%water + 0.7% TWEEN 80 + 1.3%
III. METHODOLOGY
Preparation of emulsion requires mixing of water in diesel with calculated amount of surfactants. Firstly 90% of diesel with 9.5% of water and 0.5 % of surfactant tween 80 is mixed with the help of magnetic stirrer with about 1000rpm and then after it is keep for one hour to check the stability of emulsion but after one hour water settles down due to its high density. So first attempt was failed then after surfactant with 1% of total tween 80 and span 80 was taken with mixture of 90 % diesel and 9% water and again to test its stability it is kept for one hour and after one hour it was found that the emulsion was stable. Now for performance evaluation purpose surfactant ratio were taken as 2% and 5% and quantity of water and diesel was altered. Variation in water content as 5% 10% and 20%. In above process water that was used was demineralized water. Figure 1 below shows water diesel emulsion of different combination. K2 contains 85%diesel with 10% water and 5% emulsion. K3 contains 88%diesel with 10% water and 2%surfactant. K4 contains 78% diesel with 20% water and 2% surfactant. K5 contains 93%diesel with 5% water and 2% surfactant.
Fig. 1 showing emulsions made by mixing different ratio of water, diesel and surfactant
IV. RESULTSANDDISCUSSION
A. Result In Tables
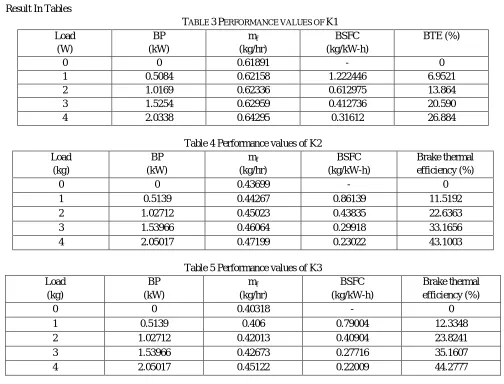
TABLE 3PERFORMANCE VALUES OF K1
Load (W) BP (kW) mf (kg/hr) BSFC (kg/kW-h) BTE (%)
0 0 0.61891 - 0
1 0.5084 0.62158 1.222446 6.9521
2 1.0169 0.62336 0.612975 13.864
3 1.5254 0.62959 0.412736 20.590
[image:3.612.151.464.216.322.2]4 2.0338 0.64295 0.31612 26.884
Table 4 Performance values of K2 Load (kg) BP (kW) mf (kg/hr) BSFC (kg/kW-h) Brake thermal efficiency (%)
0 0 0.43699 - 0
1 0.5139 0.44267 0.86139 11.5192
2 1.02712 0.45023 0.43835 22.6363
3 1.53966 0.46064 0.29918 33.1656
4 2.05017 0.47199 0.23022 43.1003
Table 5 Performance values of K3 Load (kg) BP (kW) mf (kg/hr) BSFC (kg/kW-h) Brake thermal efficiency (%)
0 0 0.40318 - 0
1 0.5139 0.406 0.79004 12.3348
2 1.02712 0.42013 0.40904 23.8241
3 1.53966 0.42673 0.27716 35.1607
4 2.05017 0.45122 0.22009 44.2777
K2 K3
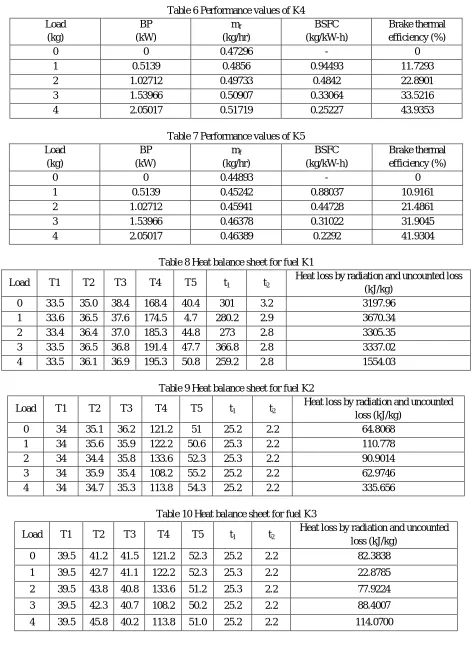
[image:3.612.53.557.359.743.2]Table 6 Performance values of K4 Load
(kg)
BP (kW)
mf (kg/hr)
BSFC (kg/kW-h)
Brake thermal efficiency (%)
0 0 0.47296 - 0
1 0.5139 0.4856 0.94493 11.7293
2 1.02712 0.49733 0.4842 22.8901
3 1.53966 0.50907 0.33064 33.5216
4 2.05017 0.51719 0.25227 43.9353
Table 7 Performance values of K5 Load
(kg)
BP (kW)
mf (kg/hr)
BSFC (kg/kW-h)
Brake thermal efficiency (%)
0 0 0.44893 - 0
1 0.5139 0.45242 0.88037 10.9161
2 1.02712 0.45941 0.44728 21.4861
3 1.53966 0.46378 0.31022 31.9045
4 2.05017 0.46389 0.2292 41.9304
Table 8 Heat balance sheet for fuel K1
Load T1 T2 T3 T4 T5 t1 t2
Heat loss by radiation and uncounted loss (kJ/kg)
0 33.5 35.0 38.4 168.4 40.4 301 3.2 3197.96 1 33.6 36.5 37.6 174.5 4.7 280.2 2.9 3670.34 2 33.4 36.4 37.0 185.3 44.8 273 2.8 3305.35 3 33.5 36.5 36.8 191.4 47.7 366.8 2.8 3337.02 4 33.5 36.1 36.9 195.3 50.8 259.2 2.8 1554.03
Table 9 Heat balance sheet for fuel K2
Load T1 T2 T3 T4 T5 t1 t2
Heat loss by radiation and uncounted loss (kJ/kg)
0 34 35.1 36.2 121.2 51 25.2 2.2 64.8068 1 34 35.6 35.9 122.2 50.6 25.3 2.2 110.778 2 34 34.4 35.8 133.6 52.3 25.3 2.2 90.9014 3 34 35.9 35.4 108.2 55.2 25.2 2.2 62.9746 4 34 34.7 35.3 113.8 54.3 25.2 2.2 335.656
Table 10 Heat balance sheet for fuel K3
Load T1 T2 T3 T4 T5 t1 t2
Heat loss by radiation and uncounted loss (kJ/kg)
0 39.5 41.2 41.5 121.2 52.3 25.2 2.2 82.3838
1 39.5 42.7 41.1 122.2 52.3 25.3 2.2 22.8785
2 39.5 43.8 40.8 133.6 51.2 25.3 2.2 77.9224 3 39.5 42.3 40.7 108.2 50.2 25.2 2.2 88.4007
Table 11 Heat balance sheet for fuel K4
Load T1 T2 T3 T4 T5 t1 t2
Heat loss by radiation and uncounted loss (kJ/kg)
0 36.1 53.4 36.3 135.7 58.3 25.2 2.2 836.971 1 36.1 47.3 37.0 136.5 47.2 25.3 2.2 377.573 2 36.1 47.8 36.5 127.7 47.6 25.3 2.2 1852.19 3 36.1 42.1 36.9 127.6 57.4 25.2 2.2 920.07 4 36.1 44.1 36.5 122.9 45.2 25.2 2.2 1409.93
Table 12 Heat balance sheet for fuel K5
Load T1 T2 T3 T4 T5 t1 t2
Heat loss by radiation and uncounted loss (kJ/kg)
0 34 35.1 36.2 121.2 51 25.2 2.2 1027.1 1 34 35.6 35.9 122.2 50.6 25.3 2.2 998.041 2 34 35.2 35.8 133.6 52.3 25.3 2.2 388.149 3 34 36.3 35.4 108.2 55.2 25.2 2.2 392.417 4 34 36.8 34.9 113.8 54.3 25.2 2.2 1872.05 Note: From table 8 to 12 unit of load and temperature is in kilogram and degree Celsius respectively.
[image:5.612.79.496.350.653.2]B. Graphical Analysis
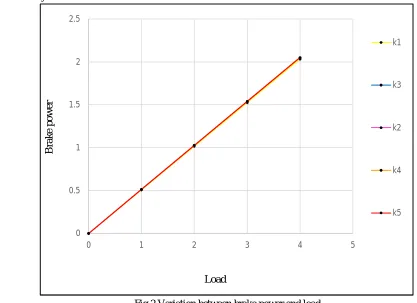
Fig.2 Variation between brake power and load
Figure 2 shows variation between brake power and load for diesel and different emulsions. As according to the graph above it is clearly visible that brake power is directly proportional to applied load. As the value of load increases brake power also increases.
0 0.5 1 1.5 2 2.5
0 1 2 3 4 5
B
ra
k
e p
o
w
er
Load
k1
k3
k2
k4
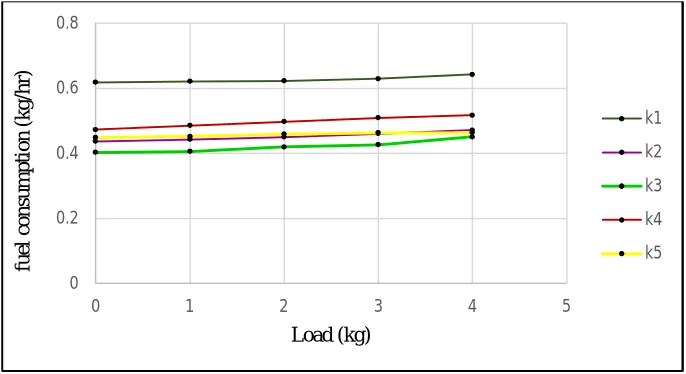
Fig. 3 Variation between fuel consumption and load
Figure 3 shows variation between fuel consumption and load for diesel (K1) and emulsions (K2 to K5). Diesel require more fuel as compare to emulsion which can be seen from above graph. Fuel K3 requires less fuel as compare to all other fuels. Apart from this as the load increases fuel consumption also increases as at higher load throttling power of engine increases.
Fig. 4 Variation between Brake specific fuel consumption and load
[image:6.612.137.479.534.672.2]As throttling of engine increases with respect to load brake specific fuel consumption decreases which can be seen from figure 4.
Fig. 5 Variation between Brake thermal efficiency and load
Brake thermal efficiency is more for fuel K3. So better performance will obtain from this fuel. Diesel have very low brake thermal efficiency. It means that 10% water with 2% surfactant will give best performance and as we increase water concentration brake thermal efficiency will fall accordingly.
0 0.2 0.4 0.6 0.8
0 1 2 3 4 5
fue l co n sum pt io n (kg/ h r) Load (kg) k1 k2 k3 k4 k5 0 0.2 0.4 0.6 0.8 1 1.2 1.4
0 1 2 3 4 5
B S F C (kg/ kW -h r) Load (kg) k1 k2 k3 k4 k5 0 10 20 30 40 50
0 1 2 3 4 5
V. CONCLUSION
Following conclusions can be drawn from above experiments
A. Comparing table 8 to table 12 for maximum load condition it can be concluded that minimum heat loss is obtained from fuel K3 (88% diesel with 10% water and 2% surfactant).
B. Maximum brake thermal efficiency has been obtained for fuel K3.
C. Minimum fuel consumption has been obtained for fuel K3.
VI. FUTURE SCOPE
Further possibilities in this research will be use of different type of surfactants with different combination of water. Exhaust gas analysis for different type of pollutants.
REFERENCE
[1] C.Y Lin, K.H Wang, Fuel 82, 1367–1375 (2003).
[2] E. A. Fahd ,Y. Wenming, P.S. Lee, S.K. Chou ,C.R. Yap, Appl Energy 102, 1042-1049 (2013). [3] T. Xuan-Thien, G. Jamil, 5th Asia Pacific Conference on Combustion, (2005).
[4] O. Armas, R. Ballesteros, F.J. Martos, J.R. Agudelo, Fuel 84, 1011–1018 (2005). [5] A. Alahmer, Energy Conversion and Management 73, 361-369 (2013).
[6] M. Yahaya Khan, Z. A. Abdul Karim, F.Y. Hagos, A. R. A. Aziz, I. M. Tan, TSWJ (2014). [7] M.J. Rosen, Surfactants and interfacial phenomenon. Wiley; (2004).
[8] I. Jeong, K.H Lee, J. Kim, J Mech Sci and Tech 22, 148–156, 2008. [9] A. Subramanian, Energy Conversion and Management 52, 849-857 (2011). [10] Y. Zeng and C.F. Lee, Proc. of the Combustion Institute. 31, 2185-2193 (2007). [11] K.C. Tsao, X. Yong, SAE, 891883 (1989).