5
IV
April 2017
Technology (IJRASET)
Model Development and Load Analysis of
Offshore Jacket Structure using
SAP2000
Bipasha Das1, Dr. Prashanth Janardhan2
1
B.Tech, Civil Engineering Department, Sikkim Manipal Institute of Technology, Sikkim Manipal University
2
Assistant Professor, Civil Engineering Department, National Institute of Technology Silchar
Abstract: This paper details the results obtained from static and dynamic analysis, considering both operational and ultimate limit state performance characteristics of a jacket platform, designed at Mumbai high basin. The existing platforms at Mumbai high region are affected by continuous sea state and operational state loading. So, it becomes a necessity that the structures design for the purposes should be a reliable one. The Static load and dynamic load analysis done in this study, using the SAP2000 v14 software helps to analyze and predict the performance of a typical jacket structure at Mumbai High, when subjected to various load cases which will help in future to design it properly and accurately.
In this paper various loads such as wave load, wind load both for airy and stokes law and earthquake load have been used to calculate the displacement and bending moment for design.
Keywords: Jacket structure, wave loading, seismic loading, API WSD 2000, Pierson-Moskowitz (P-M) spectrum, Morrison’s equation
I. INTRODUCTION
Offshore construction is the installation of structures and facilities in a marine environment, usually for the production and transmission of electricity, oil, gas and other resources. An oil platform, (offshore platform) is a large structure with facilities to drill wells, to extract and process oil and natural gas, and to temporarily store product until it can be brought to shore for refining and marketing.
Oil reserves are explored and exploited by offshore structures. Hence the main reason or we can say the driving force behind this technology of installation of offshore structure have come from the oil industry for the need of the hydrocarbons from the oil regions. It is also important for military and navigational purposes. The total number of offshore structures is increasing year by year on the bays, gulfs and oceans, which are mostly fixed type.
There are more than 9000 offshore structures in the world for drilling, preparing gas for the injection of gas and oil into the reservoirs, cleaning the disposed water into the sea and accommodating the staff. Recently many researchers have found out technique for controlling these massive structures because these structures are dynamically in contact with sudden seismic and continuous wave shocks. The analysis, design and construction of offshore structures compatible with the extreme offshore environmental conditions is a most challenging and creative task.
Offshore Jacket Platforms are normally designed using one of the following offshore design codes: API RP2A WSD (American Petroleum Institute 2000), API RP2A LRFD (American Petroleum Institute 1993) or ISO 19902 (International Standards Organization 2007). API RP2A-LRFD and ISO 19902 codes are limit state design based approaches for design of steel jacket platforms.
II. MODEL DATA
The platform considered in the study is a four legged production platform. Water depth at the location is 200 m. The platform is designed based on the API recommended criteria for 50 years return period. In the study a structure made of steel is used with fixed base for calculation. The type of steel used is A36. A36 has a density of 7,800 kg/m3Young’s modulus for A36 steel is
200 GPa, Poisson’s ratio of 0.26, shear modulus of 75 GPa. Total height of the structure is 250m. Bottom dimension is 110mX70m
at height 200m dimension is 50mX30m.At the top of the deck dimension is 60mX40m.
Technology (IJRASET)
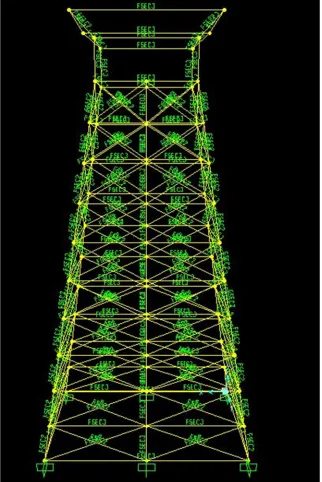
SAP2000 the structural members and nodes are given. [image:3.612.152.474.94.576.2]
Fig 1: Model in SAP 2000
III. LOADING CONDITION
A design approach that minimizes static load effects through judicious selection of the platform geometry is one of the keys to increased capability of platform. Static loads could be reduced through decreasing member sizes and through adjustment of the jacket geometry at the top load action zone, so that
Force cancelation could be used to advantage. The type of loads considered in the analysis (API RP 2A) includes the following:
A. Dead load (G)
B. Live load (Q)
C. Environmental loads (E) (wind /wave)
Technology (IJRASET)
E. Dead And Live Loads
Dead loads include all the fixed items in the platform deck jacket structure. Live loads are defined as the moving and temporary loads. Total loads considered for the analysis including dead and live loads is 20,000tonnes.
F. Wind Loads
American Petroleum Institute (API RP 2A) gives us a formula to calculate the wind force on offshore structures. The formula is as follows:
F=0.5ρCsAU2
F= wind force in kN Cs= shape coefficient
A= projected area in m2
U= sustained wind velocity in m/sec
For the analysis here wind speed 41.67m/sec in considered.
G. Wave Force
The first and actual way of establishing an ocean wave spectrum was carried out by Pierson and Moskowitz in the year 1964 and is widely accepted for the waves of fully developed sea.
From the P-M spectrum for the wind speed of 41.67m/s the estimated wave height 14.86m and wave period of 21.66m are considered for the analysis.
The determination of wave force acting on the structure is a very complex task.
Waves can be represented analytically by various theories. There are basic 3 forms of waves:
1) Sinusoidal Waves
2) Cnoidal Waves
3) Solitary Waves: Sinusoidal wave theory is generally used for deep water waves. In the study sinusoidal wave theory (Airy and 5th order stokes) are used to calculate the desired data. Wave load is calculated using Morrison formula:
Fx(t)=ρ*Cm*A*Ů+0.5ρ* Cd*D*U|U|
Where,
ρ = Density of water Cm= Mass coefficient
Cd = Drag coefficient
U = Velocity Ů = Acceleration
For the analysis here different wave height and wave periods have been considered The design wave height and wave period: 14.86m and 21.6sec
Low wave height and high wave period: 2m and 25sec High wave height and low wave period: 20m and 10sec
H. Seismic Force
In our study of the structure the analysis is being done using the response spectrum method in SAP 2000 v14 and modal mass analysis and the data used is of BHUJ Earthquake 26th January 2001. The response spectrum for the earthquake is given in Fig2.
Technology (IJRASET)
I. Software Used
The software used is SAP2000 v14 which uses finite element analysis. It is basically integrated software for structural analysis and design.
IV. RESULTS AND DISCUSSION
The analysis of the jacket platform is carried out for 200m water depth with different loading conditions as mentioned above. The deck weight is considered as 20,000 tones which is equally distributed on the top the structure. In this study the deflection and bending moment of the jacket platform are analyzed using SAP2000 v14.
A. Wave and Wind Response for the Structure
1) Airy Theory: The analysis of the structure is carried out for the wave and wind forces derived from P-M spectrum, swell wave and freak wave. Structure at 200m is subjected to a combined load of wave height 14.86m wave period 21.67sec and wind speed 41.67m/sec which are derived from P-M spectrum. The deflection of obtained is given for the wave forces in Fig3.
Fig3:Jacket platform deflection for combined wind and wave force
The maximum platform deflection is 9.2 mm at the jacket platform for the designed wave height 14.86m and wind speed 41.67m/sec.
Structure subjected to a combined load of wave height 2m wave period 25sec and wind speed 41.67m/sec the deflection obtained is given in Fig4.
Fig4:Jacket platform deflection for combined wind and wave force
Technology (IJRASET)
41.67m/sec.Structure subjected to a combined load of wave height 20m wave period 10sec and wind speed 41.67m/sec the deflection obtained is given in Fig5.
Fig5:Jacket platform deflection for combined wind and wave force
The maximum platform deflection is 14.2mm at the jacket platform for the freak wave of height 20m and wind speed 41.67m/sec.
B. Wave Load
The comparative study of all the three waves with respect to individual displacement is shown in Fig6.
Technology (IJRASET)
From both the conditions whether it is a combined load of wave and wind or individual wave load it is shown that the freak waves have the maximum displacement.
C. Stokes Theory (5th Order)
Structure is subjected with a load combination of wave and wind but in Stokes pattern.
Structure at 200m is subjected to a combined load of wave height 14.86m wave period 21.67sec and wind speed 41.67m/sec which are derived from P-M spectrum. The deflection of obtained is given for the wave forces in Fig7.
Fig7: Jacket platform deflection for combined wind and wave force
The maximum platform deflection is 9.6 mm at the jacket platform for the designed wave height 14.86m and wind speed 41.67m/sec.
Structure subjected to a combined load of wave height 2m wave period 25sec and wind speed 41.67m/sec the deflection obtained is given in Fig8.
Fig8: Jacket platform deflection for combined wind and wave force
The maximum platform deflection is 1.9 mm at the jacket platform for the swell wave height 2m and wind speed 41.67m/sec. Structure subjected to a combined load of wave height 20m wave period 10sec and wind speed 41.67m/sec the deflection obtained is given in Fig9.
Fig9: Jacket platform deflection for combined wind and wave force
Technology (IJRASET)
D. Wave Load
[image:8.612.220.399.580.703.2]The comparative study of all the three waves with respect to individual displacement is shown in Fig10.
Fig 10: Comparison of displacement between the different types of waves.
From both the conditions whether it is a combined load of wave and wind or individual wave load it is shown that the freak waves have the maximum displacement.
E. Calculation of Bending Moment
Bending moment as we know is very important for design so analyzing it should be done carefully.
F. Airy’s Theory
Structure when subjected to designed wave of wave height 14.86m and wave period 21.86sec and wind speed of 41.67m/sec the bending moment obtained is given in Fig11
Fig11:Bending moment for leg1
The maximum bending moment observed is 7769 KNm at the fixed end for designed wave
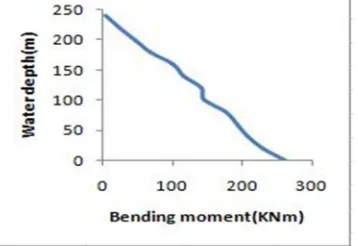
Structure subjected to a wave height 2m and wave period 25sec along with wind speed of 41.67m/sec experiences a bending moment illustrated in Fig12.
Technology (IJRASET)
The maximum bending moment observed is 261KNm at the base end for swell wave.Structure when subjected to a combination of wave height 20m and wave period 10sec and wind speed of 41.67m/sec the bending moment obtained is given in Fig13.
Fig13:Bending moment for leg1
The maximum bending moment observed is 7803KNm at the fixed base for freak wave. A comparative study of all the waves with respect to bending moment is given in Fig14.
Fig14: Comparative illustration of bending moment for different Waves
Thus from this comparison it is quite clear that the freak waves produces the maximum bending moment.
G. Stokes Theory (5th Order)
When the structure is subjected to Stokes pattern of waves it undergoes the following bending moment pattern.
The structure is subjected to a combined load of wave and wind with wave height to be 14.86m and wave period 21.6sec and a wind speed to be 41.67m/sec the bending moment will be as such Fig 15.
Technology (IJRASET)
The maximum bending moment is 7775KNm at the fixed base for the designed wave. [image:10.612.224.400.125.294.2]The structure is subjected to a combined load of wave height 2m for a period of 25sec and wind speed of 41.67m/sec the bending moment will be as Fig 16.
Fig 16: Bending moment for leg1
The maximum bending moment is 280KNm at the base for the swell wave.
[image:10.612.215.395.353.467.2]Structure subjected to a combined load of wave height 20m and wave period of 10sec and a wind speed of 41.67m/sec the bending moment is Fig17.
Fig17: Bending moment for leg1
The maximum bending moment is 7850KNm at base for the freak wave.
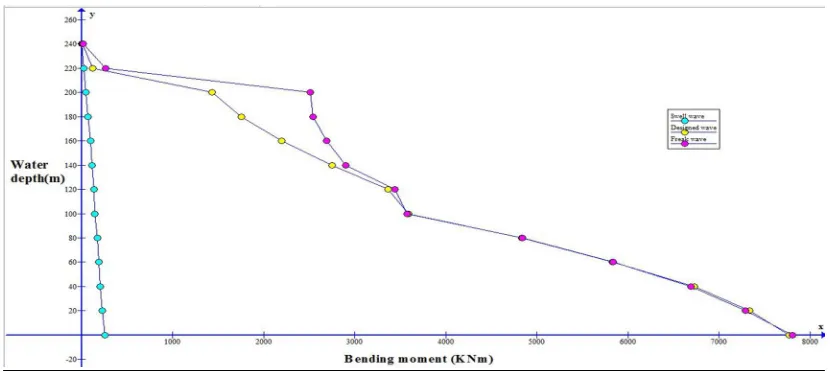
A comparative study of all the waves with respect to bending moment is given in Fig 18
[image:10.612.99.514.517.703.2]Technology (IJRASET)
From the above discussion it can be easily derived that the freak waves have the maximum bending moment. Thus the freak waves having the maximum wave height have the maximum displacement.
H. Seismic Analysis for the Structure
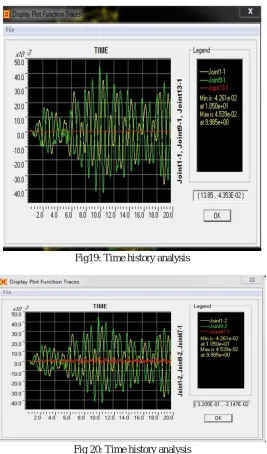
[image:11.612.174.441.170.624.2]Considering the structure on the Bombay high (zone III) which is near Bhuj the analysis has been done. It is known as Time history analysis. It is an important technique for structural seismic analysis especially when the evaluated structural response is nonlinear. To perform such an analysis, a representative earthquake time history is required for a structure being evaluated.
Fig19: Time history analysis
Fig 20: Time history analysis
In extreme cases, where structures are either too irregular, too tall or of significance to a community in disaster response, the response spectrum approach is no longer appropriate, and more complex analysis is required, such as non-linear static or dynamic analysis like in seismic performance analysis technique.
Technology (IJRASET)
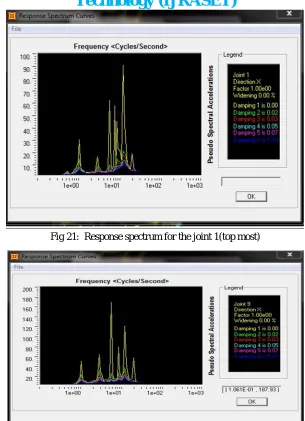
Fig 21: Response spectrum for the joint 1(top most)
Fig 22: Response spectrum for the joint 9(connection between deck-leg)
Fig 23: Response spectrum for the joint 47 (the joint just above the fixed base)
[image:12.612.166.444.518.677.2]Technology (IJRASET)
V. ACKNOWLEDGEMENT
I would like to express my sincere gratitude and appreciation to my parents for encouraging me to pursue in the field of research and development. I would like to bestow my earnest gratitude Dr. Prashanth Janardhan, Assistant Professor, National Institute of Technology, Silchar for providing me with all kinds of advice in the formulation and realization of this system.
REFRENCES
[1] API (American Petroleum Institute) recommended practice 2A-WSD (RP 2A-WSD) 21st edition (2000) for design of offshore structures, USA.