6
I
January 2018
979
©IJRASET (UGC Approved Journal): All Rights are Reserved
Lifetime Enhancement of Wireless Sensor Network
by Efficient Clustering Using Nature Inspired
Algorithm
Anjali Thakur1, Dr. Avtar Singh Buttar2 1, 2
Department of Electronics and Communication, I. K. Gujral Punjab Technical University, Jalandhar
Abstract: Wireless Sensor Network (WSN) is one of the most promising and leading technology which comprises of autonomous, multifunctional, self-governing battery powered devices known as sensor nodes. These sensor nodes are intelligent enough to collect information from the sensing environment. But there are various challenges in WSN and limited energy is one of them. Nature inspired algorithms provides best solutions to various challenges in WSN. This paper proposes a decentralized clustering algorithm for WSN based on the colonial behavior of social insects i.e. honey bee. In this paper we evaluate the clustering algorithm by using first order radio model. The purpose of this research paper is to form efficient clusters by optimal selection of cluster head on the basis of parameters such as distance, centrality, node degree and energy so that minimum energy for the transmission of data to the base station is consumed. Simulation results show that the proposed algorithm reduces the energy consumption and our network survives for a longer period of time.
Keywords: Wireless Sensor Network (WSN), Decentralized, Nature Inspired Algorithm, Honey bee, clustering
I. INTRODUCTION
Recent advancements in wireless electronics and sensing technology has led to production of low cost versatile wireless sensor nodes which has lower maintenance and deployment costs, longer lifetime and is adaptable to harsh environments [1].. Wireless sensor network consists of sensing, central processing unit and radio transceiver. In WSN a sensing technology is used in which sensor nodes or motes are used which are tiny, autonomous and compact devices. These motes are deployed in remote areas to get information of that area. These sensor nodes detect the phenomena, collect and process data and then transmit that sensed information to users [2]. With the growing demand and attention from various industries there is huge development of these low cost, low power, multipurpose, multifunctional sensors. Sensor nodes or motes are small in size. Sensor motes have the ability to gather the sensed data and process that data while in connection with other nodes in the network via, radio frequency channel. Besides having many applications in our homes, hospitals, WSNs also control our personal as well as professional lives [3]. They have lower maintenance and deployment costs, longer lifetime and are adaptable to harsh and unmanned areas [1].
II. WIRELESSSENSORNETWORKS
980
©IJRASET (UGC Approved Journal): All Rights are Reserved
Figure1 Components of Wireless Sensor Network
III.CLUSTERINGANDCOMPUTATIONALINTELLIGENCETECHNIQUES
A. Clustering Techniques in WSN
The process in which sensor nodes are grouped together is called clustering. In clustering cluster head is responsible for collection of information from cluster members and forward it to the base station. Most common clustering techniques fall under the categories of centralized and decentralized clustering algorithms. Decentralized clustering algorithms are more practical as compared to centralized clustering algorithms because it is not convenient to control large number of nodes at centre [13]. Depending on cluster formation criteria and parameters used for CH election the above clustering algorithms can be further divided into sub-categories as
probabilistic and non-probabilistic clustering algorithms. Low Energy Adaptive Clustering Hierarchy Algorithm (LEACH)[4],
Power Efficient Gathering In Sensor Information System (PEGASIS)[5], Power Efficient Data Gathering and Aggregation Protocol( PEDAP) [6] falls under category of probabilistic clustering algorithm while Highest Connectivity Cluster Algorithm (HCC) [7], Weight Based Clustering Algorithm(WBC) [8] , Genetic Algorithm [9] and Social insect colony falls under non-probabilistic algorithms.
B. Computational Intelligence in WSN
Computational Intelligence (CI) has been successfully used in recent years to address various challenges in WSN such as data aggregation, energy consumption, security, optimal deployment and localization. It provides adaptive mechanisms that exhibit intelligent behaviour in complex and dynamic environments in WSNs [10]. Different techniques are proposed by different researchers few are as follows, Social Insect Colony [11], Artificial Neural Network [12], Genetic Algorithm [13], Particle Swarm Optimization [14], ANTCLUST [15].
IV.PROPOSEDSYSTEM
Sensor nodes are constrained in terms of energy and capacity limits. So, they require proper administration so that power can be utilized evenly. So, we proposed a technique inspired by the colonial behaviour of honey bee which enhances the network lifetime by efficient clustering.
981
©IJRASET (UGC Approved Journal): All Rights are Reserved
A. Energy calculation
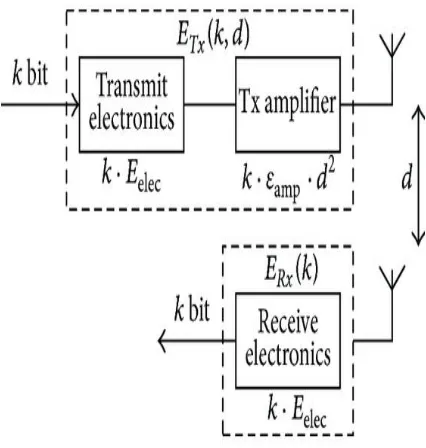
[image:4.612.205.418.126.350.2]To utilise the energy efficiently is one of the most challenging issue in wireless sensor network. In the proposed technique we computed energy by using first order radio model.
Fig 2 First Order Radio Model
Most of the energy is consumed in sensing activities in the network, processing the data, communicating with other nodes and transmission of collected information to the base station. The energy consumption of transmitting a k- bit packet at a distance d can be expressed as follows as per first order radio model.
(1) If d>do, distance parameter becomes 4 times of the original distance
If d<=do, distance parameter becomes 2 times of the original distance
B. Mathematical Model
Distance between the nodes is calculated by using Euclidean distance formula. Let us suppose we have two nodes i and j located at X and Y axis.
The distance between these two nodes is as follows
ds(i,j) =sqrt((X(i) - X(j))^2 + (Y(i) - Y(j))^2) (2)
where i, j are node numbers . After distance calculation, we will focus on other parameter that is the centrality of nodes and is defined as the parameter which is used to find the closeness of node. It is calculated by finding average of all distances and is inversely proportional to lifetime of network. Node degree is also calculated by counting the no. of nodes within a range of specific Objective function=(inverse of distance × inverse of centrality × node degree × energy) (3)
After maximising the objective function we will have a maximum value for a node. If two or more than two nodes having same maximum value of objective function then the node having lowest ID number will be selected as a cluster head and the nodes lying within the 13m range of that node will be the cluster members of the cluster head and a cluster is formed. The cluster formation process will continue until the system is not dead or energy of each node is not equal to zero.
C. Flow chart
982
[image:5.612.159.459.85.480.2]©IJRASET (UGC Approved Journal): All Rights are Reserved
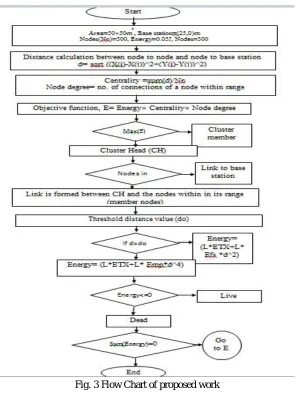
Fig. 3 Flow Chart of proposed work
V. PERFORMANCEANALYSIS
Simulation setup includes parameters for sensor field with area in which nodes are to be deployed, base station location, initial energy of each node and no. of bits to be transmitted. Initially we plot a network of 300 nodes deployed randomly in 50×50 m2 area with each node having initial energy 0.05 J. The base station was located at location (x=25m, y=0m). Energy consumed in radio electronics was set to 50 nJ/bit/m2. If distance between nodes is less than 38m then for radio transmitter 10 pJ/bit/m2 energy is set and if distance is greater than threshold distance than 0.0013 pJ/bit/m4 energy is set. The energy used for data aggregation purpose is 5 nJ/bit/signal
[image:5.612.149.460.585.716.2]983
©IJRASET (UGC Approved Journal): All Rights are Reserved
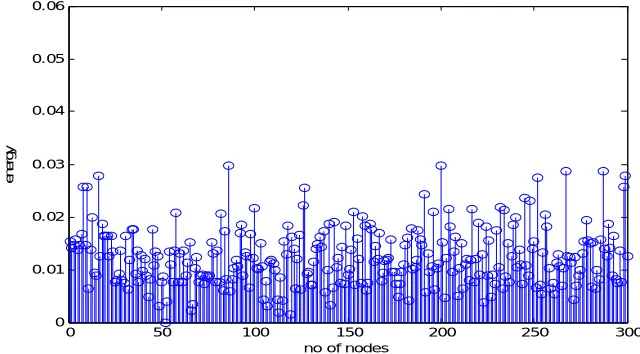
[image:6.612.117.488.90.261.2]The initial energy of all nodes is 0.05 J and stem plot of initial energy is as below
Fig. 5 Stem plot of initial energy(0.05J)
Cluster is organized in the form of concentric circles with cluster head at the center and surrounded by the cluster members and final topology of clusters after one round is as follows Here we have 12 clusters in first round. The total cluster formation after one round is illustrated in the figure shown next.
[image:6.612.148.447.318.487.2].
Fig. 6 Final topology of clusters after 1st round
In our proposed technique first node diesat 178 round and it takes 263 rounds for system to be dead.
0 50 100 150 200 250 300
0 0.01 0.02 0.03 0.04 0.05 0.06
no of nodes
e
n
e
rg
y
[image:6.612.138.458.533.710.2]984
©IJRASET (UGC Approved Journal): All Rights are Reserved
0 50 100 150 200 250
0 0.01 0.02 0.03 0.04 0.05 0.06
Residual Energy V/s rounds
No. of rounds
[image:7.612.152.441.74.458.2]R e s id u a l E n e rg y i n J BS 101
Fig. 8 Graph of Residual energy v/s No. of rounds
0 50 100 150 200 250
0 50 100 150 200 250 300
live nodes V/s rounds
No. of rounds
N o . o f L iv e n o d e s
Fig. 9 Graph of live nodes v/s No. of rounds
Simulation results are given for the proposed clustering technique based on colonial behavior honey bee along with the results of average energy consumption in different cases
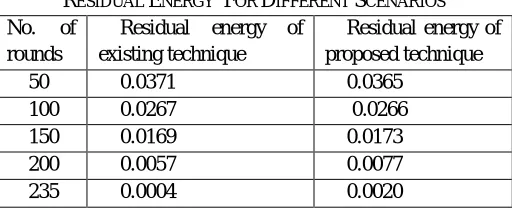
TABLEI
RESIDUAL ENERGY FOR DIFFERENT SCENARIOS
No. of
rounds
Residual energy of existing technique
Residual energy of proposed technique
50 0.0371 0.0365
100 0.0267 0.0266
150 0.0169 0.0173
200 0.0057 0.0077
235 0.0004 0.0020
So, the proposed technique is energy efficient and hence, the lifetime of WSN is improved with the execution of proposed approach.
VI.CONCLUSIONS
[image:7.612.179.435.530.636.2]985
©IJRASET (UGC Approved Journal): All Rights are Reserved
techniques for wireless sensor network based on colonial behavior of honey bee. It aimed to propose a clustering technique based on the nature inspired algorithm in order to increase the performance of the network. Simulation demonstrated the execution of the proposed work. The algorithm makes the framework energy efficient and furthermore improves the lifetime of the network by forming energy efficient clusters and hence enhances the network lifetime.
With the achievement in enhancing the lifetime of WSN, in any case, some exploration work still needs to be done.
1) Hybridization of two or more clustering techniques can result in reduced complexity.
2) Sensor nodes are stationary so applicable for stationary sensing not for tracking dynamic phenomenon, so mobile nodes can be
taken into consideration
3) Other parameters can be taken into consideration like quality of service, received signal strength, load balance among cluster
heads, inter-cluster communication among sensor nodes to enhance the lifetime of network
4) Cluster heads having no cluster members can be connected to nearest node instead of directly connecting to base station.
REFERENCES
[1] JS. Zhang, H. Zhang, "A review of wireless sensor networks and its applications," IEEE International Conference on Automation and Logistics, Zhengzhou, pp: 386-389, 2012
[2] J. Yick, B.Mukherjee, D. Ghosal,”Wireless sensor network survey”, Elsevier, Computer Networks, vol-52, pp-2292-2330, 2008
[3] I. F. Akyildiz, W. Su, Y. Sankarasubramaniam, E. Cayirci, “Wireless Sensor Networks :A survey”, Elsevier, Computers Networks, vol. 38, pp. 393-422,2002 [4] W. R. Heinzelman, A. Chandrakasan and H. Balakrishnan, "Energy-efficient communication protocol for wireless microsensor networks”, Proceedings of the
33rd Annual Hawaii International Conference on System Sciences, vol. 2, pp: 10, 2000
[5] S. Lindsey and C. S. Raghavendra, “Pegasis: Power-efficient gathering in sensor information systems,” in Proc. IEEE Conf. Aerosp., Big Sky, MT, vol. 3, pp. 1125–1130. Mar. 2002
[6] H. Ö. Tan ,“Power efficient data gathering and aggregation in wireless sensor networks,” ACM SIGMOD Record, vol. 32, no. 4, pp. 66–71, Dec. 2003. [7] S. Banerjee, S. Khuller,“A Clustering Scheme for Hierarchical Control In Multi-Hop Wireless Networks”, in Proceedings of 20th Joint Conference of the
IEEE Computer and Communications Societies (INFOCOMŠ 01), Anchorage, AK, April 2001.
[8] M. Chatterjee, S. K. Das, D. Turgut,“WCA: A Weighted Clustering Algorithm for Mobile Ad Hoc Networks”, Cluster Computing 5, Kluwer Academics Publishers, pp: 193-204, 2002
[9] S. Hussain, A. W. Matin, O. Islam, “Genetic Algorithm For Energy Efficient Clusters In Wireless Sensor Networks”, Seventh International Conference On Information Technology, 2007.
[10] C. Chong, S. P. Kumar, “Sensor Networks: Evolution, Opportunities, and Challenges”, Proceedings Of The IEEE, vol. 91, no. 8, pp: 1247-1256, August 2003
[11] C.T. Cheng, C.K. Tse, C.M. Lau, “A Clustering Algorithm for Wireless Sensor Networks Based On Social Insect Colonies”, IEEE Sensors Journal, vol. 11, no. 3, March 2011
[12] B. Yegnanarayana, ”Artificial neural networks,” PHI Learning Pvt. Ltd., 2004.
[13] L. Schmitt “Theory of genetic algorithms," Theoretical Computer Science, vol. 259, no. 1-2, pp. 1-61, May 2001.
[14] R. Eberhart and Y. Shi, “Particle swarm optimization:developments, applications and resources," IEEE Proceedings of the 2001 congress on evolutionary computation, vol. 1. , pp. 81-86 Piscataway, NJ, USA, 2001.