M E T H O D
Open Access
DESE: estimating driver tissues by selective
expression of genes associated with complex
diseases or traits
Lin Jiang
1,2†, Chao Xue
1,3†, Sheng Dai
1, Shangzhen Chen
1, Peikai Chen
4, Pak Chung Sham
4, Haijun Wang
2*and
Miaoxin Li
1,3,4*Abstract
The driver tissues or cell types in which susceptibility genes initiate diseases remain elusive. We develop a unified framework to detect the causal tissues of complex diseases or traits according to selective expression of disease-associated genes in genome-wide association studies (GWASs). This framework consists of three components which run iteratively to produce a converged prioritization list of driver tissues. Additionally, this framework also outputs a list of prioritized genes as a byproduct. We apply the framework to six representative complex diseases or traits with GWAS summary statistics, which leads to the estimation of the lung as an associated tissue of rheumatoid arthritis.
Keywords:Tissue-selective expression, Disease driver-tissues, Susceptibility genes, Gene-based association, Genome-wide association study
Background
Tissue selectivity is an important characteristic of many complex diseases or traits [1]. A complex phenotype often involves multiple related tissues, some of which are
impli-cit [2]. Unfortunately, our current knowledge on the
causal tissues of complex diseases is often limited in clin-ical observations. For example, it is certain that the brain must be a relevant organ of schizophrenia. However, as human brains consist of multiple heterogeneous regions, it is crucial to know which regions are the actual drivers [3]. Human height is another typical example. It is gener-ally known that cell proliferation in multiple tissues (e.g., skeletal and cardiac muscle) may contribute to the devel-opment of human height [4]. But it is unclear which tis-sues are primarily more important for the development of height. For most of human diseases and traits, the primary driver tissues remain elusive [5].
The pathology of tissue selective may be attributed to the selective expression of their susceptibility genes [6,
7]. Many studies showed that disease causal genes tend
to have elevated selective expression in the pathogenic tissues [1,6], implicating a basis for the tissue selectivity of diseases. Analyses of genes’ selective expression
pro-files can expand the knowledge on human diseases [8]
and even can facilitate characterizing new causal genes
[9]. Recently, Ongen et al. proposed to estimate the
causal tissues for complex traits and diseases by measur-ing the genome-wide association study (GWAS)-associ-ated variants’ eQTL activity in different tissues [10]. Finucane et al. also developed a method to estimate disease-relevant tissues according to heritability
enrich-ment in specifically expressed genes by
linkage-disequilibrium (LD) score regression approach [11]. But neither of the methods directly employs the quantity of genes’ selectivity expression for driver-tissue estimation nor do they directly characterize susceptibility genes based on the estimation.
Tissue-selective expression refers to much higher or lower expression of a gene in one or some minority tissues compared to majority tissues [12]. However, it is difficult to quantify the relative difference due to ambiguous boundaries between the minority and the majority in
© The Author(s). 2019Open AccessThis article is distributed under the terms of the Creative Commons Attribution 4.0 International License (http://creativecommons.org/licenses/by/4.0/), which permits unrestricted use, distribution, and reproduction in any medium, provided you give appropriate credit to the original author(s) and the source, provide a link to the Creative Commons license, and indicate if changes were made. The Creative Commons Public Domain Dedication waiver (http://creativecommons.org/publicdomain/zero/1.0/) applies to the data made available in this article, unless otherwise stated. * Correspondence:[email protected];[email protected]
†Lin Jiang and Chao Xue wish it to be known that, in their opinion, the first
two authors should be regarded as joint first authors.
2
Department of Pituitary Tumour Center, The First Affiliated Hospital, Sun Yat-sen University, Guangzhou 510080, China
1Zhongshan School of Medicine, Center for Precision Medicine, Sun Yat-sen
University, Guangzhou 510080, China
practice. There have been several methods for detecting tissue-selective expression of genes (see method descrip-tion in the review [13]). Most early methods are omnibus tests and can only tell whether a gene has overall selective expression [14,15], and most recent methods are under-powered to detect selective expression at individual tissues when there is more than one tissue with selective expres-sion [16]. Meanwhile, these ever-increasing transcriptomic resources [17–21] (including GTEx) are calling for more powerful selective expression measures and more studies on tissue-selective pathology of human diseases.
In this study, we proposed a unified framework to esti-mate driver tissues or cell types of complex diseases or traits based on selective expression of phenotype-associated genes of GWAS. After investigating the select-ive expression in GTEx Project [20] by a new measure, we further applied this framework to identify potential driver tissues of six representative complex phenotypes with GWAS summary statistics and investigated how the prior-itized tissues can help enhance detection of susceptibility genes in secondary analyses of GWAS data. For simplicity, being tissue selective means being tissue- or cell-type se-lective throughout the paper.
Results
The proposed framework of estimating driver tissues and its robustz-score for selective expression
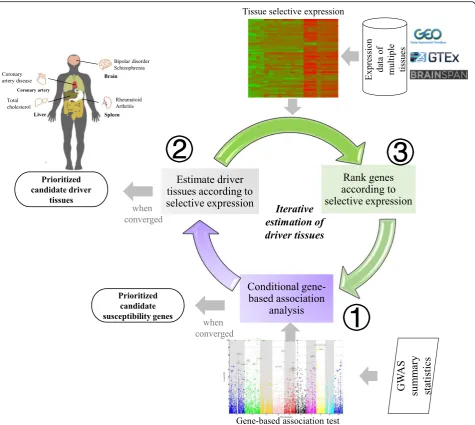
The framework, named driver-tissue estimation by select-ive expression (DESE), aims to estimate drselect-iver tissues by tissue-selective expression of phenotype-associated genes in GWAS (see the workflow in Fig.1). The assumption is that the tissue-selective expression of causal or susceptibil-ity genes indicates the tissues where complex phenotypes happen primarily [1], which are called driver or causal tis-sues. Therefore, a driver tissue is very likely to be enriched with selective expression of susceptibility genes of a phenotype. The framework requires two types of input data, gene expression values of multiple tissues and GWAS summary statistics or associationpvalues at vari-ants for a tested phenotype. The expression values at genes and transcripts or even exons can be used for the estimation. The GWASpvalues are used to detect suscep-tibility genes by a conditional gene-based association test we published recently [22]. The framework has three com-ponents running iteratively and converges when statistical pvalues of estimated driver tissues become stable (see the workflow in Fig.1). A byproduct of the framework is a list of prioritized genes which have both significant selective expression in the estimated driver tissues and significant conditional gene-basedpvalues for the tested diseases or traits. DESE has been implemented into our platform KGG (see the graphic interface in Additional file1: Figure S8),http://grass.cgs.hku.hk/limx/kgg/.
A critical datatype of the unified estimation framework is the tissue-selective expression. We proposed a measure (named robust-regressionz-score) of selective expression by extending the Huber robust linear regression. The method fits a robust line for ranked expression values of genes to calculate expression deviation and integrates ex-pression variation to measure selective exex-pression (see de-tails in the “Methods”section). Under null hypothesis, it
producespvalues approximately under uniform
distribu-tion (see the QQ plots in Addidistribu-tional file1: Figures S2 and S3), which will greatly facilitate statistical inference of se-lective expression. Extensive computer simulations show that the robust-regressionz-score is more powerful than the conventional z-score when there are multiple select-ively expressed tissues (Additional file 1: Table S1). We also provide a webserver for an online query of the robust selective expression of genes in different tissues or cell types,http://grass.cgs.hku.hk/limx/rez/.
Tissue-selective expression profiles in 50 tissues produced by the robust-regressionz-score
The robust-regression z-score approach was applied to
generate tissue-selective expression profiles by using RNA-Seq data from GTEx project (V7) [20] after stringent
quality control (see details in the “Methods” section).
selectively expressed genes which were missed by the usage of gene-level expression (Additional file 1: Table S5). Although the conservative Bonferroni correction for multiple transcripts of a gene may lead to the missing of some selectively expressed genes, the unique genes select-ively expressed according to transcript-level expression were still on average 5.5 times more than that according to gene-level expression in the 50 tested tissues.
Estimate driver tissues in six complex diseases/traits
Based on the selective expression, we then applied DESE to estimate driver tissues with the usage of public available GWAS summary statistics. Six representative complex diseases/traits were used as proof-of-principle examples.
Schizophrenia
We usedpvalues from a large-scale Meta-GWAS study
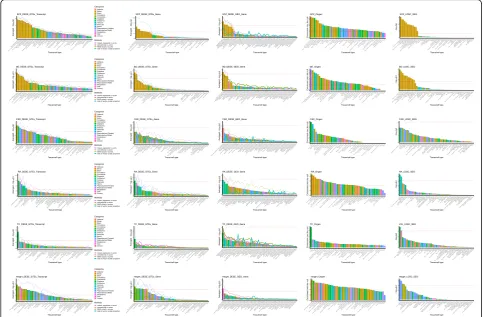
[23] to estimate driver tissues of schizophrenia by DESE with selective expression. While consistent with the known biology that the top 10 tissues are all brain re-gions (see details in Fig.3), there were several interesting points in the results. First, the statistical significance of estimated driver tissues based on transcript-level select-ive expression was much higher than that based on gene-level selective expression. For example, thepvalue of the top tissue according to the transcript-level select-ive expression by the robust-regressionz-score was 5.3E −13 while that according to gene-level selective
expres-sion was only 2.0E−5. This pattern was also true when
[image:3.595.62.538.87.512.2]selective expression was measured by three alternative
methods, conventional z-score, MAD robust z-score,
and ratio of vector-scalar projection. Second, the ranking order of the prioritized tissues by the four different mea-sures of selective expression was similar generally al-though the significance level varied. With the gene-level selective expression, the ratio of vector-scalar projection measure led to the highest significance level as small as
1E−10. The most significant tissue by the proposed
robust-regression z-score and conventional z-score only
achieved the p value 2.0E−5 and 4.8E−5 respectively.
The robustz-score by MAD achieved the lowest
signifi-cance level. With the transcript-level selective expres-sion, the pattern was similar in which the ratio of vector-scalar projection measure achieved the highest significance level among the four measures. Because, however, there were also fluctuations in the ranking order according to different selective expression mea-sures, we produced a combined ranking by averaging the -log(p) of the four selective expression measures. The top 2 estimated driver tissues according to both gene and transcript levels of selective expression were the frontal cortex and anterior cingulate cortex. It has been widely accepted that the frontal cortex [24] and anterior cingulate cortex [25] are critical brain regions for schizo-phrenia. Meanwhile, it should also be noted that most brain regions (e.g., nucleus accumbens and amygdala) are significant. A quick literature search in the NCBI PubMed database showed these estimated brain regions were supported by numerous published papers, which suggests DESE produced correct and consistent results for this complex brain disorder.
Bipolar disorder (BD)
For bipolar disorder, we used the summary statistics from a GWAS dataset containing 20,129 BD cases and 54,065 control cases [26]. Again, the transcript-level selective expression led to higher statistical significance than the
gene-level selective expression (Fig. 3). With the
transcript-level selective expression, the proposed
robust-regressionz-score produced the smallestpvalue
among the four selective expression methods. However, probably due to fewer genuine susceptibility genes in this GWAS with smaller sample size, the statistical sig-nificance of prioritized tissues was less than that of schizophrenia in general. The top estimated driver tis-sues based on the transcript- and gene-level selective expression were the cerebellar hemisphere (p= 1.3E−09
and 9.0E−06 respectively according to the
robust-regression z-score). There have been many studies
implicating the cerebellum as a causal region of BD (e.g., [27–29]. The frontal cortex and anterior cingulate cortex were ranked as the second and third driver brain regions, at which the transcript-level selective expres-sion by the robust-regresexpres-sion z-score led to significant pvalues (1.6E−6 and 2.4E−5). Note the two regions were ranked as the top driver brain regions of schizophrenia in above analysis. The common driver brain region is con-sistent with the high comorbidity and common genetic determinants of the two brain disorders [30]. Besides the three significant brain regions, there were also several other significant regions for BD, including the hypothal-amus [31] and basal ganglia [32]. The consistency of the estimated brain tissues and known biology of this brain disease suggests the effectiveness of DESE.
[image:4.595.64.538.87.313.2]Coronary artery disease (CAD)
Coronary artery disease causes impaired blood flow in the arteries that deliver blood from the heart to other body parts [33]. As expected, the coronary artery was re-ported as the top tissue according to the combined rank-ing at both gene and transcript levels (see details in Fig. 3). Meanwhile, the transcript-level selective expres-sion led to a higher statistical significance than the gene-level (4.3E−6 vs. 9E−4) by the robust-regressionz-score at the coronary artery. We also found that the aorta and tibial artery had significantpvalues (1.4E−4 and 6.1E−4) for CAD, probably because CAD-associated genes were also selectively expressed among different types of artery. It should be noted that the adipose tissue was prioritized as the fifth driver tissue with significant p value (5E−5
according to the proposed robust-regression z-score) by
transcript-level selective expression, which is consistent with the studies suggesting the relevance between adi-pose tissues and CAD [34–36]. Golia et al. reviewed the
role of adipocytokines as a possible link between obesity and vascular disease recently [34], suggesting the pos-sible pathogenic mechanisms of adipose tissues in CAD. Interestingly, some of the female reproductive organs [such as the ovary (p= 6.1E−6) and uterus (p= 5.2E−5)]
and adrenal gland (p= 1.7E-5) were also estimated as
significant driver tissues of CAD. Although epidemio-logic studies have reported the relatedness between ovary disease, uterine disease, adrenal insufficiency and CAD, or other cardiovascular diseases respectively [37–
39], the underlying genetic mechanism has not been
clear yet. The estimated causal tissues of CAD may shed some insights into the mechanism.
Rheumatoid arthritis (RA)
RA is a common autoimmune disease mainly attacking the joints [40]. Consistent with the pathology of auto-immune disease, two tissues among the top 5 driver
tis-sues fell into the immune system (Fig. 3), spleen and
[image:5.595.56.542.89.406.2]lymphocytes (p= 7E−8 and 1.3E−6 respectively
accord-ing to the proposed robust-regression z-score at the
transcript level). As a non-immune tissue, the lung was prioritized as the second significant driver tissue (p= 4.2E−9) according to the robust-regressionz-score at the transcript level. Demoruelle et al. recently reviewed the role of the lung in the pathogenesis of RA [41]. Multiple studies have identified a high prevalence of lung disease, both airways and parenchymal disease, in subjects with clinically classifiable RA. Demoruelle et al. proposed a model of the role of the lung in pathogenesis of RA, which basically suggested the RA-related autoantibodies
may be initiated from lung autoimmuneresponse [41].
While confirming the strong associations between the lung and RA, the selective expression of RA associated genes in lung from our analysis may also provide new insights into the underlying mechanism. In addition, the
ileum and transverse colon had significant p values for
RA (5.5E−11 and 5.2E−10 respectively according to the robust-regression z-score at the transcript level), which is also consistent with the previous study showing the high prevalence of ileocolonic abnormality in RA [42].
Total cholesterol (TC)
For a complex clinical trait, TC, our analysis detected the liver as the most significant tissue. This is consistent with known knowledge that the liver is responsible for 80% of the endogenous cholesterol synthesis. We noticed that the significance level of the second tissue decreased substan-tially (p= 6.9E−8 vs. 3.3E−5 according to the proposed robust-regressionz-score at the transcript level, see details in Fig.3), which suggests that the liver is the major driver tissue for total cholesterol. The lung and spleen were also estimated as significant driver tissues (p= 3.3E−5 and 3.5E −5 respectively according to the robust-regressionz-score at the transcript level) and have been shown to be in-volved in lipid metabolism [43,44].
Height
For the anthropometric trait, height, 27 significant tis-sues (p< 10−3) were detected according to the selective expression by the robust-regression z-score at the tran-script level (see details in Fig.3), which implies complex biological mechanisms in the development of human height. The most significant tissue was fibroblast, which is the most common cell type of connective tissue in mammals. Consistent with our results, several studies have also reported connective tissue as the most enriched tissue type for height [45, 46]. Besides the fibroblast cell, the top 10 driver tissues include the car-diovascular tissues (i.e., heart-atrialappendag, artery-coronary, artery-aorta, artery-tibial), esophagus, adipose, lung, and uterus, which may provide some new insights into the mechanism of height.
Validate estimated driver tissues by existing tools
We first validated the above estimated driver tissues with two existing tools, Ongen et al. [10] and LDSC-SEG [11]. The two tools estimated driver tissues based on different techniques (see details in the“Methods” section). We as-sume that the driver tissues replicated by independent ap-proaches are more likely to be true. Figure3visualizes the validation and comparison results of the three tools.
Schizophrenia
Among the top 10 significant driver tissues of schizophre-nia by Ongen et al., six were sub-brain regions. They are brain frontal cortex_BA9, brain anterior cingulate cortex_ BA24, brain putamen basal ganglia, brain hippocampus, brain cerebellar hemisphere, and brain hypothalamus. Five out of the six (except for the brain cerebellar hemisphere) were also among the top 10 estimated significant driver tis-sues by DESE. Interestingly both tools ranked the brain frontal cortex (BA9) as the top driver tissue of schizophre-nia. Consistent with DESE, all the top 10 estimated driver tissues by LDSC-SEG were brain regions. Three of the top 5 estimated brain regions by the two different tools were overlapped (brain frontal cortex-BA9, brain anterior cingu-late cortex-BA24, and brain cortex), in which the brain frontal cortex-BA9 was also ranked as the top driver tissue by LDSC-SEG. The contribution of the frontal cortex and the other brain regions to schizophrenia was also success-fully validated with tissue-specific chromatin data in the paper introducing LDSC-SEG (see details in Supp Table 7 of [11]). The high consistency between the results by DESE and that of the other tools clearly confirmed the validity of DESE for driver-tissue estimation. Moreover, DESE outper-formed Ongen et al. in terms of false positive finding.
Bipolar disorder (BD)
Estimation of driver tissues for BD seemed more difficult than that for schizophrenia. Among the top 10 estimated significant driver tissues by Ongen et al., only two were sub-brain regions, brain anterior cingulate cortex (BA24) and hippocampus, for this brain disorder. Both of the
sub-brain regions were also significant, p= 3.3E-5 and
1.8E-3 (suggestively), according to thepvalues by DESE with the transcript-level selective expression. The top significant driver tissue by Ongen at al.’s approach was prostate, which we failed to verify through a literature survey. The results of DESE and LDSC-SEG were much more similar. The top 8 estimated driver tissues by both tools were all brain regions. There were three common brain regions among the top 5 estimated driver regions by the two tools, brain frontal cortex (BA9), brain anter-ior cingulate cortex (BA24), and brain cortex. As stated above, these tissues were implicated with BD by many studies. The top driver tissue by DESE, cerebellum, was
was not the top tissue by the latter. Therefore, DESE’s estimated driver tissues for BD were highly constant with that estimated by LDSC-SEG and were concordant with known biology of this brain disease.
Coronary artery disease (CAD)
The top significant tissue by DESE, the coronary artery, was estimated as the third and eighth significant tissues
for CAD by Ongen et al.’s approach and LDSC-SEG
re-spectively. Consistent with our results, the female repro-ductive organs (such as ovary, cervix and uterus) prioritized by DESE were detected as the top 5 significant tissues by LDSE-SEG, and the adrenal gland prioritized by DESE was detected as the top 5 significant tissue by Ongen et al.’s approach. However, the adipose tissue esti-mated as the driver tissue by DESE was not detected among the top 10 tissues by the two existing approaches. LDSC-SEG estimated the ileum as the most significant tis-sue, and we failed to find literatures supporting this. The liver was detected as the top significant tissue for CAD by
Ongen et al.’s approach but failed by LDSC-SEG and
DESE. Therefore, DESE produced not only consistent driver tissues with existing tools but also extra promising driver tissues of CAD.
Rheumatoid arthritis (RA)
The immune tissues, spleen and lymphocytes, were pri-oritized in the top five driver tissues by DESE, which were supported by the similar findings from LDSC-SEG. Ongen et al. prioritized spleen as the tenth significant driver tissue, the only immune tissue in the top 10. Un-expectedly, it estimated the brain region hypothalamus as the most significant tissues. We only found subtle al-terations in hypothalamic-pituitary-adrenal system axis mainly affect the adrenal level [47]. Hence, the effect of hypothalamic in RA is unclear.
Total cholesterol (TC)
Due to lack of TC results in LDSC-SEG study, we selected the similar trait LDL (low-density lipoproteins) for com-parison in this part. The liver was also detected as the most significant tissue for TC (or LDL) by both LDSC-SEG and Ongen et al.’s approach, which is consistent with the fact that liver contributes to most of lipoprotein me-tabolism [48]. Similarly, the significance of the liver by Ongen et al.’s approach was much higher than the subse-quent tissues, such as the second tissue pancreas (7.0 vs. 2.8 according to the enrichment over the null). Therefore, the strong consistence of the three approaches and patho-logical knowledge confirmed the validity of DESE for esti-mation of driver tissues of clinical traits.
Height
Cardiovascular tissues for height by DESE were almost perfectly validated among the top 10 significant tissues
by both Ongen et al.’s approach and LDSC-SEG
(Ar-tery_Coronary, Artery_Aorta by Ongen et al.’s approach; Artery_Tibial, Artery_Coronary, Artery_Aorta by LDSC-SEG), suggesting the important role of cardiovascular tissues in height. Moreover, both LDSC-SEG and DESE detected the connective tissues (i.e., transformed fibro-blasts) among the top tissues, which is consistent with previous studies [45, 46] as described above. However, Ongen et al.’s approach detected several brain tissues (such as basal ganglia, cerebellar hemisphere) in the top 10 tissues, which was supported by an association study
[49]. Unexpectedly, LDSC-SEG estimated two female
re-productive tissues (uterus and endocervix) as the top 2 tissues, but we failed to find supporting literatures.
Validate estimated driver tissues with independent expression data
Besides the above validation at technique level, we also carried out validation at data level. The validation was performed by microarray data of 55 tissues curated with stringent quality control from the GEO database (see de-tails in the“Methods”section).
Schizophrenia
Consistent with the above results based on the RNA-Seq expression from GTEx project, all the top 8 driver tissues by DESE with the GEO dataset for schizophrenia were parts of brain regions (Fig. 3). This is a simple system-level validation. Among the eight brain regions, two
re-gions [prefrontal-cortex (p= 7.2E−5) and hippocampus
(p= 3.4E−5)] were exactly matched with the GTEx brain regions. Theirpvalues according to the GTEx data by the same selective expression measure (the proposed robust-regression z-score) were also highly significant based on the transcript-level selective expression, p= 1.5E−14 and 9.4E−12, respectively. Note this was also a successful val-idation with different data types (RNA-Seq vs. microarray data) and independent samples. There have been numer-ous studies implicating the contribution of the two brain regions to schizophrenia [50,51].
Bipolar disorder (BD)
dataset. According to the structure of BRENDA tissue, the cerebral gray matter (BTO_0000823) is a part of
the spinal cord. The pvalue of brain-spinal cord
(cer-vicalc-1) based on the transcript-level selective
expres-sion from GTEx was significant, p= 3E−4. Anyhow,
the top driver tissue based on the GEO data, parietal lobe, responsible for cognition (including attention and memory), has been implicated with BD by many studies [52].
Coronary artery disease (CAD)
The adipose tissue and two cardiovascular tissues (myo-cardium and left ventricle) were estimated among the top 4 driver tissues for CAD based on the GEO expres-sion (p= 2.3E−4, 4.5E−2, and 3.2E−2 respectively by the
proposed robust-regression z-score), which was
consist-ent with the results based on GTEx dataset. Interest-ingly, the female reproductive tissue uterus was also replicated in the GEO dataset. Moreover, another female reproductive cell type oocyte was estimated as the
sec-ond top tissues based on GEO dataset although its p
value was no longer significant (p= 2.1E−2 according to
the proposed robust-regression z-score). The high
consistency of estimated driver tissues (including the fe-male reproductive tissues) with independent sample suc-cessfully validated the results of DESE for CAD.
Rheumatoid arthritis (RA)
Consistent with results based on GTEx dataset, two im-mune tissues (tonsil and lymph node) were estimated as
top 2 driver tissues based on GEO dataset (p= 7.2E−5
and 2.4E−4 respectively by the robust-regression
z-score). Following the immune tissues, the colon and ileum (p= 3E−4 and 2.4E−3 respectively) were detected as the third and fourth driver tissues respectively, which were also consistent with the results based on GTEx. Due to lacking of expression data of the lung in GEO, we could not replicate the results of the lung. It should be noted that the blood was detected as driver tissues based on GEO dataset and also detected by LDSE-SEG while the GTEx whole blood was excluded in the QC procedure (see the“Methods”section).
Total cholesterol (TC)
Consistent with the results based on GTEx, the top tissue
for TC based on GEO was hepatocyte (pvalue 3.4E−3 by
the proposed robust-regression z-score). As we failed to collect sufficient number of expression profiles of lung and spleen in in GEO, their significant results in GTEx dataset cannot be validated. We also noticed that the sig-nificance of estimated tissues following hepatocyte was
low, such as the second driver tissue with p value only
3.3E−2, which was also consistent with the pattern based on the GTEx data.
Height
Due to the tissue difference in GEO and GTEx dataset, we could not validate the results at the exact driver tissues but can do it at the system level. The top 2 driver tissues for height based on GEO data included two connective tissues knee and synovium with significantpvalues (1E−8 and 2.2E−4 respectively by the robust-regressionz-score), which was consistent with the results based on GTEx dataset. Furthermore, the cardiovascular tissues (i.e., left ventricle), adipose, and uterus were also validated by GEO dataset with significantpvalues (5.7E−3, 1.5E−4, and 3.0E −4 respectively by the proposed robust-regressionz-score) among the top 10 tissues.
Fine estimation with brain-only expression data
For the brain disorders, it may be more interesting to finely prioritize the brain regions with expression only in the brain. We produced selective expression values among the 13 brain regions from GTEx and 16 brain re-gions from BrainSpan dataset and input them into DESE to estimate driver brain regions for schizophrenia and BD.
Schizophrenia
For schizophrenia, the top driver tissue remained the frontal cortex (BA9) (p= 3.3E−11 and 2.5E−7, based on the transcript-level and gene-level selective expression from GTEx by the robust-regression z-score) (see details at Additional file2: Table S15 and S16). The ranking order was also similar to that based on the 50 GTEx tissues al-though there were some minor fluctuations. The major difference may be the significance level at the cerebellum.
The pvalue at the cerebellum by DESE based on the 50
GTEx tissues was 1.1E−7 while that based on the 13 GTEx brain regions was only 0.015. We also validated the results with another independent brain dataset, BrainSpan. The significance at the frontal cortex was successfully repli-cated by both of the exon-level and gene-level selective ex-pression at the orbital frontal cortex and ventrolateral prefrontal cortex (see details in Additional file 2: Table S17 and S18). Consistent with the results in the GTEx brain dataset, the cerebellar cortex was also ranked as the least significant region for schizophrenia. The significant brain regions inferred by the brain-only expression data may suggest a unique contribution of significant regions to this complex brain disorder.
Bipolar disorder (BD)
schizophrenia. For examples, the top 2 driver regions of schizophrenia, frontal cortex (BA9) and anterior cingu-late cortex (BA24), were also among the top 3 driver re-gions of BD (see details in Additional file 2: Table S19 and S20). The common regions also support the high
comorbidity of the two brain disorders [53]. However,
the two diseases also had unique estimated driver re-gions which may support different characteristics of the two diseases. The cerebellum, for example, was ranked as the top significant brain region of BD (p= 8.8E−6,
based on the robust-regression z-score with transcript
expression), while it had the lowest significance for
schizophrenia (p= 0.015, based on the
robust-regression z-score with transcript expression). The
caudate nucleus was ranked as the fourth significant
tissue for schizophrenia (p= 4.0E−8, based on the
robust-regression z-score with transcript expression)
while it was insignificant for BD (p= 0.1, based on the
robust-regression z-score with transcript expression).
Multiple regions were successfully replicated by the expression values from BrainSpan (see details in
Additional file 2: Table S21 and S22). The orbital
frontal cortex remained the top driver tissue of BD with the gene- and exon-level selective expression data from BrainSpan. The significance of the anterior
cingulate cortex (BA24) with the GTEx data (p=
1.1E−5, based on the robust-regression z-score with
transcript expression) was replicated by that of the anterior (rostral) cingulate (medial prefrontal) cortex
from BrainSpan (p= 1.3E-3, based on the
robust-regression z-score with gene-level).
Investigate the contribution of lowly expressed genes
We noticed that lowly expressed genes also contributed to the prioritization of disease-related tissues when the transcript-level selective expression was used. A removal of lowly expressed genes led to substantial decrease in the statistical significance of estimated driver tissues at almost
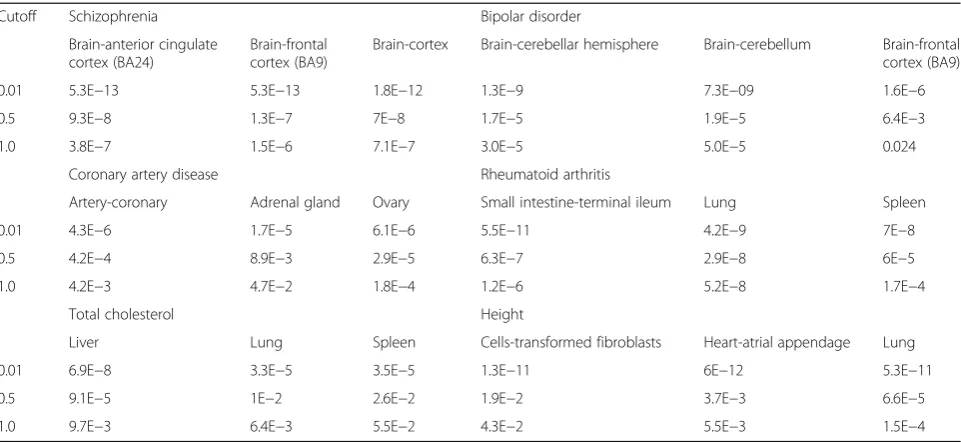
all the six complex phenotypes. As shown in Table 1,
when minimal expression cutoffs were increased from 0.01 to 0.5 and 1.0 TPM for the GTEx data, the statistical significance of the top driver brain region of schizophrenia [frontal cortex (BA9)] was decreased from 5.3E−13 to 1.3E −07 and 1.5E−06 based on the transcript-level selective expression by the proposed robust-regression score. This was also true for other significant top brain regions al-though the ranking order of these brain regions was simi-lar. The underlying cause is that a higher cutoff removed some genes that had relatively low expression but high se-lective expression. For example, CACNA1C is a well-known candidate susceptibility gene of schizophrenia [54]. CACNA1C encodes calcium voltage-gated channel sub-unit alpha1 C which is important for brain functions. This gene has 26 transcripts with expression in GTEx dataset, and 23 have very low expression. The transcript
(ENST00000399641) had a large selective expression
z-score 210.3 in the frontal cortex (p< 1.0E−200). However, it had only 0.2 TPM expression in the frontal cortex and nearly zero TPM in most tissues. A TPM cutoff even as low as 0.4 will exclude these important candidate genes of schizophrenia.
[image:9.595.58.539.494.715.2]The nontrivial contribution of lowly expressed genes further suggested the selective expression may be more
Table 1The enrichment statistical significance for different minimal expression cutoffs
Cutoff Schizophrenia Bipolar disorder
Brain-anterior cingulate cortex (BA24)
Brain-frontal cortex (BA9)
Brain-cortex Brain-cerebellar hemisphere Brain-cerebellum Brain-frontal cortex (BA9)
0.01 5.3E−13 5.3E−13 1.8E−12 1.3E−9 7.3E−09 1.6E−6
0.5 9.3E−8 1.3E−7 7E−8 1.7E−5 1.9E−5 6.4E−3
1.0 3.8E−7 1.5E−6 7.1E−7 3.0E−5 5.0E−5 0.024
Coronary artery disease Rheumatoid arthritis
Artery-coronary Adrenal gland Ovary Small intestine-terminal ileum Lung Spleen
0.01 4.3E−6 1.7E−5 6.1E−6 5.5E−11 4.2E−9 7E−8
0.5 4.2E−4 8.9E−3 2.9E−5 6.3E−7 2.9E−8 6E−5
1.0 4.2E−3 4.7E−2 1.8E−4 1.2E−6 5.2E−8 1.7E−4
Total cholesterol Height
Liver Lung Spleen Cells-transformed fibroblasts Heart-atrial appendage Lung
0.01 6.9E−8 3.3E−5 3.5E−5 1.3E−11 6E−12 5.3E−11
0.5 9.1E−5 1E−2 2.6E−2 1.9E−2 3.7E−3 6.6E−5
1.0 9.7E−3 6.4E−3 5.5E−2 4.3E−2 5.5E−3 1.5E−4
effective for driver-tissue estimation than original expression. In another experimental analysis, we also used the original expression for estimating the driver tissues by
DESE to validate this argument. As shown in
Additional file1: Table S7, thepvalues of top driver tis-sues based on the original expression were much less sig-nificant than those based on the selective expression, around two orders of magnitude larger. Given that select-ive expression is different from expression (Additional file1: Figures S6 and S7), selective expression (when available) instead of original expression may be preferable for priori-tizing causal tissues and genes of phenotypes.
Tissue selectivity prioritization enhances detection of susceptibility genes in post GWAS analyses
Finally, we asked how tissue selectivity in the estimated driver tissues can be used to enhance detection of genuine susceptibility genes in secondary analysis of GWAS data. The investigation was performed in the same six represen-tative complex phenotypes as proof-of-principle examples.
Schizophrenia
In the schizophrenia dataset, the selective expression ranking led to ~ 32% significant genes which were not significant according to the disease-association p value ranking in the conditional gene-based test [22]. Among the different significant genes, a rough in silico valid-ation in PubMed showed the selective expression rank-ing resulted in more genes implicated in schizophrenia by literature than the disease-associationpvalue ranking (n =6 vs. 0 with at least 9 supporting papers, see details in Additional file 2: Table S9). Here are some individual examples. In a set of physically close genes, the
tissue-selective expression ranking and pvalue ranking led to
two different significant genes, DRD2 and MIR4301, re-spectively. The DRD2 gene was selectively expressed in multiple prioritized pathogenic tissues of schizophrenia (including brain-anterior cingulate cortex, brain-cortex, brain-putamen (basal ganglia), and brain-spinal cord), and there were 100 papers co-mentioning the gene and schizophrenia in their titles or abstracts in PubMed database (see details in Additional file 2: Table S9). In contrast, there is no paper suggesting MIR4301’s contri-bution to schizophrenia. In another set of physically close genes, the tissue-selective expression ranking andp value ranking led to two different significant genes, CACNA1C and CACNA1C-AS4 respectively. CACN A1C was specifically expressed in above multiple priori-tized tissues for schizophrenia (including brain-frontal cortex (BA9), anterior cingulate cortex, and brain-hypothalamus). In PubMed database, there have been over 100 papers linking CACNA1C to schizophrenia
(e.g., [55]). The CACNA1C-AS4 (named CACNA1C
antisense RNA 4), however, had no selective expression
in estimated driver tissues of schizophrenia. There are also no papers implicating this gene with schizophrenia. In addtion, there are also six genes (PPP2R2A, NGEF, KLC1, EPN2, DMTF1, and ATG13) having large select-ive expression score (> 900) in estimated drselect-iver tissues but having no supporting papers in PubMed, which are promising candidate susceptibility genes of this disease. Therefore, the selective expression in the estimated driver tissues is useful for discovering functionally important genes for schizophrenia.
Bipolar disorder (BD)
In the bipolar disorder dataset, the selective expression-based ranking led to three more conditionally significant genes, 76 vs. 73. Nineteen significant (= 25%) genes based on the selective expression ranking order in the condi-tional gene-based test [22] were not significant based on the statistical p value ranking order (Additional file 2: Table S10). However, probably because bipolar disorder is less studied than schizophrenia, none of the 19 genes had over nine PubMed hit papers in the rough in silico valid-ation. Among the 19 genes, two had the selective-expression score over 400, CACNA1I (402.9) and LRRFIP2 (421.1). CACNA1I, encoding a subunit of cal-cium voltage-gated channel, has been implicated with schizophrenia [56] although it has not yet been linked to bipolar disorder. CACNA1I had four transcripts in GTEx dataset. Only two of them (ENST00000402142 and ENST00000404898) had strong selective expression in the estimated driver tissues of bipolar disorder, brain-frontal cortex (BA9) and brain-cerebellar hemisphere. LRRFIP2 encoding Leucine-rich Repeat Flightless-interacting Pro-tein 2 had 21 transcripts in the GTEx dataset. Only two transcripts (ENST00000440742 and ENST00000487246) had selective expression in the estimated driver tissues, brain-frontal cortex (BA9) and brain-cerebellar hemi-sphere. Probably, because most majorities of transcripts are not selectively expressed in the brain regions, this gene was seldom studied for this brain disorder.
Coronary artery disease (CAD)
In the coronary artery disease dataset, the selective expression-based ranking led to five more conditionally significant genes, 48 vs. 43 (see details in Additional file2: Table S11). Among the different significant genes, 11 sig-nificant genes according to selective expression ranking had PubMed hits, while only 6 significant genes according
to the p value ranking had PubMed hits. For example,
TCF21 had a significant conditional pvalue 9.31E−8 for association with CAD according to the tissue-selective ex-pression ranking while it had an insignificantpvalue 0.08
according to the statistical p value ranking. The TCF21
adipose. Recent studies have investigated the disease mechanism of TCF21 in CAD [57,58]. Iyer et al. proposed that TCF21 played a protective role in CAD development by inhibiting SMAD3, a central transcription factor (TF) inhibiting the cellular processes that allow smooth muscle cell (SMC) to repair the vascular lesions [57].
Rheumatoid arthritis (RA)
For rheumatoid arthritis, the selective expression rank-ing led to ~ 28% more conditionally significant genes
than p value ranking in the conditional gene-based test
(see details in Additional file 2: Table S12). Among the uniquely significant genes by different ranking, selective expression ranking detected 40 genes with PubMed hits andpvalue ranking detected only 17 such genes. For ex-ample, PTPN22 had a very significantpvalue for rheuma-toid arthritis, 2.34E−121, according to the tissue-selective expression ranking while it only had apvalue 1 according to the statistical significance ranking. The PTPN22 was se-lectively expressed in immune-related tissues (i.e., lym-phocytes cells and spleen), and there are over 100 papers of PubMed database co-mentioning the gene and rheuma-toid arthritis in the titles or abstracts. The PTPN22 acts as a negative regulator of T cell receptor (TCR), which has been suggested contributing to rheumatoid arthritis by many papers [59,60]. However,pvalue ranking led to a physically close gene of PTPN22, RSBN1, as a significant gene (p= 2.59E−140) while apvalue 1 for PTPN22. The RSBN1 was selectively expressed in the brain cerebellar hemisphere but not in RA-related tissues. We failed to find the literature supporting the role of the RSBN1 in the development of RA.
Total cholesterol (TC)
For total cholesterol, the selective expression ranking led
to seven more conditionally significant genes than p
value ranking in the conditional gene-based test. How-ever, among the uniquely significant genes for the two different ranking strategies, 23 out of 54 significant genes according to selective expression ranking (~ 43%) had PubMed hits, while only 12 out of 47 significant
genes according to p value ranking (~ 26%) have
PubMed hits (see details in Additional file2: Table S13). This suggests the selective expression ranking led not only to more significant genes but also to higher true positive rate thanpvalue ranking. Here is an interesting individual example. ABCG5 and ABCG8 are physically close. The tissue-selective expression ranking made both ABCG5 and ABCG8 as candidate susceptibility genes with significantpvalues (2.56E−13 and 3.45E−25), whilep
value ranking led to an insignificant p value at ABCG5
(p= 2.8E−4). ABCG5 and ABCG8, encoding ATP-binding
cassette (ABC) transporters, were selectively expressed in liver with very high significances (robust-regression
z-scores 9955.90 and 936.422). According to literature search, over 50 papers co-mention the ABCG5/8 and total cholesterol in their titles or abstracts in PubMed database. The role of ABCG5/8 in cholesterol metabolism has been
reviewed recently [61]. Actually, ABCG5 and ABCG8
form an obligate heterodimer that limits intestinal absorp-tion and facilitate biliary secreabsorp-tion of cholesterol and
phy-tosterols [61]. Hence, both ABCG5 and ABCG8 are
promsing driver genes of cholesterol metabolism.
Height
Similarly, the selective expression ranking led to 20 more conditionally significant genes thanpvalue ranking in the conditional gene-based test for height (see details in Additional file2: Table S14). Among the uniquely signifi-cant genes detected by the two approaches, here is a rep-resentative example. The gene HFE is physically close to multi-genes encoding histone, such as HIST1H1A,
HIST1H1C, HIST1H4C, and HIST1H2BC. The p value
ranking led to a significant p value 1.97E−22 at
HIST1H1A but an insignificantpvalue 1 at HFE. In
con-trast, selective expression ranking led to HFE as a
candi-date gene with significant p value (8.52E−18) and
HIST1H1A as an insignificant gene (p= 1). The HFE was
selectively expressed in the estimated driver-tissue fibro-blast cells, and it regulates iron absorption by influencing the interaction of the transferrin receptor with transferrin. A study suggested the sustained enhanced iron absorption in patients with HFE hemochromatosis might have a beneficial effect on growth [62]. However, we failed to find evidence supporting the role of histone for height.
Discussion
In the present study, we proposed a novel framework for estimating driver tissues of complex diseases and traits with gene expression and GWAS summary statistics. Using the GWAS data, this approach provides a hypothesis-free way to comprehensively explore related tissues of complex phenotypes. In the application study, it successfully detected highly related tissues consistent with known knowledge in all the six representative com-plex phenotypes. For instance, the brain frontal cortex (BA9) and coronary artery were ranked as the top tissues of schizophrenia and CAD respectively. More interest-ingly, it also suggested some cryptic driver tissues of the complex phenotypes, e.g., the adipose tissue for CAD, the lung for RA, the spleen for TC, and cardiovascular tissues for height. Some of these tissues may be not straightforward in clinical observations. Mostly, majority of the estimated tissues were validated by both inde-pendent methods and indeinde-pendent expression data
(Fig. 3). As the expression data and GWAS summary
the easy framework may encourage many explorations of causal tissues or cell types of complex diseases in the future, which will further facilitate molecular genetic studies and even drug target discovery [63].
Compared to two existing methods (Ongen et al. [10]
and LDSC-SEG) for driver-tissue estimation, DESE has its own technique advances. First, DESE integrates the quantity of selective expression into gene-based associ-ation analysis for the estimassoci-ation. Ongen et al.’s estima-tion was essentially built on variant-level disease association. In previous studies, we showed that gene-based association was more powerful than variant-gene-based association [64]. This might be the reason why DESE es-timated more biologically sensible tissues for almost all the tested phenotypes. Moreover, DESE also facilitates prioritizing candidate susceptibility genes, which corres-pondingly interprets the estimation of driver tissues. In contrast, neither of the existing tools had this important function although LDSC-SEG also extracted selectively expressed genes for inferring causal tissues. Second, DESE can directly integrate different levels of selective expression, including gene level, transcript level, and even exon level. In the present paper, we have clearly shown that a transcript (or even exon) level of selectively expression was much more powerful than the gene-level selective expression. To use the lower-level expression, Ongen et al. must calculate transcript-level or exon-level eQTLs. The substantially increased number of related transcripts and exons will complicate the analysis. By de-sign, LDSC-SEG cannot integrate the lower level of se-lective expression because it did not consider the expression quantities in their analysis basically. Finally, DESE does not use any cutoffs for the selective expres-sion, which may produce more robust estimation results. Ongen et al. needed a cutoff to select significant eQTL for driver-tissue estimation. LDSC-SEG arbitrarily se-lected the top 10% of genes with selective expression for driver-tissue estimation.
The observation that transcript-level selective expres-sion is more powerful for detecting driver tissues of com-plex diseases than that of the gene level is biologically sensible. In cells, it is essentially the mRNA transcripts that are translated for biological functions. Different tran-scripts may have different functions. Therefore, the transcript-level selective expression may more precisely capture a gene’s function in specific cell types. The gene-level expression is basically an averaged expression of dif-ferent transcripts, which may attenuate the tissue selectiv-ity property of some transcripts and miss its important characteristic expressions. This may be the reason why
the p values of estimated driver tissues based on
transcript-level expression were much more significant than that based on the gene-level expression in all the proof-of-principle examples (see details in Fig. 3). These
results suggest studies on transcriptome of complex dis-eases should pay more attention to transcript-level expres-sion, which was often not so deeply investigated. Moreover, our results also suggest some lowly expressed transcripts may be also important for complex diseases,
which led to more significant p values at the estimated
driver tissues (see details in Table 1). The importance of these genes can be highlighted by their large selective ex-pression values at some transcripts.
Given the importance of transcript-level selective ex-pression, it may be tricky to select a suitable transcript representing its gene in the driver-tissue estimation. In the present study, we used the transcript with the max-imal selective expression in a tested tissue for the esti-mation analysis. This may have bias toward genes with more transcripts as they tend to have larger selective ex-pression by chance. However, this tendency equally oc-curs at every tissue. In the analysis of real examples, the usage of maximal selective expression led to the esti-mated driver tissues accordant with known biology of the phenotypes. There are also alternative ways of using the transcript-level selective expression. The averaged selective expression should be similar to the gene-level selective expression which led to less powerful estima-tion (Fig.3). When the minimal selective expression of a gene was used, we found it almost had no power to de-tect significant driver tissues (Additional file 1: Table S8). Therefore, the maximal selective expression is at least an effective way for the driver-tissue estimation al-though it might not be the best way.
The hypothesis that genes associated with complex diseases tend to have selective expression in primary pathogenic tissues looks relatively strong. Although it has been widely accepted that causal genes of Mendelian diseases often have selective expression in the patho-genic tissues or cell types [6], it is generally unclear for complex phenotypes. The high concordance between the estimated driver tissues and known biology at all the six tested phenotypes suggested the validity of the hypoth-esis. It is unlikely that the high concordance in our analysis just occurred by chance. Probably, genetic perturbation in the primary causal tissues has higher functional impact on the genes with selective expres-sion which then lead to higher impact on pheno-types. It should be noted that not all genes having selective expression in the primary pathogenic tissues are the susceptibility genes. We observed many selectively expressed genes had no significant
disease-associated p values. A gene supported by both
select-ive expression in the estimated drselect-iver tissues and
significant phenotype-associated p values is more
The secondary function of DESE will also greatly facili-tate genetic fine-mapping of susceptibility genes in GWAS analyses. LD is a tricky problem in GWAS for discriminating true susceptibility genes from many indir-ectly associated genes. Li et al. proposed a powerful stat-istical framework to help isolate directly associated genes [22]. However, the original analysis was carried out according to a rank of statistical significance (i.e., p value) assuming the true susceptibility genes had more significantpvalues. But this is not always true due to sam-pling fluctuations. After ranking genes according to their selective expression in the prioritized tissues for a disease, we reperformed the conditional gene-based analysis with the new rank. It turned out the selective expression rank-ing led to more significant genes and higher proportion of genes supported by literatures for all the six representative complex diseases/traits. These results suggest that integra-tion of selective expression can efficiently enhance the power of identifying susceptibility genes. We believe this strategy will also work for many other complex pheno-types. It will be an effective framework to mine new sus-ceptibility genes in the secondary analysis of GWAS data with free data in public domains.
We used four types of measures of selective expression for the driver-tissue estimation, including the proposed
robust-regression z-score and three existing methods.
This is because we found that different measures led to different significance levels in different datasets and
phe-notypes. For example, the proposed robust-regression
z-score with transcript-level expression led to the highest significantpvalues for BD (Fig. 3) while the ratio of vec-tor projection with same expression data led to more significant pvalues for schizophrenia. With the expres-sion from GEO dataset, the proposed robust-regresexpres-sion z-score also led to the most significantpvalues at the es-timated driver tissues of schizophrenia. Therefore, we used all the four measures for the estimation analysis. However, compared to the other three measures, the
proposed robust-regression z-score has some technique
advances. First, it integrates standard errors of expres-sion means into the analysis. The variances of estimated means (i.e., standard errors) vary from tissues to tissues because of expression fluctuation and sample sizes. In GTEx dataset, for instance, the sample size of a tissue varies from 5 to 564. The means estimated in larger samples tend to be more accurate than those in smaller samples and should be given higher weights. The
pro-posed robust-regression z-score extended a robust
re-gression to subtly integrate the standard errors as weights for measuring selection expression. In contrast, existing measures can only use the estimated expression mean of each tissue for the selective expression analysis.
Moreover, the proposed robust-regression z-score
produced p values close to uniform distribution
(Additional file 1: Figures S2 and S3). The property of being uniform greatly facilitates statistical inference of selectively expressed genes. To our knowledge, most se-lective expression measures (including the three ones in the present paper) cannot be used to declare selectively expressed genes by statisticalpvalues.
Due to lack of data, the selective expression profiles in the collected tissues are far from complete and the de-velopmental stages of tissues are unavailable either, which is a limitation of the present study. For example, a liver has lobes, surfaces, and impressions. In GTEx data-set, the liver has no sub-tissues. Because of this issue, some estimated driver tissues may be still rough in our analysis. Probably also due to the same reason, some
genes with significant phenotype-association p values
have no significant selective expression in the estimated driver tissues of a disease. The significance in the driver-tissue estimation analysis may be increased when expres-sion in higher resolution tissues at suitable developmen-tal stage is available. However, as more and more expression data are accumulating, this limitation is diminishing. The tissue-selective expression will become a powerful resource for identifying driver tissues and new susceptibility genes of human diseases.
Methods
A unified framework of estimating driver tissues by genes’ selective expression
The framework, named driver-tissue estimation by se-lective expression (DESE), consists of main three compo-nents, conditional gene-based association analysis by an effective chi-square test, estimating driver tissues accord-ing to selective expression of the conditionally associated genes, and ranking genes according to their selective ex-pression in the estimated driver tissues. Based on the in-puts of GWAS summary statistics and gene expression of multiple tissues, they run iteratively to output a con-verged list of driver tissues and susceptibility genes (as byproduct) with statistical p values (see the pipeline in
Fig. 1). The following are detailed description of the
three components.
I. Conditional gene-based association analysis with GWAS p values
The iterative procedure starts with production of associ-ated genes of a disease or trait by our recent conditional gene-based association test (effective chi-square, ECS) [22] with GWAS summary statistics, which is available on the KGG platform (http://grass.cgs.hku.hk/limx/kgg/) [65]. ECS has a unique advantage of removing redundantly
as-sociated genes with the GWASpvalues of sequence
vari-ants. The variants within upstream and downstream (say 5 kb) of a gene are assigned onto the gene according to a
gov/refseq/rsg/. The ancestrally matched genotypes (e.g.,
Phase3 v5 Shapeit2 in 1000 Genomes Project [66]) are
employed as reference genotypes for the removal of re-dundant association by LD in the gene-based association test. In the first iteration, genes with smallerpvalues are given higher priority to enter the conditional gene-based association analysis one by one (see details in the original paper [22]). In the following-up iteration, genes with higher tissue selectivity score are given higher priority to enter the conditional association analysis one by one (see production of the scores below). The basic assumption is that genes selectively expressed in driver tissues of a com-plex phenotype are more likely to be causal genes. If the true causal genes enter preferentially, the conditional gene-based association analysis will more effectively re-move indirectly associated genes.
II. Estimate driver tissue of diseases by selective expression of disease- or trait-associated genes
Given the phenotype-associated genes from the above conditional analysis, the driver tissues of a disease are
esti-mated by the Mann-WhitneyUtest (Wilcoxon rank-sum
test) [67]. It basically tests whether the selective expression median of the phenotype-associated genes is significantly higher than that of other genes in an interrogated tissue. When a gene has multiple transcripts, the one with largest selective expression value represents the gene in the transcript-level analysis. We assume that tissue-selective expression of the associated genes determines the tissue where complex phenotype develops primarily [68]. There-fore, in the causal or driver tissue, one can observe higher selectively expression of the phenotype-associated genes. Alternatively, one can use hypergeometric distribution test to evaluate the enrichment of significant selective expres-sion among the phenotype-associated genes. However, the enrichment results may be sensitive to the cutoff for defin-ing significant selective expression. The Mann-WhitneyU test has an advantage of being cutoff-free and may pro-duce more robust results. A significant p value suggests the phenotype-associated genes tend to have higher select-ive expression in the tested tissue, indicating its potential of being a driver tissue of the corresponding disease.
III. Rank genes by tissue-selective expression in estimated driver tissues
The driver-tissue estimation results are then used to rank candidate genes according to their selective expression in
the corresponding tissues. Denote the p values of above
Mann-WhitneyU test inNtissues asp1,⋯,pN. Sort the
selective expression of all genes (Ti) in a tissueiin
ascend-ing order and a genejis ranked atkj,i’s place. The gene’s
selective expression score of the genejin all tissues is:
sj¼
XN
i¼1 kj;i
Ti −log10ð Þpi
:
A gene having strong selective expression in multiple estimated driver tissues will obtain a high score. The ranking score is then used to determine the order in the next conditional gene-based association analysis [22], where genes with higher ranking scores will be given higher priority to enter the conditioning procedure. A gene supporting by both high-ranking score and signifi-cant phenotype-associatedpvalues are highly prioritized for the phenotype as well.
The three steps are iterated until thepvalues of all tis-sues do not change almost. The iterative procedure for estimating driver tissues and genes has been
imple-mented into our platform KGG, http://grass.cgs.hku.hk/
limx/kgg/. See description about the implementation at
Additional file1: Text 1.
Measures of genes’selective expression
There have been multiple measures for evaluating the se-lective expression of genes [13]. Because selective expression is a relative quantity, it is often challenging to define the background reference tissues. In the present study, besides adopting three existing measures of selective expression, we also proposed a robust measure of selective expression by extending the Huber robust linear regression [69].
Let us define N different tissues, and each tissue has multiple transcriptome samples. A gene (or transcript)
has expression means and standard errors (SE) in theN
tissues,y1,…,yNands1,…,sN. Assume majority
expres-sion values approximately follow a certain distribution (say, normal distribution, or uniform distribution) while a minority of values deviate from the majority due to se-lective expression.
yð Þi ¼β0þβ1iþeð Þi wð Þi ¼ k= s 1=sð Þi eð Þi ≤k
i ð Þ eð Þi
eð Þi >k
8 <
: ð1Þ
where β0 and β1 are the regression parameters and
i∈[1…N] is the rank of a gene expression in an ascendingly sorted list of the N tissues. The y(i)
de-notes theith expression mean,s(i)is the corresponding
SE ofy(i), ande(i)denotes the residual. When each
tis-sue only has one subject,yi, is the expression value of
the subject and si is set to be 1. The w(i)is named a
weight ofy(i). Thekis a tuning constant and is equal to
1.345 × standard deviation of the weighted residuals
[69]. The iteratively reweighted least-square procedure of robust linear regression is used to generate the con-verged weights of thegene at theNtissues,w1,…,wN.
The converged weights are then standardized,
w`i¼PNwi j¼1wj
;
and are used to produce a robust mean,
^
μw¼
XN
i¼1w
` iyi
and a robust standard deviation,
^
σw¼
ffiffiffiffiffiffiffiffiffiffiffiffiffiffiffiffiffiffiffiffiffiffiffiffiffiffiffiffiffiffiffiffi PN
i¼1w`iðyi−μwÞ2 1−PNi¼1w`2i
s
:
The proposed robust-regressionz-score for selective expression at tissueiis defined as:
z`i¼σw^yi−μ^wλ:
Thez`iquantifies the expression deviation from the homogenous majority expression values. Theλis a constant factor to adjust thepvalues to follow uniform distribution for hypothesis test. Extensive simulations suggested that an empirical factor ofpffiffiffiffiffiffi1:5led to approximately uniformly distributedpvalues (Additional file1: Figures S2 and S3). Thepvalue is then approximated based on the standard normal distribution,
pi¼
n2 ½1−Φðz` iÞ;z`i≥0
2Φðz`iÞ;`zi<0 , whereΦ(x) is the cumulative distribution function of the standard normal distribution.
II. The conventionalz-score for selective expression When tissue number is sufficiently large, the conventionalz-score for standardization may also be effective for selective expression. Thez-score for
selective expression at a gene in tissueiis calculated by,
zc;i¼yi^σ−^μ;
where^μis the mean of the gene expression values in all theNtissues andσ^is the standard deviation.
III. Median absolute deviation (MAD) robustz-score
As the mean is sensitive to outlier, the MAD robust z-score was also previously proposed for selective expression [72]. The median is a robust measure of central tendency and MAD is a robust measure of statistical dispersion. The MAD robustz-score of a gene’s selective expression in tissueiis estimated by:
zMAD;i¼jyi−Mj
MAD ;
where M is the expression median of the gene
among theN tissues and MAD = 1.4826 × median(|
y1−M|, |y2−M|,…, |yN−M| ). Note we removed
the zero values of ∣yj−M∣ to avoid the zero
MAD for the analysis.
IV. The ratio of vector-scalar projection (RVP) Xiao et al. proposed a ratio of vector-scalar projec-tion for measuring selecprojec-tion expression of a gene in multiple tissues [16]. The RVP of a gene’s selective expression in tissueiis estimated by:
RVPi¼y2i=
XN
j¼1y 2
j:
The RVP ranges from 0 to 1.0. A value close to 1.0 indicates that tissueiis the major contributor to the projected length of vectorY= (y1,y2,…,yN) in
high-dimension tissue spaces or, biologically, high tissue selectivity.
Gene expression datasets and quality control
We adopted three independent expression datasets for driver-tissue estimation and validation. The calculated and QC-pass expression means and SE of these datasets are available for download athttp://grass.cgs.hku.hk/limx/rez/.
The RNA-Seq profiles from GTEx project
The normalized expression datasets at the gene level and transcript level were downloaded from GTEx project (V7)
[73], GTEx_Analysis_2016-01-15_v7_RNASeQCv1.1.8_
gene_tpm.gct.gz and GTEx_Analysis_2016-01-15_v7_
each tissue were different, ranging from 5 to 564 (Add-itional file1: Table S2). There were initially 196,520 tran-scripts and 56,205 genes in 53 tissues. The expression values were measured by transcripts per kilobase million (TPM). As TPM is effective for cross-tissue comparison
[74], we did not retransform the expression values by
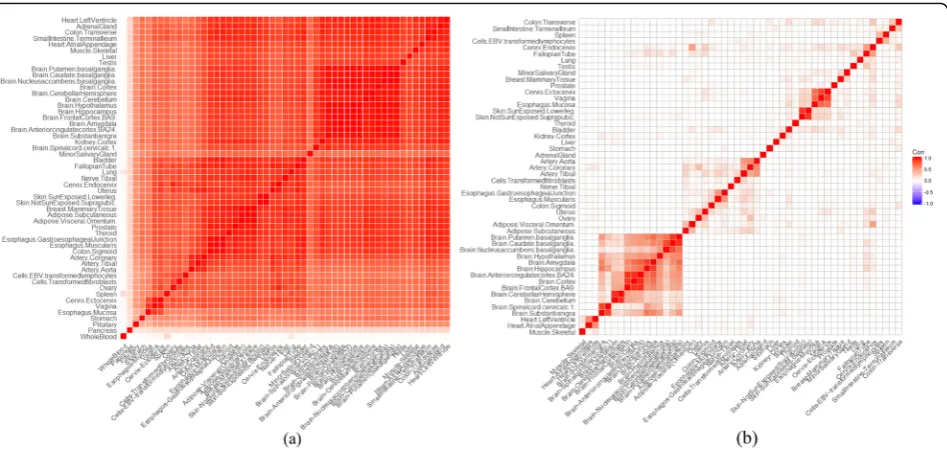
other measurements. A series of quality control proce-dures were carried out. The mean and standard deviation of expression values of all genes in each tissue were calcu-lated. In the evaluation according to correlation, three tis-sues (the whole blood, pancreas, and pituitary) had low Pearson correlation with other tissues (Fig. 2a and Add-itional file1: Figure S4) and were excluded. In the calcula-tion of tissue-selective expression, genes or transcripts
having ≤0.01 TPM in all tissues were excluded. Genes
whose Ensembl IDs had no corresponding official HGNC gene symbols were excluded as well. Finally, 131,292 tran-scripts and 31,659 genes in 50 tissues were retained for subsequent analysis.
The microarray expression profiles from Gene Expression Omnibus (GEO) repository
We also curated microarray expression profiles of multiple tissues from GEO database for validation. We adopted the tissue-tree structure in Open Biomedical Ontologies (https://www.ebi.ac.uk/ols/ontologies/bto) to collect the expression data. Stringent quality controls were carried out in the expression data. For each individual subject, the ex-pression values of genes were ranked. The gene exex-pression values were standardized corresponding to the quantile of the genes in the ranking list under standard normal distri-bution. This transformation converted data to normal dis-tribution and eliminated systematic batch effects. Within each GEO-GSE dataset of the same tissue, we removed samples which had relatively low and high correction with majority samples according to the Pearson correlation co-efficients. The correlations below 5% of all correlations and above 95% correlations were defined as the low and the high correlation respectively. We explored the GEO data-base and retrieved GSE datasets according to tissue-tree structure. If a tissue had over 200 subjects, its offspring tis-sues were checked. If one or more offspring tistis-sues also had the sample size over 200, the exploration went further into the offspring of the offspring tissues. Otherwise, the exploration stopped at the current tissue node with 200 or more subjects. In total, 55 different tissues were collected from the GEO database. Additional file1: Table S3 lists the tissue names and the corresponding sample sizes. Genes with 9 or few expression values were removed. Finally, 19, 012 genes were retained.
The RNA-Seq profiles from BrainSpan
We also downloaded gene- and exon-level transcription pro-files from BrainSpan as an independent dataset for validation
analysis. According to our previous study, the expression in prenatal brains may be less effective for illustrating disease association based on common variants [22]. We therefore removed expression profiles of prenatal brains. Genes or exons with 9 or few expression values were removed. Finally, 16 brain regions were retained for the driver-tissue estima-tion analysis. The number of genes and exons were 34,172 and 187,184 respectively. The region names and sample sizes are listed in Additional file1: Table S4.
Produce genes associated with six representative complex diseases or traits
We collected the GWAS meta-analysispvalues at single
nucleotide polymorphisms (SNPs) of six representative complex diseases or traits developing in different bio-logical systems, schizophrenia [23], bipolar disorder [26] (brain diseases), rheumatoid arthritis (RA) [75] (an auto-immune disease), coronary artery disease (CAD) [76] (a cardiovascular disease), total cholesterol [77] (a meta-bolic trait), and height [46] (an anthropometric trait).
Additional file 1: Table S6 lists the sample sizes and
downloading links of the datasets. Thepvalues of SNPs
were combined for gene-based association on KGG (see detailed methods in the above section). The significantly associated genes (after multiple testing correction) were used to detect potential driver tissues and to finely map susceptibility genes by the conditional gene-based test [22] (see pipeline in Fig.1).
Validate and compare estimated driver tissues by the proposed framework with existing methods
The method of Ongen et al.
Ongen et al. estimated the driver tissues of a complex disease based on concordance of active expression quan-titative trait loci (eQTLs) and GWAS-associated variants
[10]. They assumed the causal tissue showed
signifi-cantly higher concordance than irrelevant tissues, which is different from the hypothesis of DESE. Because Ongen et al.’s method had no publicly available tools, we dir-ectly extracted enrichment values from the Supplemen-tary Table S5 of their published paper for the validation
and performance comparison [10]. According to Ongen
et al., the tissues with the enrichment value over the null greater than 1 were considered as the significant causal tissues for the diseases/traits.
LDSC-SEG
Finucane et al. proposed to infer causal tissues according to heritability enrichment at selectively expressed genes
[11], which was named LD score regression applied to