771
©IJRASET (UGC Approved Journal): All Rights are Reserved
Analysis of TCP Variants Based On Maximum
Throughput and Net Packet Lost Using Ns-3.25
Archita Saxena1, Krishna Gupta2 1
PG Student, 2Assistant Professor Department of Computer Science, Yagyavalkya Institute of Technology, Jaipur, Rajasthan
Abstract: This paper analyzes maximum throughput and net packet lost for the TCP variants: New Reno and Westwood. All simulations are performed in Network Simulator (version 3.25) simulation tool. Maximum Throughput and net packet lost for each variant are calculated by varying router link simulation time and router link bandwidth. This Analysis was done using dumbbell topology to determine the comparative maximum throughput and net packet lost for each TCP variant. This analysis proves that rate of Net packet lost in TCP Variant “NewReno” is good at low bandwidth and low simulation time, while TCP Variant “Westwood” is good at large bandwidths and large simulation time.
Keywords: Router, Net Packet Lost, Simulation Time, Bandwidth
I. INTRODUCTION
The TCP/IP protocol suite defines a four-layer interactive structure called DARPA model, whose name was taken from the U.S. government agency that invented TCP/IP.
The four layers of this model are: Application, Transport, Internet, and Network Interface. Each layer of this model defines one or more layers of the seven-layer OSI model. TCP gives reliable, easy connection handling service. In beginning it was used for wired networks which comprised of low errors but now it is greatly being used in wireless networks due to some advantages of it. In this process initially a connection should be established before nodes can transfer data packets easily. Reliability is gained by assigning a sequence number and providing acknowledgement to each segment transmitted.
TCP peers also called the two nodes using TCP connection to communicate provide acknowledgement when they receive data packet. A TCP segment consists of TCP header and the TCP data, also called segment. When a TCP segment containing data is sent, the receiver node always returns an acknowledgment (ACK). If ACK is not received for any segment within a specified time, that TCP segment is retransmitted.
A TCP segment includes segment header and data section. The TCP segment header consists of 10 essential fields, and an optional extension field. The TCP header is followed by data section. Contents of data section are the payload data transmitted for the application. Length of a data section is not mentioned in the TCP segment header. Length of a data section can be determined by subtracting the overall length of the TCP header & encapsulated IP header from the total length of IP datagram.
II. TCP CONGESTION PARAMETERS
If congestion occurs in TCP network, then there will be loss of some packets at an intermediate node e.g. a router etc. After that the network is badly affected by the retransmission of packets triggered which results in more packet losses and more retransmission of packets, flow control process is applied to provide relief to high traffic network [5]. TCP’s transmission capacity is computed b y size of congestion window; cwnd is decreased to 1 from its current size, which also decreases the flow of packets. Having these issues, TCP is still responsible for reliable communication. Many researches are going on to recover TCP from the losses and to make the network congestion friendly.
A. Sliding Window
772
©IJRASET (UGC Approved Journal): All Rights are Reserved
B. Congestion WindowIn TCP network, it is one of the main factors which identify the number of bytes that can be kept in a queue at any time. This window is controlled by the sender node. It is to be noted that one should not be confused with the TCP window size which is controlled by the receiver. The congestion window is a medium of haulting a link between the sender node and the receiver node from being overloaded with high amount of traffic. It is determined by calculating amount of congestion present on the link. When a connection is established, the congestion window, which is a value controlled at each host node, is set to a small multiple of the
MSS allowed on that connection. Further variation in the congestion window is determined by an AIMD (additive
increase/multiplicative decrease) approach. This approach states that if all packets are received by receiver and the acknowledgments received by the sender on time, then some constant parameters are added to the window size. The window size keeps increasing exponentially until it reaches to ssthresh value or a timeout occurs.
III.TCP VARIANTS
TCP has many variants namely Tahoe, Reno, New Reno, BIC, CUBIC, Westwood, HighSpeed, Hybla and many more. New transport protocols are always evolving with an objective to increase throughput and decrease the chance of getting into congestion. All these variants basically differ in the way they deal with congestion, control the data rate, and react with the lack of arrival of acknowledgments. The distinction of packet loss due to congestion or corruption is also an issue. In this paper we have analysed two variants: NewReno and Westwood.
A. TCP New Reno
New RENO is a slight modification over TCP-RENO. It is able to detect multiple packet losses and thus is much more efficient that RENO in the event of multiple packet losses. Like Reno, New-Reno also enters into fast-retransmit when it receives multiple duplicate packets, however it differs from RENO in that it doesn’t exit fast-recovery until all the data which was out standing at the time it entered fast-recovery is acknowledged. Thus it overcomes the problem faced by Reno of reducing the CWD multiples times. The fast-transmit phase is the same as in Reno. The difference is in the fast-recovery phase which allows for multiple re-transmissions in new-Reno. Whenever new-Reno enters fast-recovery it notes the maximums segment which is outstanding. The fast-recovery phase proceeds as in Reno, however when a fresh ACK is received then there are two cases:
If it ACK’s all the segments which were outstanding when we entered fast-recovery then it exits fast recovery and sets CWD to ssthresh and continues congestion avoidance like Tahoe.
If the ACK is a partial ACK then it deduces that the next segment in line was lost and it re-transmits that segment and sets the number of duplicate ACKS received to zero. It exits Fast recovery when all the data in the window is acknowledged.
B. TCP Westwood
Westwood builds an estimate of the rate of the connection and uses it to compute the slow start threshold and congestion window. Studying the behaviour of such a mechanism in LTE networks makes the CCA worth studying here. According to the introduction paper, the performance is improved both in wired and wireless networks. It is however most effective in wireless networks with lossy links. Thus Westwood solved one of the problems of Reno: its inability to determine the cause of a loss. However it does not address its slowness to reach full link utilization. If the bandwidth estimate falls into the first case, the loss has a high probability of being caused by congestion. Thus, the window is reduced to fit the bandwidth estimation.
If the estimated bandwidth is less than congestion window i.e. first case, we can conclude that major cause of the loss is congestion
in network. Therefore the congestion window is adjusted to fit the estimated bandwidth. In the worst situation (when the maximum
throughput is very low) Westwood decreases the congestion window similar to Reno to make the network less prone to congestion. If the estimated bandwidth is greater than or equal to congestion window i.e. second case, we can conclude that major cause of the loss is transmission error in the link therefore the congestion window is not decreased as no congestion in network is detected. The major issue in implementing this variant is the estimation of the bandwidth.
773
©IJRASET (UGC Approved Journal): All Rights are Reserved
IV.SIMULATION RESULTS
[image:4.612.137.476.143.331.2]In this research paper we have compared two variants (NewReno and Westwood) and maximum throughput & net packet lost are calculated for each variant by varying router bandwidth and router link simulation time. Analysis is performed using Dumbell topology to compare the variants. Network Simulator (version 3.25) tool is used to perform this analysis. Fig 2 defines the dumbell topology structure.
Fig 1 Dumbbell Topology
[image:4.612.126.487.400.526.2]In Fig 1 n0 is connected to n2 via nodes n4 & n5 having one TCP variant. n1 is connected to n3 via n4 & n5 having other TCP variant. Some values which have been kept constant are mentioned in Table 1.
Table 1: Constant Values
Packet Size = 1500 bytes and network simulation time = 100 seconds
Link Bandwidth
(MB)
Simulation time (ms)
n0-n4 5 10
n1-n4 5 10
n5-n2 5 10
n5-n3 5 10
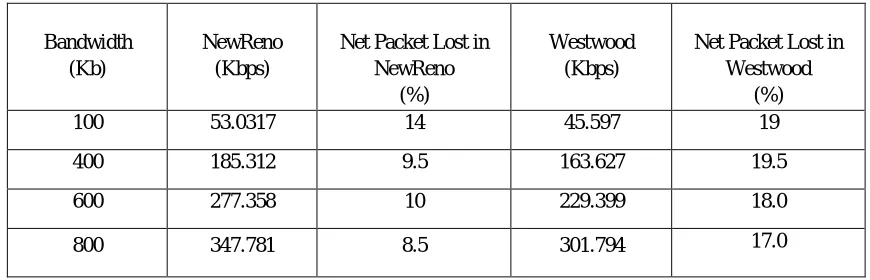
Case I: Table 2 demonstrates value of maximum throughput and net packet lost for two types of TCP variants based on various values of router link bandwidth between n4 & n5. Simulation time of router link is 20 ms.
Table 2: Throughput and net packet lost according to Router link Bandwidth
Bandwidth (Kb)
NewReno (Kbps)
Net Packet Lost in NewReno
(%)
Westwood (Kbps)
Net Packet Lost in Westwood
(%)
100 53.0317 14 45.597 19
400 185.312 9.5 163.627 19.5
600 277.358 10 229.399 18.0
[image:4.612.88.523.589.729.2]774
©IJRASET (UGC Approved Journal): All Rights are Reserved
1000 406.963 9.0 364.428 15.0
1200 499.873 18 409.651 23.0
1500 600.66 9.5 512.448 7.0
1700 649.64 14.5 575.707 9.5
2000 767.023 9.0 639.295 4.0
3000 1062.51 8.0 916.119 3.0
5000 1514.11 7.5 1454.41 3.5
7000 1983.78 6.5 1983.53 2.5
10000 2705.78 5.0 2705.39 3.0
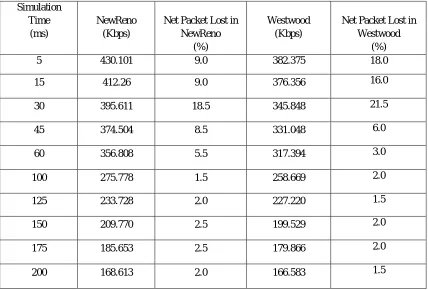
[image:5.612.93.521.367.657.2]Case II: Table 3 demonstrates value of maximum throughput and net packet lost for two types of TCP variants based on various values of router link simulation time between n4 & n5. Bandwidth of router link is fixed at 1 Mbps.
Table 3: Throughput and net packet lost according to Router link Simulation Time Simulation
Time (ms)
NewReno (Kbps)
Net Packet Lost in NewReno
(%)
Westwood (Kbps)
Net Packet Lost in Westwood
(%)
5 430.101 9.0 382.375 18.0
15 412.26 9.0 376.356 16.0
30 395.611 18.5 345.848 21.5
45 374.504 8.5 331.048 6.0
60 356.808 5.5 317.394 3.0
100 275.778 1.5 258.669 2.0
125 233.728 2.0 227.220 1.5
150 209.770 2.5 199.529 2.0
175 185.653 2.5 179.866 2.0
200 168.613 2.0 166.583 1.5
775
[image:6.612.112.502.79.683.2]©IJRASET (UGC Approved Journal): All Rights are Reserved
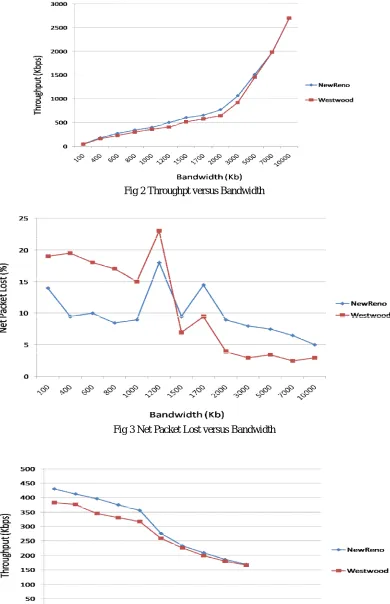
[image:6.612.109.501.500.714.2]Fig 2 Throughpt versus Bandwidth
Fig 3 Net Packet Lost versus Bandwidth
776
[image:7.612.123.493.90.269.2]©IJRASET (UGC Approved Journal): All Rights are Reserved
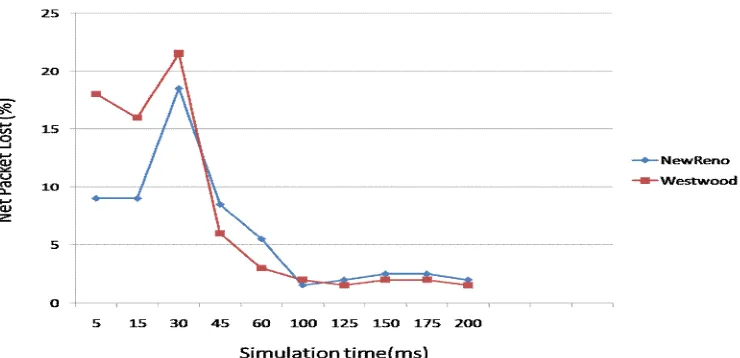
Fig 5 Net Packet Lost versus Simulation Time
V. CONCLUSION
It has been noticed that we can use different types of TCP variants to determine and control congestion in network. Increase in traffic in wireless network increases the number of net packets lost. Because of this more and more congestion occurs. In our analysis we have compared two variants according to maximum throughput and net packet lost. Our results conclude that Westwood variant performs well at larger bandwidth and larger simulation time while NewReno performs well at smaller bandwidth and smaller simulation time.
For case I average throughput for NewReno is 850.29 Kbps and for Westwood is 792.415 Kbps. For case II average throughput for NewReno is 304.28 Kbps and for Westwood is 278.49 Kbps.
For case I average net packet lost for NewReno is 9.92 % and for Westwood is 11.08 %. For case II average net packet lost for NewReno is 6.10 % and for Westwood is 7.35 %.
REFERENCES
[1] Nosiba Ibrahim Alfadil Altahir & Hamid Abbas Ali, “Performance Evaluation of TCP Congestion Control Mechanisms Using NS-2,” IEEE, 2016.
[2] Prakash B. Khelage and Dr. Uttam Kolekar, “Survey and Simulation based Performance Analysis of TCP-Variants in terms of Throughput,Delay and drop Packets over MANETs”, IJSER, 2014.
[3] Subramanya P, Vinayaka K S, Gururaj H L, Ramesh B, “Performance Evaluation of High Speed TCP Variants in Dumbbell Network”, IOSR Journal of Computer Engineering, 2014.
[4] Balveer Singh, “A Comparative Study of Different TCP Variants in Networks”, International Journal of Computer Trends and Technology (IJCTT), August 2013.
[5] Madiha Kazmi, Muhammad Younas Javed and Muhammad Khalil Afzal, “An Overview of Performance Comparison of Different TCP Variants in IP and MPLS Networks”, Springer, 2011.
[6] Suhas Waghmare, Aditya Parab, Pankaj Nikose and Prof. S. J. Bhosale, “Comparative Analysis of different TCP variants in a wireless environment”, IEEE, 2011.
[7] Abdeljaouad, H. Rachidi, S. Fernandes, A. Karmouch, “Performance Analysis of Modern TCP Variants: A Comparison of Cubic, Compound and New Reno”, IEEE, 2010.
[8] Md. Shohidul Islam, M.A Kashem, W.H Sadid, M. A Rahman, M.N Islam, S. Anam, “TCP Variants and Network Parameters: A Comprehensive Performance Analysis”, Proceedings of the International MultiConference of Engineers and Computer Scientists 2009.
[9] R.L. Cottrell, S. Ansari, P. Khandpur, R. Gupta, R. Hughes-Jones, M. Chen, L. MacIntosh, F. Leers, Characterization and Evaluation of TCP and UDP-Based Transport On Real Networks. Proc. 3rd Workshop on Protocols for Fast Long-distance Networks, Lyon, France, 2005.