Structural and Dielectric Properties of Ba-Co-Zr
Hexagonal Ferrites
Ch. Venkateshwarlu1, P. Vijaya Bhasker Reddy2
1
Department of Physics, University College of Science, Saifabad, Osmania University, Hyderabad-500004, Telangana, India. 2
University College for Women, Osmania University Hyderabad-500095,Telangana,India.
Abstract: Dielectric properties such as dielectric constant ( ’) and dielectric loss tangent (tan ) of mixed Ba-Co-Zr ferrites having the compositional formula BaCoxZrxFe12-2xO19 (where x =0.0, 0.2, 0.4, 0.6, 0.8 and 1.0) were measured at room temperature in the frequency range 1 MHz to 1.8GHz using a 4291B impedance analyser plots of dielectric constant ( ’) vs.
frequency show a normal dielectric behaviour of ferrites. The frequency dependence of imaginary permittivity was found to be abnormal, giving a peak at certain frequency for all mixed Ba-Co-Zr ferrites. A qualitative explanation is given for the composition and frequency dependence of the dielectric constant and dielectric loss tangent.
Keywords: Structure; Permittivity; Dielectric constant; dielectric loss tangent; Ba-Co-Zr ferrites.
I.INTRODUCTION
Ferrites materials are being widely used in the devices operating at higher frequencies. The hexagonal ferrites MFe12O19 (M=Ba, Sr
and Pb) with magneto plum bite structure are important permanent magnetic materials in microwave, small motor and more recently magnetic recording applications [1-4]. These materials have good mechanical, chemical stability. Several cations such as Cr3+,Al3+,Ga3+ have been attempted by several researchers[5-8] in order to improve the electrical properties of Ba-hexaferrite. The M-type ferrite crystallizes in a hexagonal structure with 64 ions per unit cell on 11 different symmetry sites. The 24 Fe3+ atoms are distributed over five different sites: three octahedral sites one tetrahedral site and one trigonal bipyramidal site. At high frequencies, hexaferrites are considered superior to other magnetic materials because they have low eddy current loss and high electrical resistivity. Hence with a view to the understanding of dielectric phenomena in mixed Ba-Co-Zr ferrites, a systematic study of dielectric properties as a function of composition and frequency was undertaken. The results of the study are presented in this communication.
II. EXPERIMENTAL DETAILS
In the present study of BaM hexagonal ferrites codoped with Co2+ and Zr4+ (Ba-Co-Zr) having the compositional formula
BaCoxZrxFe12-2xO19 (where x = 0.0, 0.2, 0.4, 0.6, 0.8 and 1.0) were prepared by conventional double sintering method using highly
pure BaCO3 (AR 99%), ZrO2 (AR 99%), CO3O4 (AR 99%) and Ferric oxide (Fe2O4). The selected samples were pre-sintered at
1000oC for 10 hrs and last sintering was carried out at 1250oC for 15 hrs, the sintering atmosphere being air. The XRD analysis is performed to confirm the phase formation of hexa ferrites by Philips Xexpert, which using Co Kα radiation source with λ = 1.7902
A0. SEM analysis was carried out by LEO-440i microscope. Dielectric properties such as dielectric constant ( ’) and dielectric loss
tangent (tan ) of mixed Ba-Co-Zr ferrites were measured at room temperature in the frequency range 1 MHz to 1.8GHz using a 4291B impedance analyser plots of dielectric constant ( ’) vs. frequency show a normal dielectric behaviour of ferrites
III. RESULTS AND DISCUSSION
2 0 3 0 4 0 5 0 6 0 7 0 8 0 x = 0 . 2
P o s i t i o n ( 2
x = 0 . 0 x = 0 . 4 x = 0 . 6
x = 1 . 0
x = 0 . 8
[image:3.612.159.424.83.266.2]In te n s it y ( a .u .) (1 1 0 ) (0 0 6 ) (2 1 7 ) (3 0 0 ) (0 0 1 6 ) (2 2 0 ) (2 1 1 0 ) (2 0 1 1 ) (0 0 1 4 ) (2 0 6 ) (2 0 5 ) (2 0 3 ) (1 1 1 0 ) (1 0 1 1 ) (1 0 8 ) (1 1 4 ) (1 0 7 ) (0 0 8 )
Fig. 1: X-ray diffraction patterns of BaCoxZrxFe12-2xO19 hexaferrite samples (with x = 0.0, 0.2, 0.4, 0.6, 0.8 and 1.0).
The porosity values of the synthesized samples are calculated by using the formula P=(1-d/dx)x100, where d is the bulk density and
dx is the x-ray density. The obtained porosity values are given in Table.1. The decrease in porosity indicates that the substituted ions
[image:3.612.87.529.396.693.2]may have causing the densification of the barium hexaferrite matrix. It can be seen that the x-ray density is increasing with increasing content of Co2+ and Zr4+ in the BaM ferrite. This may be due to the larger ionic sizes of substituents when compared to that of Fe3+ ion. Further, the values of bulk density are smaller than the corresponding values of x-ray density. This can be attributed to the existence of pores in the samples.
Table 1: Lattice parameters, porosity values, etc. of Ba-Co-Zr hexagonal ferrites
Fig.2 shows the SEM micrographs of Ba-Co-Zr hexa ferrites. It can be seen from the micrographs that the morphology of particles Sl.
No. Ferrite composition a(A0) c (A0 )
Volume (Å3) X-ray density (g/cm3) Bulk density (g/cm3) Porosity (%) Grain size (μm)
1. BaFe12O19 5.890 23.208 697.266 5.271 4.544 14 5
2. BaCo0.2Zr0.2Fe11.6O19 5.891 23.213 697.654 5.285 4.653 12 6
3. BaCo0.4Zr0.4Fe11.2O19 5.893 23.224 698.458 5.322 4.896 8 8
4. BaCo0.6Zr0.6Fe10.8O19 5.897 23.243 699.979 5.336 4.962 7 10
5. BaCo0.8Zr0.8Fe10.4O19 5.903 23.267 702.128 5.348 5.012 6 7
micrographs is in the range of 4 to 10 μm. With the increase Co-Zr doping up to x=0.6 the average grain size for all the samples increases and with the further increase of x, grain size decreased.
Fig. 2.: SEM micrographs of BaCoxZrxFe12-2xO19 hexagonal ferrite samples
The frequency variation of real and imaginary parts of relative permittivity (ε' & ε") for all the samples under investigation was measured and obtained results are plotted in Figs.3 & 4. It can be seen from the figures that the value of ε' remains constant upto a
frequency 1 GHz and increases further increase of frequency. In all the samples a resonance and anti resonance peak was observed above 1 GHz. This behavior can be explained in the following way: The ' remains constant in the frequency range from 1 MHz to 1 GHz due to the hoping electrons will not follow the external applied field. Whereas the increase of ' above 1GHz is may be due to the following of hopping electrons in the external field. When the hoping frequency of the electrons is equal to that of the external applied electric field, a peak is obtained in the dielectric constant and it is called as the dielectric resonance. Similar behavior was observed by several investigators in many ferrite systems [9-12].
[image:4.612.71.498.108.540.2]0 . 0 5 . 0 x 1 08 1 . 0 x 1 09 1 . 5 x 1 09 - 4 0 0
- 3 0 0 - 2 0 0 - 1 0 0 0 1 0 0 2 0 0 3 0 0 4 0 0 5 0 0
R e a l p a rt o f p er m it ti v it y ( ' )
F r e q u e n c y ( H z ) x = 0 . 0
x = 0 . 2 x = 0 . 4 x = 0 . 6 x = 0 . 8 x = 1 . 0
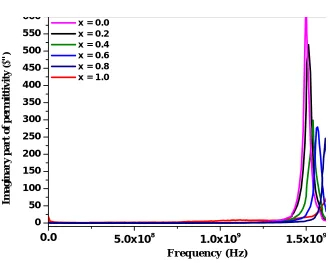
0.0 5.0x10⁸
1.0x10⁹ 1.5x10⁹
0 50 100 150 200 250 300 350 400 450 500 550 600 Im a g in a ry p a rt o f p er m it ti v it y ( " )
F req u en cy (H z) x = 0 .0
x = 0 .2 x = 0 .4 x = 0 .6 x = 0 .8 x = 1 .0
polarization in ferrites [13]. Researchers have reported the formation of Fe2+ ions from Fe3+ ions in the high temperature synthesis of ferrites [14-17].
A sample with x = 0.0, i.e., an undoped BaFe12O19 is showing large value of dielectric constant compared to doped one which is due
[image:5.612.156.486.342.605.2]to the fact that undoped sample posses large number of Fe3+ ions. Thus polarization is enhanced resulting in an increase
Fig 3: Frequency dependence of real (ε') part of relative permittivity for Co-Zr doped BaFe12O19
Fig4 : Frequency dependence of imaginary (ε") part of relative permittivity
for Co-Zr doped BaFe12O19
of both ε' and ε" in sample x = 0.0. The mechanism of complex permittivity can be discussed in this way: Substitution of ions of ferrites with different valences causes defects in the lattice either in the form of vacancies or in the form of interstitials. In this composition, Co2+ and Zr4+ ions are substituted to BaFe12O19 containing Fe3+ ions. Some of the Fe3+ ions are replaced with lower
Table 2: Data of dielectric and magnetic properties of Co-Zr doped BaFe12O19 hexagonal ferrites
The dielectric loss (ε") has been measured on all the samples in the frequency range of 1 MHz to 1.8 GHz and obtained results are plotted in Fig.4. It can be seen from the figure that the value of ε" is small and remains almost constant from 1 MHz to 1GHz. The
ε" value increases with an increase of frequency from 1 GHz to 1.8 GHz and finally shows a peak around 1.5 GHz. The variation of
dielectric loss with frequency may be explained similar to that of ε' variation with frequency.
Dielectric loss of polycrystalline ferrite ceramics results from the lag in polarization versus the alternating electric field, which has several contributors, such as (i) electron polarization losses, (ii) ion vibration and deformation losses, and (iii) ionic migration losses (including DC conduction loss and ionic jump and dipole relaxation losses). The electron polarization losses are responsible for absorption and color in the visible spectrum. The ion vibration and deformation losses are only of importance in the infrared and not a major concern for frequencies below ~10 GHz. Therefore, the main contribution to dielectric losses of ferrite ceramics would be the ion migration losses, where conduction losses are more significant than other losses. The presence of impurities and the imperfection in the ferrite structure lead to high conductivity and high
losses [18]. However, the most significant contribution to dielectric loss comes from the conduction loss due to the electron hopping between Fe2+ and Fe3+ ions, especially at low frequencies.
IV. CONCLUSIONS
The frequency of real and imaginary parts of permittivity (ε' &ε" ) for all the samples under investigation was measured in the frequency range of 1MHz to 1.8GHz. It is observed that with an increase of composition (x) from 0 to 1.0 the values of ε' decreased
from 33 to 6 at 1MHz. The ε" value increases with an increase of frequency from 1GHz to 1.8 GHz and finally shows a peak around
1.5GHz. The dielectric losses are in the range of 5.4 to 2.9.
V. ACKNOWLEDGEMENT
The authors are grateful to Prof. J. Shiva Kumar, Head, Depatment of Physics, University College of Science, Osmania University Hyderabad, and Prof.C. Vishnuvardhan Reddy Chairmen, Board of studies in Physics, Osmania University, Hyderabad for their encouragement.
REFERENCES
[1] W.Eerenstein, N.D.Mathur, J.F. Scott, Nature. 442 (2006) 759.
[2] Muhammad Naeem Ashiq,Muhammad Javed Iqbal,Iftikhar Hussain Hussain Gul, J.Alloys and Compounds 487 (2009) 341-345. [3] S.H. Sun, H.Zeng. J.Am. Chem. Soc. 124 (2002) 8204.
[4] M. H.Sousa, F.A. Tourinho, J.Phys.Chem. B 105 (2001) 1168. [5] M.J. Iqbal, M.N.Ashiq, Scripta Mater, 56 (2007) 145.
[6] S.Thompson, N. Shirtcliffe, E.S.O.Keefe,S. Appleton, C.C. Perry, J.Magn.Magn. Mater,292 (2005) 100. [7] Q.Q.Fang,H.Cheng,K.Huang,J.Wang,R.Li,Y.Jiao, J.Magn. Magn.Mater. 294 (2005) 281.
[8] G.Surig, K.A.Hempel, D. Bonnenber, Appl. Phys.Lett.74 (1999) 2513
[9] A. M., B.K. Shaikh, S. S. Bellad Chougule, J.Magn.Magn.Mater., 195 (1999) 384. [10] A. Verma, T.C.Goel, R.G.Mendiratta, M.I.Alam, Mater.Sci.Eng.B., 60 (1999) 156. [11] A. Verma, T. C. Goel, R. G. Mendiratta, J. Magn. Magn. Mater., 195 (2000) 274. [12] V. R. K. Murthy, J. Shobhanadri, Phys. Status. Solidi. A., 36 (1976) 133. [13] A.M. Abdeen, J.Magn.Magn.mater., 192 (1999) 121.
S. No. Composition ε' ε" Resonance frequency
(GHz)
1 BaFe12O19 33 5.4 1.3
2 BaCo0.2Zr0.2Fe11.6O19 22 4.5 1.31
3 BaCo0.4Zr0.4Fe11.2O19 18 4.1 1.32
4 BaCo0.6Zr0.6Fe10.8O19 15 3.8 1.35
5 BaCo0.8Zr0.8Fe10.4O19 11 3.2 1.36
[14] N. Gupta, M.C.Dimri, S.C.Kashyap and D.C.Dubey, Ceramics International, 31 (2005) 171. [15] L.G. Van Uitert, J.Chem.Phys., 23 (1995) 1883.
[16] A. Verma, R. Chatterjee, J. Magn. Magn. Mater., 306 (2006) 313.J.M. Brownlow, J.Appl. Phys., 29(1958) 373.