R E S E A R C H
Open Access
DNA methylation changes facilitated
evolution of genes derived from
Mutator
-like transposable elements
Jun Wang
1, Yeisoo Yu
2, Feng Tao
1, Jianwei Zhang
2, Dario Copetti
2, Dave Kudrna
2, Jayson Talag
2, Seunghee Lee
2,
Rod A. Wing
2,3and Chuanzhu Fan
1*Abstract
Background:Mutator-like transposable elements, a class of DNA transposons, exist pervasively in both prokaryotic and eukaryotic genomes, with more than 10,000 copies identified in the rice genome. These elements can capture ectopic genomic sequences that lead to the formation of new gene structures. Here, based on whole-genome comparative analyses, we comprehensively investigated processes and mechanisms of the evolution of putative genes derived fromMutator-like transposable elements in tenOryzaspecies and the outgroupLeersia perieri, bridging ~20 million years of evolutionary history.
Results:Our analysis identified thousands of putative genes in each of theOryzaspecies, a large proportion of which have evidence of expression and contain chimeric structures. Consistent with previous reports, we observe that the putativeMutator-like transposable element-derived genes are generally GC-rich and mainly derive from GC-rich parental sequences. Furthermore, we determine thatMutator-like transposable elements capture parental sequences preferentially from genomic regions with low methylation levels and high recombination rates. We explicitly show that methylation levels in the internal and terminated inverted repeat regions of these elements, which might be directed by the 24-nucleotide small RNA-mediated pathway, are different and change dynamically over evolutionary time. Lastly, we demonstrate that putative genes derived fromMutator-like transposable elements tend to be expressed in mature pollen, which have undergone de-methylation programming, thereby providing a permissive expression environment for newly formed/transposable element-derived genes.
Conclusions:Our results suggest that DNA methylation may be a primary mechanism to facilitate the origination, survival, and regulation of genes derived fromMutator-like transposable elements, thus contributing to the evolution of gene innovation and novelty in plant genomes.
Keywords:Comparative genomics, DNA methylation, GC content, Molecular evolution, MULEs, New genes,Oryza,
Recombination rate
Background
Mutators are class II DNA transposable elements (TEs) and have propagated widely across both prokaryotic and eukaryotic genomes through a “cut-and-paste” mechan-ism. TheMutatorsystem was first reported in maize [1, 2] and was later found in other plants, bacteria, fungi and protozoans [3–6]. Mutator-like transposable elements
(MULEs) are especially pervasive in higher plant genomes such as rice (Oryza sativa), in which more than 10,000 copies have been identified [6–9]. The typical structure of a MULE includes terminated inverted repeats (TIRs; usually 100–500 bp) flanking an internal sequence and one target site duplication (TSD; usually 8–11 bp) flanking each TIR [7, 10]. MULEs can be classified into two categories based on the properties of their internal sequences: (1) autonomous MULEs, containing internal sequences that encode transposases; and (2) non-autonomous MULEs, lacking the transposase gene. The * Correspondence:[email protected]
1Department of Biological Sciences, Wayne State University, 5047 Gullen Mall,
Detroit, MI 48202, USA
Full list of author information is available at the end of the article
transposase encoded by autonomous MULEs can transpose both autonomous and non-autonomous MULEs [11, 12]. Studies have demonstrated that MULEs can play import-ant roles in the generation of potentially functional genes and in modulating genic GC-content distribution in monocot genomes [7, 8, 13, 14].
New genes can be created through various mechanisms, such as whole-genome duplication, small-scale duplication, illegitimate recombination, horizontal gene transfer, gene fusion, de novo origination from non-coding DNA se-quence, RNA mediated retrotransposition, and dispersion/ origination through TEs [13, 15–22]. It has been demon-strated that non-autonomous MULEs can capture ectopic genomic sequences, such as gene fragments, and trans-pose them into new genomic locations, thereby forming putative new gene structures [8, 23, 24].
The discovery that MULEs can capture gene fragments was first reported in maize [23]. More recently, genome-wide analyses and individual case studies have revealed that non-autonomous MULEs carrying intact or partial gene fragments (termed Pack-MULEs) are abundant in many plant genomes [7, 10]. For example, analysis of the gold standard rice (i.e.,Oryza sativa ssp.japonica) refer-ence genome revealed the presrefer-ence of more than 3000 Pack-MULEs [7, 8]. Analyses of the internal sequences of Pack-MULEs have shown that they have the potential to serve as functional genes based on transcription (i.e., mRNA and small RNA), translation, and selective constraint evidence [8, 23]. Theoretic models of how MULEs acquire new sequences propose that internal se-quences and new TIR regions are introduced into MULEs by DNA repair and conversion of gaps on stem-loop structures or the invasion of excision regions of MULEs into ectopic sequences [7, 25, 26].
Due to the high abundance of MULEs and their remarkable functional roles in genome evolution, it is imperative to elucidate the origination, evolutionary processes, and regulatory mechanisms of MULE-derived genes in plant genomes. Further, answers to these questions could shed light on the evolutionary processes and fates of TE-derived genes in general. To address these questions, comparative genomic and phylogenetic analyses based on a set of high-quality genomic data from closely related species are required. In this study we interrogated a recently released set of genomes and transcriptomes from ten Oryza species (O. sativa ssp. japonica, O. sativa ssp. indica, O. nivara, O. rufipogon, O. barthii, O. glaberrima, O. glumaepatula, O. meridio-nalis, O. brachyantha, and O. punctata) and one outgroup species, Leersia perrieri, for MULE-derived putative genes. We systematically profiled the formation of these MULE-derived putative genes at both the genus and species level and determined the origination mecha-nisms and evolutionary processes leading to their
origination. Our results suggest that DNA methylation may be one of the primary mechanisms modulating the evolution of MULE-derived genes in plant genomes.
Results
Identification of non-autonomous MULEs across an 11-genome dataset
To understand the dynamics of MULE origination and evolution across a ~20 million year time span within a single genus, we first identified the majority of non-autonomous MULEs for each of 11 genome assemblies (see “Methods”). Overall, between ~7000 and 10,000 ele-ments were detected in each AA and BB genome assembly, which is similar to the number of MULEs previously identified in the O. sativa ssp. japonica RefSeq [7], and ~4000 and 5000 in the basalOryzaspeciesO. brachyantha and the outgroup L. perrieri (Fig. 1). Based on homolog searches, local syntenic region comparisons, and the phylogeny of the ten Oryza and one Leersia species (see “Methods” for more details), we further defined the presence and absence of each non-autonomous MULE in the 11 species and internal lineages. Using this information, combined with the principle of evolutionary parsimony [27], we inferred the evolutionary divergence times, namely the approximate age, of all annotated non-autonomous MULEs (Fig. 2), which allowed for the identification of species-specific MULES across the Oryza genus. As a result, we identified ~1000–2000 species-specific MULEs in domesticatedOryzaspecies, includingO. sativaandO. glaberrima, and their wild progenitors. Around 2000–6000 species-specific MULEs were found in the basal Oryza species, including O. glumipatula, O. meridionalis, O. punctata, andO. brachyantha, and the outgroup speciesL. perrieri. We also found that fewer MULEs were present in the internal branches, which were referred as the ancestors of multipleOryzaspecies (Fig. 2).
Fig. 1Number of non-autonomous MULEs across the 11-genome dataset. Non-autonomous MULEs were divided into two categories, genic-MULEs and nongenic-MULEs. The proportion of genic-MULEs among non-autonomous MULEs is shown inblueand the proportion of nongenic-MULEs is shown inred
[image:3.595.55.538.86.334.2] [image:3.595.56.541.417.694.2]We categorized MULEs based on their origination time points inferred from the presence and absence of MULEs in theOryzaphylogenetic species tree and drew density distributions of the amplification times of MULEs for each origination time point category for the 11 species. As shown in Additional file 1: Figure S1, MULEs in internal branches have longer amplification times compared with the MULEs in the terminal nodes of the Oryza phylogenetic tree. These results demon-strate that the origination time of MULEs inferred from the presence and absence of MULEs in the phylogeny tree is consistent with the amplification time computed from the sequence divergence of paralogous MULEs for each species.
Identification of open reading frames derived from non-autonomous MULEs
Non-autonomous MULEs have been shown to transpose ectopic genomic sequences to new genomic locations and potentially form novel functional gene structures [5, 9, 23, 24, 29, 30]. Based on both MAKER and GlimmerHMM annotations of all 11 genome assemblies, we searched for the presence of intact open reading frames (ORFs) located within all identified non-autonomous MULEs and classified them into two groups: (1) genic-MULEs, the ones that have overlap with annotated and intact transcripts (see “Methods”); and (2) nongenic-MULEs, the ones that do not meet the criteria for genic-MULEs. Both genic-MULEs and the previously defined Pack-MULEs are non-autonomous MULEs that do not contain transposase fragments. Pack-MULEs are defined to carry non-hypothetical parental protein frag-ments while genic-MULEs are merely required to contain ORFs. Since new genes may originate from MULE sequences without well-defined protein structures or sequences too old to be identified by sequence homology, the genic-MULE dataset developed in this study is ideal to study the origination and evolution of MULE-derived genes. Analysis of this dataset revealed the presence of between ~1000 and 2500 genic-MULEs (i.e., ~20–25 % of non-autonomous MULEs) for mostOryzaspecies, with the exception of the basalO. brachyanthaand L. perrieri species, which contained about 300 elements each (i.e., 6–10 % of non-autonomous MULEs) (Fig. 1).
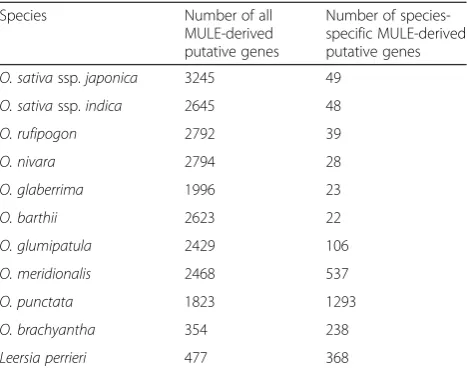
We defined MULE-derived putative genes as those in which the annotated ORFs contained at least 150 bp of coding sequence (CDS; i.e., encode 50 amino acids or more), the start and stop codons were intact, and at least 30 % of their transcript lengths have overlap with non-autonomous MULEs. Overall, we identified ~2000–3000 MULE-derived putative genes in the AA and BB genome Oryza species and ~350–500 MULE-derived putative genes in O. brachyantha and L. perrieri (Table 1). Among them, ~2 % appear to be species-specific and
originated from species-specific MULEs in domesticated Oryza species and their wild progenitors (Table 1). Based on the number of species-specific MULE-derived putative genes and the divergence times of the Oryza species, we infer that the rate of the new gene origin-ation via non-autonomous MULEs is in the order of 14 to 222 putative genes per million years per genome (Additional file 2: Table S1).
Structure, transcription, and functional constraints of MULE-derived genes
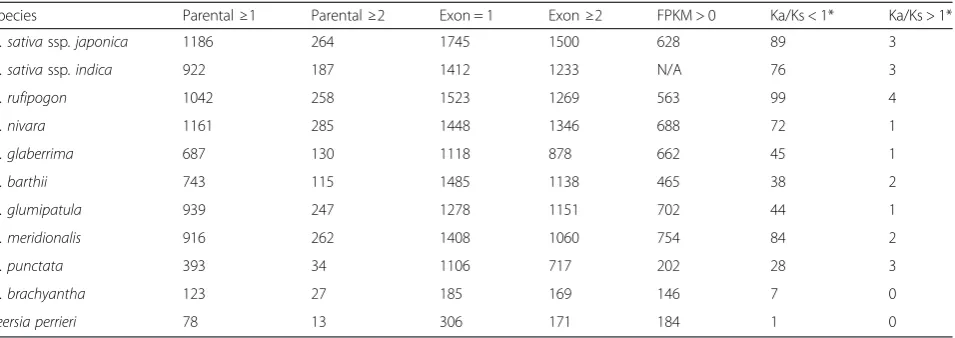
MULE-derived putative genes tend to have simple exon–intron structures with around half of them con-taining a single exon and fewer with multiple exons (Table 2). The parental genes of MULE-derived putative genes are the genes from which MULEs capture their
internal sequences. Based on sequence homology
searches, we attempted to identify the parental genes of as many MULE-derived putative genes as possible in all 11 species (see “Methods”). For most Oryza species, we found that ~30–40 % of the MULE-derived putative genes acquired their ORF sequences from at least one parental gene. Interestingly, ~100–300 MULE-derived putative genes (5–10 %) acquired their ORF sequences from at least two parental genes, thereby forming novel chimeric gene structures (Table 2).
To determine whether any of the MULE-derived putative genes in our 11-genome data set are under functional constraints and to detect selective forces after MULE acquisition [28], we estimated Ka/Ks values based on sequence divergence of MULE-derived putative genes and the most similar paralogous non-autonomous MULEs using a modified gKaKs pipeline with Codeml option from PAML [31, 32]. For most Oryza species, ~100
MULE-Table 1Number of MULE-derived putative genes identified across the 11-genome data set
Species Number of all
MULE-derived putative genes
Number of species-specific MULE-derived putative genes
O. sativassp.japonica 3245 49
O. sativassp.indica 2645 48
O. rufipogon 2792 39
O. nivara 2794 28
O. glaberrima 1996 23
O. barthii 2623 22
O. glumipatula 2429 106
O. meridionalis 2468 537
O. punctata 1823 1293
O. brachyantha 354 238
[image:4.595.305.539.109.295.2]derived putative genes (i.e., ~4 % of the total number of putative genes detected) had Ka/Ks values significantly less than 1 (likelihood ratio test, false discovery rate q value <0.05; Table 2). And a few putative genes (0–4) had Ka/Ks values significantly larger than 1 (likelihood ratio test, false discovery rate q value <0.05; Table 2).
To determine the number of MULE-derived putative genes that are transcribed, we analyzed baseline RNA-seq data derived from panicle, root, and leaf tissues from 10 of the 11 species. We mapped all available RNA-seq data to the MULE-derived putative gene data set and measured gene expression intensity by computing frag-ments per kilobase of exon per million reads (FPKM) values (see “Methods”). By calibration with expression profiles from intergenic sequences, we considered a FPKM value >0 as the cutoff threshold for evidence of expression. Overall, about 20–40 % of the MULE-derived putative genes in most species had FPKM values >0 in at least one tissue (Table 2).
GC-rich MULE-derived genes from GC-rich parental sequences
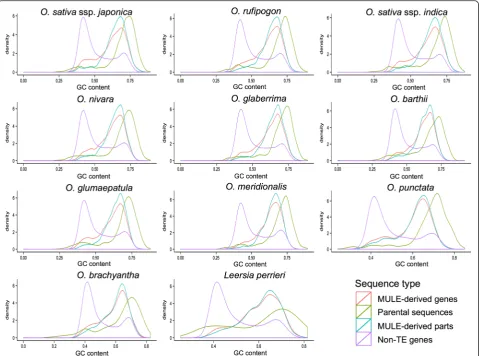
Previous studies showed that MULEs selectively capture ectopic GC-rich sequences and insert them into the 5′ end of gene ends, thereby modulating the GC gradient of monocot genes [7, 8]. To test this observation, we cal-culated the GC content, i.e., the proportion of GC bases within the sequence, of MULE-derived putative genes. We consistently found that Oryza/Leersia MULE-derived putative genes, especially the gene fragments de-rived from MULEs, have a much higher GC content compared with non-TE genes across the 11 genome data-set (Fig. 3; Wilcoxon rank sum test, P value <2.2e-16). Further, the GC content of their parental sequences is even higher, suggesting that MULEs acquired parental se-quences selectively (Fig. 3; GC content of MULE-derived
putative genes is less than that of the MULE internal se-quences of MULE-derived putative genes which is less than that of the parental sequences of MULE-derived putative genes; Wilcoxon rank sum test, P< 0.05, ex-cept for the comparison of MULE-derived putative genes and the MULE internal sequences in L. perrieri and O. brachyantha). Moreover, we examined the paren-tal sequences of species-specific MULE-derived putative genes which originated after the divergence of each spe-cies and likely represent the most recent sequence capture events and found that they also are GC-rich, suggesting that MULEs prefer to capture GC-rich sequences initially.
Parental sequences of MULE-derived putative genes are located in regions of the genome that are hypomethylated and highly recombinogenic
As previously proposed, MULEs acquire parental se-quences by using DNA repair/conversion mechanisms through invasion into ectopic sequences [26]. This moti-vated us to investigate whether the chromatin structure (i.e., methylation status, recombination rate) of MULE parental sequences has special signatures that make them more susceptible for invasion. As recombination rates are positively associated with chromatin remodel-ing [33], they may be related to parental sequence cap-tured by MULEs. To address this hypothesis, we analyzed the recombination rate of the parental sequences of MULE-derived putative genes in O. sativa ssp. japonica (see “Methods” for more details). Our analysis showed that these parental sequences are primarily located in re-gions that have significantly higher recombination rates than non-TE genes, which served as controls (Wilcoxon rank sum test,P= 1.874e-09/3.755e-08).
[image:5.595.62.540.98.267.2]Since high DNA methylation levels are generally as-sociated with condensed chromatin structure [34], we also wanted to test whether DNA methylation levels
Table 2Structure, transcription, and functional constraint values of MULE-derived putative genes across the 11-genome dataset
Species Parental≥1 Parental≥2 Exon = 1 Exon≥2 FPKM > 0 Ka/Ks < 1* Ka/Ks > 1*
O. sativassp. japonica 1186 264 1745 1500 628 89 3
O. sativassp. indica 922 187 1412 1233 N/A 76 3
O. rufipogon 1042 258 1523 1269 563 99 4
O. nivara 1161 285 1448 1346 688 72 1
O. glaberrima 687 130 1118 878 662 45 1
O. barthii 743 115 1485 1138 465 38 2
O. glumipatula 939 247 1278 1151 702 44 1
O. meridionalis 916 262 1408 1060 754 84 2
O. punctata 393 34 1106 717 202 28 3
O. brachyantha 123 27 185 169 146 7 0
Leersia perrieri 78 13 306 171 184 1 0
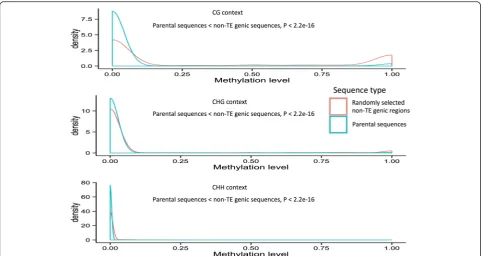
of the parental sequences of MULE-derived putative genes are lower than those of control sequences. Using a DNA methylation dataset for O. sativa ssp. japonica (see “Methods”), we cataloged the methylation status of all parental sequences where DNA methylation data were available (~1742) and compared these data with randomly selected genic regions (~12,064) from a set of control non-TE genes across the rice genome. Indeed, we observed that the DNA methylation levels of the parental sequences of MULE-derived putative genes were low, with the majority around zero, which was significantly lower than the non-TE gene controls (Wilcoxon rank sum test, P< 2.2e-16 in CG, CHG, and CHH contexts; Fig. 4). We also analyzed an additional DNA methylation dataset from the O. nivara genome and found a similar trend (Additional file 1: Figure S2).
Dynamic methylation changes and evolution of genic-MULEs
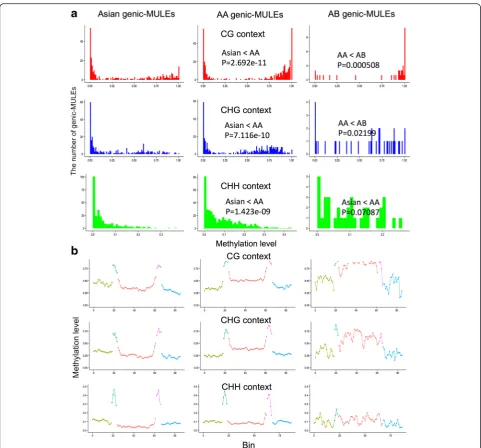
Since the parental sequences of MULE-derived putative genes are undermethylated relative to other non-TE genic sequences, we next determined the methylation patterns of genic-MULEs themselves and whether their methylation patterns change over evolutionary time. To perform this analysis we chose three groups of genic-MULEs in the O. sativa ssp. japonica genome with increasing evolutionary divergence times based on our previously constructed phylogenetic tree of the genic-MULEs: (1) “Asian genic-MULEs” originating within Asian Oryza species less than 0.8 million years ago (MYA); (2)“AA genic-MULEs” originating after the AA genomeOryzasplit from the BB genome species but be-fore the AA genome species diverged ~2.5–6.8 MYA;
[image:6.595.59.539.88.444.2]and (3) “AB genic-MULEs” originating before the AA and BB genome species split ~6.8–26 MYA (Fig. 2). Overall, the methylation levels of genic-MULE internal sequences in all three cytosine contexts were found to increase over evolutionary time as the methylation levels in the internal regions of Asian genic-MULEs are less than those of AA genic-MULEs which are less than those of AB genic-MULEs (Wilcoxon rank sum test, P< 0.05, except the comparison of AA genic-MULEs and AB genic-MULEs in the CHH contextP= 0.07087; Fig. 5a).
Further, gene body methylation levels of MULE-derived putative genes also increased as the associated genic-MULEs became older, i.e., the methylation levels in the gene bodies of Asian MULE-derived putative genes were less than those of AA MULE-derived putative genes which were less than those of AB MULE-derived putative genes (Wilcoxon rank sum test, P< 0.05, except the comparison of AA MULE-derived pu-tative genes and AB MULE-derived pupu-tative genes in the CHH context; Additional file 1: Figure S3a). We further observed that the methylation levels of the TIR regions in the CHH context decrease over time following a pattern where methylation levels in the TIRs of Asian genic-MULEs are greater than those of AA genic-genic-MULEs which are greater than those of AB genic-MULEs (Wilcoxon rank sum test,P< 0.0501; Fig. 5b).
Finally, the methylation levels in promoters of MULE-derived putative genes are similar to those in the mixed patterns of MULE TIR and internal regions, with methy-lation levels in the promoters of Asian MULE-derived putative genes less than those of AA MULE-derived putative genes for CG, CHG, and CHH contexts, and those of AA MULE-derived putative genes are greater than those of AB MULE-derived putative genes for CHH contexts (Wilcoxon rank sum test, P< 0.05). This phenomenon is conceivable since promoters of MULE-derived putative genes tend to locate in both TIR and internal sequences of MULEs, which might lead to the mixed pattern of the two types of regions. Additionally, the methylome data were processed with a modified version of genomemapper (http://1001genomes.org/ software/genomemapper.html) which only used reads with unique genomic targets. Therefore, this method excluded the possibility that the lower methylation levels detected in the younger genic-MULEs resulted from mis-counting reads from their homologous par-ental sequences, which are generally lowly methylated. It could be argued that the higher methylation levels observed in older MULE internal sequences could be achieved by the accumulation of highly methylated TEs inserted into older MULEs. To test this possibility, we measured TE content within genic-MULEs (defined as
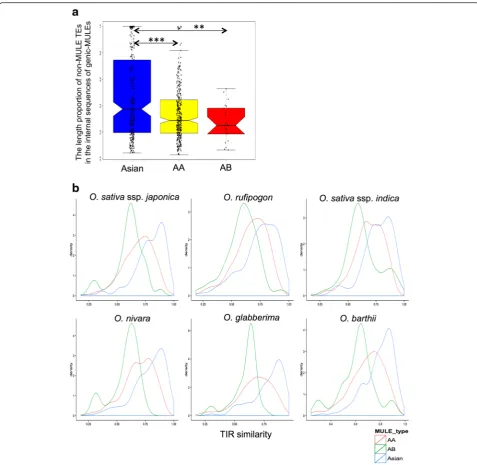
[image:7.595.57.539.87.343.2]the proportions of non-MULE TEs in the internal sequences of genic-MULEs) for the above three evo-lutionary ages of genic-MULES. This analysis revealed that the TE content in the older genic-MULEs was actually significantly lower than, or similar to, that found in the younger elements (the TE content of Asian genic-MULEs was greater than that of AA genic-MULEs; that of Asian genic-MULEs was greater
than that of AB MULEs; and that of AA genic-MULEs is not significantly different from that of AB genic-MULEs; Wilcoxon rank sum test, P = 3.006e-5 and P = 0.004681; Fig. 6a). Thus, this result rejected the possibility that the higher methylation levels observed in older MULE internal sequences were caused by the accumulation of higher TE contents in older MULEs.
Fig. 5Methylation levels of genic-MULEs identified in theO. sativassp.japonicagenome change over evolutionary time.aThe methylation levels of MULE internal sequences with three evolutionary ages (Asian genic-MULEs, AA genic-MULEs, and AB genic-MULEs) in three cytosine contexts (CG context inred, CHG context inblue, and CHH context ingreen). Methylation levels of MULE internal sequences increase over time in three cytosine contexts (Wilcoxon rank sum test,P< 0.05, except the comparison of AA genic-MULEs and AB genic-MULEs in the CHH context,P= 0.07087).
[image:8.595.57.539.85.533.2]To investigate the observed reduction of TIR methyla-tion levels in a CHH context, we hypothesized that a decrease in TIR similarity over evolutionary time may be the cause. As demonstrated earlier, highly diverged TIRs could have two consequences. First, the transposase could not recognize the TIRs flanking the TEs and thus could not excise TEs out of their donor positions. Consequently, TEs might lose mobility. Second, TEs with divergent TIRs might not be able to fold back to form
hairpin structures; thus double-stranded RNAs might not be processed into small interference RNAs (siRNAs) to induce de novo DNA methylation in a CHH context.
Consequently, TIRs could not be recognized by
asymmetrical methylation machinery [35]. To test this hypothesis, we examined the similarity of the two copies of paired TIRs for each of the domesticated Oryza speciesO. sativassp. japonica,O. sativassp. indica, and O. glaberrima with their wild progenitors O. nivara, O.
[image:9.595.58.536.86.551.2]rufipogon, and O. barthii, respectively, in genic-MULEs with the aforementioned three evolutionary ages. Indeed, TIR similarity decreased over evolutionary time as TIR similarity of Asian/African genic-MULEs was greater than that of AA genic-MULEs which was greater than that of AB genic-MULEs (Wilcoxon rank sum test, P< 0.003; Fig. 6b). Furthermore, the gradient of TIR similarity over time also demonstrated that the sample of MULEs with different evolutionary ages was not biased toward MULEs with the same criteria of TIR similarity in our MULE identification methods; thus, we did include cases of older MULEs with more divergent TIRs.
However, we might have included more false positive MULEs in either older or younger MULEs from our identification approach, leading to the above trends. To test this possibility, we re-performed the above analyses using the overlapping O. sativa ssp. japonica genic-MULEs from a previous study [7] and from our study. The patterns of methylation, TE coverage, and TIR similarity all maintained similar trends, excluding the possibility of biased inclusion of false positives in older or younger MULEs (Additional file 1: Figures S3b, S4, and S5). To test whether our observed patterns are O. sativa ssp. japonica species-specific, we conducted the above analyses forO. nivaragenic-MULEs. The patterns of methylation, TE coverage, and TIR similarity all had similar trends, suggesting this is a general behavior of genic-MULEs in Oryza genomes (Additional file 1: Figures S3c, S6, and S7). We further tested the reliability of our results with the BS-seq data generated by Li et al. [36] and found similar trends (data not shown), suggest-ing the robustness of our results. Overall, these results imply that the evolution of genic-MULEs and MULE-derived putative genes is associated with dynamic DNA methylation levels in MULE internal and TIR regions.
Methylation of genic-MULEs directed through small RNA-mediated pathways
It has been shown that small RNAs trigger the methyla-tion of MuDR in maize and that 24-nucleotide small RNAs are the most abundant small RNA species that can induce DNA methylation [37–40]. To track the pos-sible mechanism regulating the methylation of MULE internal sequences and TIRs, we identified 24-nucleotide small RNA occupancy in the internal and TIR regions of the three groups of genic-MULEs, with the aforemen-tioned evolutionary ages, in 12 tissues/conditions of O. sativa ssp. japonica, including tricellular pollen (TCP), bicellular pollen (BCP), uninucleate microspores (UNMs), callus, leaf, seedling, root, shoot, panicle, two RNA interference lines, and one wild-type plant. It has been demonstrated that a considerable subset of RNA-mediated DNA methylation might be directed by multiple mapping small RNA, which contains multiple mapping
locations in the genome. However, a multiple mapping small RNA does not induce methylation for all homolo-gous loci [41]. Here, we attempted to study the causal relationships between DNA methylation and small RNA, so our analyses mainly focused on unique-mapping small RNAs to avoid mis-association between small RNAs and their true activity location [41, 42].
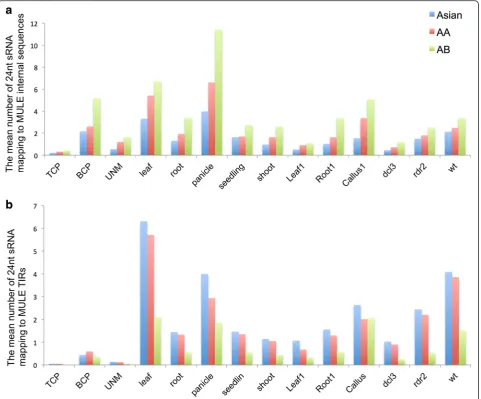
Interestingly, the mean number of 24-nucleotide small RNAs uniquely mapping to MULE internal sequences was found to increase over evolutionary time in the 12 tissues/ conditions tested (the mean number of 24-nucleotide small RNAs uniquely mapping to the internal sequences of Asian MULEs was less than that of AA genic-MULEs which was less than that of AB genic-MULE, t-test, P< 0.002; Fig. 7a), whereas the mean number of 24-nucleotide small RNAs uniquely mapping to MULE TIR regions decreased over evolutionary time (the mean number of 24-nucleotide small RNAs uniquely mapping to the TIR regions of Asian genic-MULEs was greater than that of AA genic-MULEs which was greater than that of AB genic-MULEs,t-test,P< 0.004; Fig. 7b). Further, the lengths of older genic-MULE internal sequences is similar to or shorter than those of younger genic-MULEs (the lengths of AA genic-MULE and AB genic-MULE internal sequences are significantly shorter than the lengths of Asian genic-MULE internal sequences, Wilcoxon rank sum test, P< 0.05, and the lengths of AA genic-MULE internal sequences are similar to those of AB genic-MULE internal sequences). Therefore, the observation that the mean number of 24-nucleotide small RNAs uniquely mapping to the internal sequences of older genic-MULEs is higher than that of younger genic-MULEs is not due to the longer length of the internal sequences of older genic-MULEs. For TIR regions, since they usually have similar length, the length factors should not affect the decreasing mean number of 24-nucleotide small RNAs uniquely mapping to the TIRs over time. When considering unique and multiple mapping small RNAs together, the mean number of 24-nucleotide small RNAs mapping to MULE TIR regions decreased over time, similar to the aforemen-tioned trend (t-test, P< 0.005). Thus, the change in 24-nucleotide small RNA abundance in the internal and TIR regions of genic-MULEs over time is consistent with the dynamic methylation levels in these regions over time presented above, suggesting that methylation of MULEs might be directed by the 24-nucleotide small RNA-mediated pathway.
Association of biased expression of MULE-derived putative genes with developmental de-methylation in mature pollen
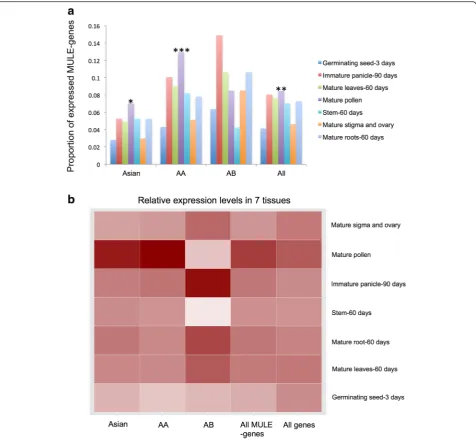
putative genes inOryzaalso have biased tissue expression patterns. We focused on the expression patterns of MULE-derived putative genes in O. sativassp. japonica, which have comprehensive expression profiles from multiple tissue and developmental stages (i.e., 3-day seed, 60-day mature leaf, 60-day mature root, 60-day stem, 90-day immature panicle, mature pollen, mature stigma, and ovary). Expression profiles of MULE-derived putative genes from Asian genic-MULEs, AA genic-MULEs, AB genic-MULEs, and all genic-MULEs were compared with allOryzaannotated genes. Interestingly, the proportion of MULE-derived putative genes expressed in mature pollen was higher than that of allOryzaannotated genes (Fig. 8a;
Fisher exact test,P= 0.0183 for Asian MULE-derived pu-tative genes, P= 0.0006463 for AA MULE-derived putative genes, P= 0.001295 for all MULE-derived puta-tive genes).
We then examined the relative expression levels among the seven tissues for genes that were expressed in at least one tissue and also found that MULE-derived putative genes, especially those from younger genic-MULEs, have higher expression levels in mature pollen compared with allOryza annotated genes (Fig. 8b). Fur-ther, by integrating the expression profiles with the small RNA analysis described above, we observed that mature TCP tissue had the lowest 24-nucleotide small RNA
[image:11.595.59.541.88.487.2]occupancy in all three age groups of genic-MULE in-ternal and TIR regions compared with all other tissues tested (Fig. 7). If 24-nucleotide small RNAs mediate the methylation of genic-MULEs, the lack of 24-nucleotide small RNAs in TCP might be associated with the de-methylation of TCP, which might lead to the mature pollen-biased expression pattern we observed for MULE-derived putative genes. This is also consistent with the fact that the vegetative nucleus in TCP undergoes a
developmental de-methylation reprogramming stage [38, 45], which could provide a more favorable expression environment for newly formed/TE-derived genes.
Discussion
Rapid turnover of non-autonomous MULEs and MULE-derived gene origination
The genus Oryza contains 24 species that have been classified into 11 distinct genome types, represented by
Fig. 8Expression profile of MULE-derived putative genes inO. sativassp.japonica.aProportion of MULE-derived putative genes expressed across seven tissues with different evolutionary ages (Asian genic-MULEs, AA genic-MULEs, AB genic-MULEs, and all genic-MULEs). A higher proportion of the MULE-derived putative genes are expressed in mature pollen compared with all annotatedOryzagenes (Fisher exact test, *P= 0.0183 for Asian MULE-derived putative genes, ***P= 0.0006463 for AA MULE-derived putative genes, **P= 0.001295 for all MULE-derived putative genes).
[image:12.595.61.538.87.529.2]six diploids and four allotetroploids [46], that vary over a 3.6-fold genome size range, i.e., from 362 Mb (O. brachyantha) to 1283 Mb (O. ridleyi). Genomic analyses across the genus have demonstrated that the heteroge-neous size and evolution of the Oryza genomes are largely affected by TE proliferation/elimination and poly-ploidy [47, 48]. Using a recently generated high-quality 11 genome dataset of closely related Oryza species, we systematically and comprehensively generated a unique genus-wide vertical database of MULEs and investigated their evolutionary and sequence capture history over a ~20 million year time frame.
The distribution and amount of MULE accumulation identified across the Oryza and Leersia genome dataset revealed several general patterns. First, the number of MULEs identified in the basal genomes ofL. perrieriand O. brachyantha (Fig. 1) was ~600 each, whereas the remaining nine Oryza species contained three- to five-fold as many elements. This suggests that MULE prolif-eration was relatively passive in the basal species and active across the majority of theOryza species tested or that fewer MULEs have survived in the basal species. Sec-ond, the ratio of genic- to nongenic-MULEs inL. perrieri and O. brachyantha is very low compared with those in other Oryza species (Fig. 1). This difference may be impacted by genome size. The numbers of genic-MULEs in the 11 genomes seem to positively correlate with genome size (Pearson correlation coefficient = 0.6689487, P= 0.0244) but those of nongenic-MULEs do not (Pearson correlation,P> 0.05). The basal species have smaller gen-ome sizes compared with the otherOryzaspecies, which might explain the lower proportion of genic-MULEs in their genomes. Third, the number of MULEs in the in-ternal branches of the phylogenetic tree is much lower than that in the terminal species nodes (Fig. 2), revealing that MULE sequences were very rapidly removed if not selected for or might not be recognizable after a long evo-lutionary time. Fourth, incomplete lineage sorting has been proposed as a general phenomenon for the evolution of TEs [49]. However, the consistency among the origin-ation time of MULEs inferred from the phylogenetic tree, the amplification time of MULEs inferred from sequence divergence of MULEs, and the speciation time of the Oryza species (Additional file 1: Figure S1) suggest that incomplete lineage sorting may not play a major role in the evolution of non-autonomous MULEs, although it could partially explain it.
New genes can be generated through various mecha-nisms [18, 19, 21, 22]. Previous studies indicate that Pack-MULEs can serve as“vehicles”for the formation of potentially functional genes in O. sativa. We identified thousands of potentially functional putative genes that arose rapidly and evolved from non-autonomous MULE sequences in Oryza. By defining the species-specific
origination of MULE-derived putative genes, we deter-mined that new genes originating from non-autonomous MULEs could be one of the main sources of new gene origination inOryza. More interestingly, MULE-derived putative genes tended to arise from multiple parental se-quences, which could potentially form novel chimeric gene structures. This is consistent with our previous discovery that the formation of chimeric ORFs is the general mode of new gene origination in Oryza species [15, 50]. We also observed that only a small proportion of MULE-derived putative genes show functional con-straints based on Ka/Ks ratios, suggesting the majority of MULE-derived putative genes evolved neutrally and could proceed rapidly to extinction due to genetic drift after a certain evolutionary time period. However, ap-proximately 100 MULE-derived putative genes in most Oryza species show evidence of natural selection, sug-gesting a notable amount of MULE-derived putative genes could play functional roles in the evolution of Oryzagenomes and species.
Previous studies have shown that MULEs are able to redistribute GC-rich sequences to affect the GC gradient of genes within some monocot genomes [7]. By ex-tending our analysis to ten closely related Oryza and one Leerisa species, we consistently demonstrated that MULE-derived putative genes are GC-rich, especially in the parts derived from MULE internal sequences, which are derived from GC-rich parental sequences selectively captured by MULEs. Remarkably, we also found that MULEs tend to acquire sequences from genomic regions with low methylation levels and high recombination rates, which might provide a more open chromatin structure that could promote the invasion/conversion of MULEs in the process of acquiring parental sequences.
DNA methylation might facilitate the survival of MULE-derived genes
A survey of small RNA occupancy in genic-MULEs suggested that 24-nucleotide small RNAs might mediate the methylation of MULE internal sequences and TIRs through the RNA-mediated DNA methylation pathway. Moreover, we showed that MULE-derived putative genes tend to be transcribed in mature pollen. This interesting phenomenon coincides with testis-biased expression pat-terns of new genes in Drosophila and mammals and is also consistent with the “out of pollen” expression pat-tern of Arabidopsis new genes, all of which are related to reproductive tissues. Both testis and pollen potentially provide an open chromatin structure that results from developmental chromatin remodeling in these tissues and is permissive for gene expression [43, 45, 54]. Further, we found a consistent pattern whereby genic-MULEs have the lowest occupancy of 24-nucleotide small RNAs in TCP, where vegetative pollen cells experience overall de-methylation and the loss of CG methylation [43, 45], suggesting the involvement of 24-nucleotide small RNAs in the regulation of DNA methylation. These results further support that pollen-biased expression of MULE-derived genes may be related to the developmental epigenetic reprogramming of repro-ductive tissues, which could help to promote the expres-sion of newly formed/TE-derived genes.
Conclusions
Our results suggest that DNA methylation may play an important role in the origination and survival of MULE-derived genes through modulation of their stability and expression, which might be a general mechanism for all the TE-derived genes, thereby contributing to the evolu-tion of gene novelty. Further experimental studies should be conducted in this area to explore and demon-strate the causal logistics between DNA methylation and the evolution of TE-derived new genes.
Methods
Plant genomes, transcriptomes, methylomes, and annotation data
The complete set of genome sequences and“gff”MAKER [55] annotation files for tenOryzaspecies and L. perrieri were downloaded from the iPlant Collaborative (iPlant) data store (http://data.iplantcollaborative.org/) hosted by the Arizona Genomics Institute (AGI) at the University of Arizona. Plant TE and repeated sequence (PReDa) libraries were generated by AGI [56]. Baseline RNA-seq data were generated by AGI from three tissues, including leaf, root, and panicle, from nineOryza and oneLeersia species, including O. sativa ssp. japonica, O. nivara, O. rufipogon, O. glaberrima, O. barthii, O. glumipatula, O. meridionalis,O. punctata,O. brachyantha, andL. perrieri. The raw digital gene expression (DGE) reads derived from seven O. sativa ssp. japonica tissues were
downloaded from the NCBI Short Read Archive (http://www.ncbi.nlm.nih.gov/sra/) with accession num-bers SRR074144 (germinating seed at 3 days), SRR074145 (immature panicle at 90 days), SRR074146 (mature leaves at 60 days), SRR074147 (mature pollen), SRR074151 (stem at 60 days), SRR074170 (mature stigma and ovary), and SRR074171 (mature roots at 60 days) [57]. Processed small RNA data fromO. sativassp. japonicain 12 tissues or conditions were downloaded from https://mpss. danforthcenter.org/dbs/index.php?SITE=rice_sRNA, which lists the codes (with original references) of the down-loaded tissues or conditions, including leaf, root, BCP, callus, TCP, UNM [58], SC1I (seedling), RCn2D (root), ShCn2D (shoot), PC1C (panicle) [59], WT2003s (leaf ) [60],dcl3_sdl,rdr2_sdl, andwt_sdl[61]. Processed BS-seq data were downloaded from the iPlant Collaborative (iPlant) data store.
Identification of MULEs, genic-MULEs, nongenic-MULEs, and MULE-derived putative genes
The annotated Oryza sativa ssp. japonica MULE TIR sequences were obtained from Ferguson et al. [7]. To identify de novo MULE TIR families, RepeatScout (version 1.0.5) [62] was used to scan all ten Oryza and one Leerisa genomes. Repeat families identified by RepeatScout with at least 20 copies in the genome were collected and grouped with consensus sequences of the known O. sativa MULE TIR sequences. To remove the sequences of other known non-MULE repeats from the merged repeat sequence dataset (described above), Repeat-Masker (A.F.A. Smit, R. Hubley, and P. Green, http:// repeatmasker.org) was used to mask the merged sequences with plant repeat sequences (i.e., the classified PReDa sequences) as the library [56]. Repeat sequences with≥30 % of the length masked by known non-MULE elements from PReDa [56] were discarded. To determine whether each de novo consensus sequence represented a MULE TIR, RepeatMasker was run on all 11 genome sequences with the above remaining TIR sequences as the library.
internal sequence and we required a tandem TSD flank-ing each TIR of a MULE. TSDs were allowed to have a maximum of a 10-bp swing from the putative ends of each TIR [7]. Next, we used TBLASTN on annotated transposase proteins andMutator transposases collected from NCBI against MULE sequences. MULEs that con-tained transposase proteins/Mutator transposases (TBLASTN E value <1e-9) were removed. All remaining MULEs were defined as“non-autonomous MULEs”.
To identify genic-MULEs, we examined whether non-autonomous MULE sequences overlapped with annotated ORFs. We compared the genomic coordinates of non-autonomous MULEs with the coordinates of transcripts annotated with MAKER (Stein et al., in preparation). For MULEs that did not overlap with the MAKER annotated genes, GlimmerHMM was used to annotate potential gene structures within them. If a MULE overlapped by at least 30 % the length of a MAKER/GlimmerHMM annotated transcript which had at least 150 bp of coding sequence, including intact start and stop codons, and did not carry any transposases, the MULE was annotated as a “ genic-MULE”. Overlapping putative genes with at least 150 bp of coding sequence and intact start and stop codons (an-notated by MAKER/GlimmerHMM) were defined as MULE-derived putative genes. Finally, non-autonomous MULEs that did not carry any transposases or potential gene fragments were annotated as“nongenic-MULEs”.
Identification of the presence and absence of MULEs in 11 genomes
Using one genome, both identity and local syntenic evi-dence were used to determine the presence of non-autonomous MULEs in each of the ten other genomes (excluding its own genome). Sequences in upstream and downstream 2-kb windows flanking MULEs together with MULE sequences (i.e., 1 bp–1 kb upstream, 1–2 kb upstream, 1 bp–1 kb downstream, 1–2 kb downstream, and MULE sequences) were collected from each of the 11 genomes and used to probe each of the ten other genomes using BLAT [63]. This process was done iteratively for each single species. To satisfy our identity criterion, a MULE sequence was required to have the best BLAT hit in the other species with at least 30 % coverage of its entire length.
For synteny evidence, a MULE sequence was required to satisfy at least one of the following two criteria: (1) the best BLAT hit of the MULE sequence in other species was located on the same chromosome as the one in its own species and the best BLAT hit of at least one flanking se-quence was located within 4 kb upstream or downstream of the best BLAT hit of the MULE sequence in the other species; or (2) the best BLAT hits of at least two flanking sequences were located within 4 kb upstream or down-stream of the best BLAT hit of the MULE sequence in the
other species. If the best BLAT hit of a MULE passed both of the above identity and syntenic criteria, we inferred that the MULE under investigation was present in other species.
Based on the presence or absence information of each MULE in the 11 species, the evolutionary parsimony principle, and the phylogenetic tree of the 11 species [46], the origination time point of a MULE to an exter-nal species or interexter-nal branches was assigned (Fig. 2). For example, (1) if a MULE was identified in only one species but not the other ten species, it was annotated as a species-specific MULE. (2) If a MULE was identified in both O. sativa ssp. japonica and O. rufipogon, but not another species, it was inferred that it originated before the divergence of O. sativa ssp. japonica and O. rufipo-gonbut after the split of this branch from the rest of the Oryzaspecies. (3) If a MULE was found in all the Asian Oryza species but not the other species, it was inferred that it originated before the divergence of Asian species but after the split of Asian species from the rest of the Oryzaspecies. (4) If a MULE was only present in all AA genome Oryza species but not the other species, it was inferred that it originated before the divergence of AA genome Oryzaspecies but after the split of AA genome Oryza from BB genome Oryza (as an AA-MULE). We collected the number of non-autonomous MULEs at each evolutionary time point and listed them in the phylogenetic tree of the 11 genomes (Fig. 2).
To validate the above origination time (age) assignment of non-autonomous MULEs, we estimated the amplifica-tion time of each MULE. We computed the amplificaamplifica-tion time of each MULE based on the sequence divergence of each non-autonomous MULE and its most similar paralo-gous non-autonomous MULE that belonged to the same MULE TIR family [28]. We conducted all-by-all BLAT searches of all non-autonomous MULEs for each species. Each MULE would then be aligned with its second best hit with the same MULE TIR, followed by a calculation of the corresponding sequence divergence using the baseml module of PAML (version 4.7) [32]. Based on the formula T = k/2r, where k = sequence divergence and r = substitu-tion rate, and calibrating with r = 1.3 × 10⁻⁸ per site per year for rice [28], we computed the amplification time of each MULE. MULEs were categorized based on their origination time points, inferred from the presence and absence of MULEs in theOryzaphylogenetic species tree, and we drew the density distribution of the amplification time of MULEs in each origination time point category for the 11 species.
Identification of species-specific MULE-derived putative genes
were extracted for each genome and we used BLAT or BLASTP to identify homologous sequences in the other ten genomes. If the coordinates of the best BLASTP protein hit (with BLASTP E-value <1e-10) of a MULE-derived putative gene in another species overlapped with the coordinates of its best BLAT genomic sequence hit in the same species, we assumed the presence of the MULE-derived putative gene in the other species. If a gene had a best BLAT genomic sequence hit in another genome but the coordinates did not overlap with the best BLASTP protein hit in the same genome, or the best BLASTP protein hit did not exist (e.g., did not satisfy BLASTP E-value <1e-10), the genomic sequence of the best BLAT genomic sequence hit in the other gen-ome was extracted and annotated with Glimmer. Then the peptide sequence of the MULE-derived putative gene was used as a probe against the Glimmer-annotated pep-tide sequence using BLASTP. If the BLASTP E value was <1e-10, we assumed that the MULE-derived puta-tive gene was present in the other species. For the remaining cases, we assumed that the MULE-derived putative gene was not present in the other species. If a MULE-derived putative gene was absent in all ten spe-cies, we annotated it as a species-specific MULE-derived putative gene.
Identification of the parental sequences of MULE-derived putative genes
For each species, non-MULE TE sequences from the plant repeat sequence library (PReDa [56]) were used to mask MULE-derived putative gene sequences with RepeatMasker and then BLASTN was used to map the masked MULE-derived putative gene sequences against the corresponding whole-genome sequence. We also used TE and MULE TIR sequences to mask the corre-sponding whole genome sequence with RepeatMasker to generate TE and MULE TIR coordinates of the genome. The coordinates of the BLASTN hits of MULE-derived putative gene sequences were then compared with those of MULE TIRs and TEs. BLASTN hits that were not flanked with MULE TIRs and not associated with TEs and had the highest identity score (with BLASTN E value <1e-10) were annotated as parental sequences of MULE-derived genes [13]. The genomic coordinates of these parental sequences were further compared with MAKER annotated genes. If the coordinates of the parental sequences overlapped with those of the MAKER genes, the MAKER genes were classified as the corre-sponding parental genes [13].
Ka/Ks computation
Ka/Ks ratios between the CDS of MULE-derived puta-tive genes and their closest paralogous non-autonomous MULE sequences were computed using a modified
gKaKs pipeline [28, 31]. We used the CDS of MULE-derived putative genes to query all the non-autonomous MULEs using BLAT. Each MULE-derived putative gene CDS was then paired with its most similar MULE se-quences with the same MULE TIR. Lastly, we computed Ka/Ks ratios of paired sequences with the modified gKaKs pipeline using the Codeml option from PAML [31, 32]. This pipeline can handle the Ka, Ks, and Ka/Ks calcula-tions between one CDS sequence and an un-annotated genomic sequence by automatically removing frame-shift and premature stop codons in the sequence alignment. We estimated Ka/Ks with two Codeml models: (1) Ka/Ks varying freely and (2) Ka/Ks fixed at 1 (neutrality). Tests for significant difference (P) between two models were calculated using the likelihood ratio test, where the test statistic is 2Δl = 2 × (l1−l2) with l1and l2as the log of the maximum likelihood (ML) estimated from the two models compared. It is assumed that 2Δl is approximately distrib-uted asX2with difference of model parameters as degrees of freedom (d.f.). We then computed the corresponding q value, namely the false discovery rate, for each P value of the likelihood ratio test using the qvalue package of R. A q value of≤0.05 was used as the significance cutoff [64, 65].
Estimation of the expression of MULE-derived putative genes
RNA-seq reads from leaf, root, and panicle of nine Oryza and one Leersia species were mapped to their corresponding genomic regions with TopHat and FPKM was computed with Cufflinks. FPKM values were then mapped to the genes of interest. If the overlapping length between a FPKM region and the gene of interest was ≥50 % of the gene length, the FPKM value was assigned to the gene as the“expression intensity”.
Generation of non-TE genes
We mapped the plant repeat sequence library (PReDa [56]) and MULE TIR sequences to each of the 11 genomes with RepeatMasker. According to the coordinates of TEs and MULE TIRs and the coordinates of MAKER-annotated genes, we removed the genes which overlapped or were flanked (in 500-bp/1000-bp flanking region) by TE or MULE TIR sequences. We considered the remaining genes as non-TE genes.
Estimation of recombination rate
BLASTN E value ≤1e-10were selected and the midpoint of each cDNA was used as the physical distance of the mark. Marks that had multiple positions in the genome and/or anomalous positions after visual inspection of the Marey’s maps were removed. Based on both genetic and physical distances of these marks, Marey’s maps were built using the MareyMap program [67]. To compute the interpolation and generate a recombination rate map of the O. sativa ssp. japonica RefSeq, we used the LOESS function with a window span size of 20 %, a fitted curve degree of 2, and the cubic splines method with the cross-validation option (Additional file 1: Figure S8) [55]. Based on the recombination rate map, we estimated local recombination rates of the parental sequences of MULE-derived putative genes and non-TE genes using the MareyMap pro-gram [67]. Both the recombination rate and Marey’s maps are shown on Additional file 1: Figure S8.
Methylome data processing
The methylome BS-seq raw data ofO. sativa.ssp. japon-icaand O. nivaragenomes were processed according to Becker et al. [68]. For methylation analyses, we only con-sidered cytosine sites covered by at least three BS-seq reads. The methylation level of a region was estimated as the percentage of methylated cytosines over the total number of mapped cytosines in that region for the three cytosine contexts (CG, CHG, and CHH), respectively. Only regions where at least 50 % of the cytosines were mapped were considered. Thus, we estimated the methylation levels of the parental sequences of MULE-derived putative genes and the randomly selected sequences (with the same size as the mean size of the parental sequences) from non-TE genes in the three cytosine contexts and compared the methylation levels of the two groups of sequences with the Wilcoxon rank sum test. Further, we categorized and computed the methylation levels in internal, TIR, and 500-bp flanking regions of genic-MULEs with three evolutionary ages (Asian MULEs, AA MULEs, and AB genic-MULEs) and compared the methylation levels of the three groups of genic-MULEs with the Wilcoxon rank sum test. Methylation levels were also calculated and compared in the gene body and promoter regions of MULE-derived putative genes over three evolutionary ages. We also analyzed the methylation patterns with in-creased BS-seq read coverage, considering cytosine sites covered by at least five BS-seq reads and at least seven BS-seq reads, respectively. We found similar patterns as the ones considering cytosine sites covered by at least three BS-seq reads. Therefore, we only present the re-sults based on the analysis using at least three BS-seq reads as the threshold of read coverage.
Estimation of TE content of genic-MULE internal sequences To estimate the TE content of genic-MULE internal se-quences, we first removed MULE TIR sequences from PReDa [56]. The resultant repeat library was then mapped to MULE internal sequences using RepeatMasker. The length of masked MULE internal regions divided by the total length of MULE internal sequences was calculated as the TE content of MULEs. The TE contents of genic-MULEs with three evolutionary ages were computed and compared using the Wilcoxon rank sum test for the O. sativa.ssp.japonicaandO. nivaragenomes, respectively.
Calculation of TIR identity
Paired TIR regions of MULEs were extracted and aligned with MAFFT [69]. TIR similarity was computed as the total number of identical bases divided by the length of the left TIR.
Small RNA data processing
Small RNA sequences from 12 tissues or conditions of O. sativa ssp. japonica were mapped to the O. sativa ssp. japonica genome using BWA (bwa-12-17-2013-git) with perfect matches. The output from BWA (in SAM format) was parsed and the number of locations where each small RNA mapped to the genome was counted. We extracted small RNAs that mapped to only one loca-tion on the genome and considered these as unique tar-gets in the genome for our analyses [41, 42]. Only 24-nucleotide small RNAs were considered since they are known to be able to induce DNA methylation [37, 38]. If the coordinates of 24-nucleotide small RNA sites overlapped with the TIR/internal region coordinates of genic-MULEs, we assume that these small RNAs mapped to the TIR/internal regions of genic-MULEs. Based on the number of each 24-nucleotide small RNA, we estimated how many 24-nucleotide small RNAs were mapped to the TIR/internal region of the genic-MULEs. Thus, in 12 tissues/conditions, we esti-mated the mean number of 24-nucleotide small RNAs mapped to the TIR/internal regions of the genic-MULEs with three evolutionary ages and compared the three groups of values with a t-test.
Processing DGE data ofO. sativassp.japonica
Raw DGE reads from sevenO. sativassp.japonicatissues were mapped to theO. sativassp. japonicagenome using the TopHat v2.0.10 package. DGE abundance was then measured in exonic regions of MULE-derived putative genes (i.e., FPKM values) using Cufflinks (v2.1.1).
Open access
which permits unrestricted use, distribution, and reproduction in any medium, provided you give ap-propriate credit to the original author(s) and the source, provide a link to the Creative Commons license, and indi-cate if changes were made. The Creative Commons Public Domain Dedication waiver (http://creativecommons.org/ publicdomain/zero/1.0/) applies to the data made available in this article, unless otherwise stated.
Ethics approval
No ethical approval was required.
Availability of supporting data and materials
All the intermediate steps were carried out with custom PERL and R scripts. The source codes used are available at GitHub (https://github.com/FanLabWayneStateU/MULE-methylation). The detailed workflow of the analysis pro-cedure can be found in Additional file 3: Supplementary file S1.
All genome assembly, transcriptome, and methylome data are publically available from the National Center for Biotechnology Information (NCBI) and/or iPlant Collab-orative (http://www.iplantcollabCollab-orative.org/). Accession numbers and URLs can be found in Additional file 4: Supplementary file S2.
Additional files
Additional file 1: Figures S1.a) shows the phylogenetic tree of 10 Oryzaand 1Leersiaspecies. Based on the presence and absence of MULEs on the phylogenetic tree, we inferred the origination time points of the MULEs measured with divergence time of the 11 species. We listed the origination time index on the phylogenetic tree as 1-9, e.g.“1” represents MULEs originated after each species diverged,“4”represents MULEs originated before Asian rice diverged but after Asian rice split from the rest ofOryzaspecies, 9 represents MULEs originated before the AA and BB genome rice diverged. Then for each of the 9Oryza2 species, we grouped their MULEs based on its origination time index. b) We categorized MULEs based on their origination time points (shown in‘a’) inferred from presence and absence of MULEs in the phylogenetic tree ofOryzaspecies, and drew the density distribution of the amplification time of MULEs, which were estimated based on the sequence divergence of MULEs and their most similar paralogs, in each origination time point category for 9 species, respectively.Figure S2.Methylation level distribution of parental sequences of MULE-derived genes and randomly selected non-TE genic-regions in across theO. nivaragenome.
Figure S3.Methylation level of MULE-derived putative genes a) inO. sativa ssp.japonicagenome; b) the genes derived from MULEs overlapped between Ferguson et al. and us.; c) inO. nivaragenome.Figure S4.
Analysis of methylation levels of genic-MULEs with the overlapped data set of Ferguson et al. and us. a) Methylation level of MULE internal sequences; b) Methylation level of entire MULEs and flanking regions.
Figure S5.Analysis of TE-coverage and TIR similarity of genic-MULEs with the overlapped data set of Ferguson et al and us.Figure S6.
Analysis of methylation levels of genic-MULEs inO. nivaragenome. a) Methylation level of MULE internal sequences; b) Methylation level of entire MULEs and flanking regions.Figure S7.Analysis of TE-coverage of genic-MULEs inO. nivaragenome.Figure S8.The Marey’s and recombination rate map ofO. sativassp.japonicagenome. The Blue line is based on LOESS function and the red line is based on cubic splines. (DOCX 3.19 mb)
Additional file 2: Table S1.Estimation of the origination rate of MULE-derived candidate genes. (DOCX 14 kb)
Additional file 3:Supplementary file S1. Detailed workflow for Wang et al. DNA methylation changes facilitated evolution of genes derived from Mutator-like transposable elements. (DOCX 156 kb)
Additional file 4:Supplementary file S2. Accession numbers and URLs for genome assembly, transcriptome and methylome data that used in this project. (DOCX 101 kb)
Abbreviations
AGI:Arizona Genomics Institute; BCP: bicellular pollen; CDS: coding sequence; DGE: digital gene expression; FPKM: fragments per kilobase of transcript per million reads; MULE:Mutator-like element; ORF: open reading frame; PReDa: plant TE and repeated sequences; TCP: tricellular pollen; TE: transposable element; TIR: terminated inverted repeat; TSD: target site duplication; UNM: uninucleate microspore.
Competing interests
The authors declare that they have no competing interests.
Authors’contributions
CF and RAW conceived the project. CF and JW designed the experiments. YY, JZ, DC, DK, JT, and SL generated the genome assembly and RNA-seq of OryzaandLeersiaspecies. JW and FT analyzed the data. JW, CF, and RAW wrote the manuscript with input from all the authors. All authors read and approved the final manuscript.
Acknowledgements
We greatly appreciate Dr. Ning Jiang from Michigan State University, Dr. Blake Meyers from University of Delaware, Dr. Manyuan Long from University of Chicago, and two anonymous reviewers for critical reading and constructive inputs for our manuscript. We thank all members of the International Oryza Map Alignment Project (IOMAP) Consortia for their contributions, in particular its senior leadership (Drs. Mingsheng Chen, Bin Han, Robert Henry, Yue-ie Hsing, Nori Kurata, Antonio Costa de Oliveira, and Olivier Panaud). We are grateful to Claude Becker and Detlef Weigel from Max Planck Institute for Developmental Biology for providing methylome data forO. sativassp.japonicaandO. nivara genomes. Computing & Information Technology of Wayne State University provided grid computing services.
Funding
The project was funded by a start-up fund from Wayne State University to CF; RAW was supported by the National Science Foundation Plant Genome Program (grant number 1026200), the Bud Antle Endowed Chair of Excellence in Agriculture, and the AXA Chair for Evolutionary Genomic and Genome Biology.
Author details 1
Department of Biological Sciences, Wayne State University, 5047 Gullen Mall, Detroit, MI 48202, USA.2Arizona Genomics Institute, BIO5 Institute and School of Plant Sciences, University of Arizona, Tucson, AZ 85721, USA.3T.T. Chang Genetics Resources Center, International Rice Research Institute, Los Baños, Laguna 4031, Philippines.
Received: 1 October 2015 Accepted: 14 April 2016
References
1. Robertson DS. Characterization of a Mutator system in maize. Mutat Res. 1978;51:21–8.
2. Bennetzen JL, Swanson J, Taylor WC, Freeling M. DNA insertion in the first intron of maize Adh1 affects message levels: cloning of progenitor and mutant Adh1 alleles. Proc Natl Acad Sci U S A. 1984;81:4125–8. 3. Eisen JA, Benito MI, Walbot V. Sequence similarity of putative transposases
links the maize mutator autonomous element and a group of bacterial insertion sequences. Nucleic Acids Res. 1994;22:2634–6.
5. Yu ZH, Wright SI, Bureau TE. Mutator-like elements in Arabidopsis thaliana: structure, diversity and evolution. Genetics. 2000;156:2019–31.
6. Pritham EJ, Feschotte C, Wessler SR. Unexpected diversity and differential success of DNA transposons in four species of entamoeba protozoans. Mol Biol Evol. 2005;22:1751–63.
7. Ferguson AA, Zhao D, Jiang N. Selective acquisition and retention of genomic sequences by Pack-Mutator-like elements based on guanine-cytosine content and the breadth of expression. Plant Physiol. 2013;163:1419–32.
8. Jiang N, Ferguson AA, Slotkin RK, Lisch D. Pack-Mutator-like transposable elements (Pack-MULEs) induce directional modification of genes through biased insertion and DNA acquisition. Proc Natl Acad Sci U S A. 2011;108:1537–42. 9. Jiang N, Bao Z, Zhang X, Eddy SR, Wessler SR. Pack-MULE transposable elements mediate gene evolution in plants. Nature. 2004;431:569–73. 10. Wicker T, Sabot F, Hua-Van A, Bennetzen JL, Capy P, Chalhoub B, et al.
A unified classification system for eukaryotic transposable elements. Nat Rev Genet. 2007;8:973–82.
11. Lisch D. Mutator transposons. Trends Plant Sci. 2002;7:498–504. 12. Lisch D, Girard L, Donlin M, Freeling M. Functional analysis of deletion
derivatives of the maize transposon MuDR delineates roles for the MURA and MURB proteins. Genetics. 1999;151:331–41.
13. Hanada K, Vallejo V, Nobuta K, Slotkin RK, Lisch D, Meyers BC, et al. The functional role of pack-MULEs in rice inferred from purifying selection and expression profile. Plant Cell. 2009;21:25–38.
14. Jiao Y, Deng XW. A genome-wide transcriptional activity survey of rice transposable element-related genes. Genome Biol. 2007;8:R28.
15. Wang W, Zheng H, Fan C, Li J, Shi J, Cai Z, et al. High rate of chimeric gene origination by retroposition in plant genomes. Plant Cell. 2006;18:1791–802. 16. Rizzon C, Ponger L, Gaut BS. Striking similarities in the genomic distribution
of tandemly arrayed genes in Arabidopsis and rice. PLoS Comput Biol. 2006;2:e115.
17. Ohno S. Evolution by gene duplication. New York: Springer; 1971. 18. Kaessmann H, Vinckenbosch N, Long M. RNA-based gene duplication:
mechanistic and evolutionary insights. Nat Rev Genet. 2009;10:19–31. 19. Wang J, Marowsky NC, Fan C. Divergent evolutionary and expression
patterns between lineage specific new duplicate genes and their parental paralogs in Arabidopsis thaliana. PLoS One. 2013;8:e72362.
20. Adams KL, Wendel JF. Polyploidy and genome evolution in plants. Curr Opin Plant Biol. 2005;8:135–41.
21. Chen SD, Krinsky BH, Long MY. New genes as drivers of phenotypic evolution. Nat Rev Genet. 2013;14:645–60.
22. Cardoso-Moreira M, Long M. The origin and evolution of new genes. Methods Mol Biol. 2012;856:161–86.
23. Talbert LE, Chandler VL. Characterization of a highly conserved sequence related to mutator transposable elements in maize. Mol Biol Evol. 1988;5:519–29.
24. Ohtsu K, Hirano HY, Tsutsumi N, Hirai A, Nakazono M. Anaconda, a new class of transposon belonging to the Mu superfamily, has diversified by acquiring host genes during rice evolution. Mol Genet Genomics. 2005;274:606–15.
25. Bennetzen JL, Springer PS. The generation of Mutator transposable element subfamilies in maize. Theor Appl Genet. 1994;87:657–67.
26. Yamashita S, Takano-Shimizu T, Kitamura K, Mikami T, Kishima Y. Resistance to gap repair of the transposon Tam3 in Antirrhinum majus: a role of the end regions. Genetics. 1999;153:1899–908.
27. Assis R, Bachtrog D. Neofunctionalization of young duplicate genes in Drosophila. Proc Natl Acad Sci U S A. 2013;110:17409–14.
28. Yang LX, Bennetzen JL. Distribution, diversity, evolution, and survival of Helitrons in the maize genome. Proc Natl Acad Sci U S A. 2009;106:19922–7. 29. Holligan D, Zhang XY, Jiang N, Pritham EJ, Wessler SR. The transposable
element landscape of the model legume Lotus japonicus. Genetics. 2006;174:2215–28.
30. Bennetzen JL, Hake S. SpringerLink (Online service). Handbook of maize genetics and genomics. New York, NY: Springer New York; 2009. 31. Zhang C, Wang J, Long M, Fan C. gKaKs: the pipeline for genome-level
Ka/Ks calculation. Bioinformatics. 2013;29:645–6.
32. Yang Z. PAML 4: phylogenetic analysis by maximum likelihood. Mol Biol Evol. 2007;24:1586–91.
33. Berchowitz LE, Hanlon SE, Lieb JD, Copenhaver GP. A positive but complex association between meiotic double-strand break hotspots and open chromatin in Saccharomyces cerevisiae. Genome Res. 2009;19: 2245–57.
34. Robertson KD. DNA methylation and chromatin–unraveling the tangled web. Oncogene. 2002;21:5361–79.
35. Slotkin RK, Martienssen R. Transposable elements and the epigenetic regulation of the genome. Nat Rev Genet. 2007;8:272–85. 36. Li X, Zhu J, Hu F, Ge S, Ye M, Xiang H, et al. Single-base resolution
maps of cultivated and wild rice methylomes and regulatory roles of DNA methylation in plant gene expression. BMC Genomics. 2012;13:300. 37. Molnar A, Melnyk CW, Bassett A, Hardcastle TJ, Dunn R, Baulcombe DC.
Small silencing RNAs in plants are mobile and direct epigenetic modification in recipient cells. Science. 2010;328:872–5.
38. Law JA, Jacobsen SE. Establishing, maintaining and modifying DNA methylation patterns in plants and animals. Nat Rev Genet. 2010;11:204–20. 39. Slotkin RK, Freeling M, Lisch D. Mu killer causes the heritable inactivation
of the Mutator family of transposable elements in Zea mays. Genetics. 2003;165:781–97.
40. Slotkin RK, Freeling M, Lisch D. Heritable transposon silencing initiated by a naturally occurring transposon inverted duplication. Nat Genet. 2005;37:641–4.
41. Lister R, O’Malley RC, Tonti-Filippini J, Gregory BD, Berry CC, Millar AH, et al. Highly integrated single-base resolution maps of the epigenome in Arabidopsis. Cell. 2008;133:523–36.
42. Groth M, Stroud H, Feng S, Greenberg MV, Vashisht AA, Wohlschlegel JA, et al. SNF2 chromatin remodeler-family proteins FRG1 and -2 are required for RNA-directed DNA methylation. Proc Natl Acad Sci U S A.
2014;111:17666–71.
43. Wu DD, Wang X, Li Y, Zeng L, Irwin DM, Zhang YP.“Out of pollen” hypothesis for origin of new genes in flowering plants: study from Arabidopsis thaliana. Genome Biol Evol. 2014;6:2822–9.
44. Cui X, Lv Y, Chen M, Nikoloski Z, Twell D, Zhang D. Young genes out of the male: an insight from evolutionary age analysis of the pollen transcriptome. Mol Plant. 2015;8:935–45.
45. Calarco JP, Borges F, Donoghue MTA, Van Ex F, Jullien PE, Lopes T, et al. Reprogramming of DNA methylation in pollen guides epigenetic inheritance via small RNA. Cell. 2012;151:194–205.
46. Ge S, Sang T, Lu BR, Hong DY. Phylogeny of rice genomes with emphasis on origins of allotetraploid species. Proc Natl Acad Sci U S A. 1999;96:14400–5. 47. Piegu B, Guyot R, Picault N, Roulin A, Sanyal A, Kim H, et al. Doubling
genome size without polyploidization: dynamics of retrotransposition-driven genomic expansions in Oryza australiensis, a wild relative of rice.
Genome Res. 2006;16:1262–9.
48. Zuccolo A, Sebastian A, Talag J, Yu Y, Kim H, Collura K, et al. Transposable element distribution, abundance and role in genome size variation in the genus Oryza. BMC Evol Biol. 2007;7:152.
49. Piskurek O, Jackson DJ. Transposable elements: from DNA parasites to architects of metazoan evolution. Genes (Basel). 2012;3:409–22.
50. Zhang C, Wang J, Marowsky NC, Long M, Wing RA, Fan C. High occurrence of functional new chimeric genes in survey of rice chromosome 3 short arm genome sequences. Genome Biol Evol. 2013;5:1038–48.
51. Zilberman D, Gehring M, Tran RK, Ballinger T, Henikoff S. Genome-wide analysis of Arabidopsis thaliana DNA methylation uncovers an
interdependence between methylation and transcription. Nat Genet. 2007; 39:61–9.
52. Shukla S, Kavak E, Gregory M, Imashimizu M, Shutinoski B, Kashlev M, et al. CTCF-promoted RNA polymerase II pausing links DNA methylation to splicing. Nature. 2011;479:74–9.
53. Maunakea AK, Nagarajan RP, Bilenky M, Ballinger TJ, D’Souza C, Fouse SD, et al. Conserved role of intragenic DNA methylation in regulating alternative promoters. Nature. 2010;466:253–7.
54. Soumillon M, Necsulea A, Weier M, Brawand D, Zhang XL, Gu HC, et al. Cellular source and mechanisms of high transcriptome complexity in the mammalian testis. Cell Rep. 2013;3:2179–90.
55. Muyle A, Serres-Giardi L, Ressayre A, Escobar J, Glemin S. GC-biased gene conversion and selection affect GC content in the Oryza genus (rice). Mol Biol Evol. 2011;28:2695–706.
56. Copetti D, Zhang J, El Baidouri M, Gao D, Wang J, Barghini E, et al. RiTE database: a resource database for genus-wide rice genomics and evolutionary biology. BMC Genomics. 2015;16:538.
58. Wei LQ, Yan LF, Wang T. Deep sequencing on genome-wide scale reveals the unique composition and expression patterns of microRNAs in developing pollen of Oryza sativa. Genome Biol. 2011;12:R53. 59. Jeong DH, Park S, Zhai JX, Gurazada SGR, De Paoli E, Meyers BC, et al.
Massive analysis of rice small RNAs: mechanistic implications of regulated MicroRNAs and variants for differential target RNA cleavage. Plant Cell. 2011;23:4185–207.
60. Stroud H, Ding B, Simon SA, Feng SH, Bellizzi M, Pellegrini M, et al. Plants regenerated from tissue culture contain stable epigenome changes in rice. Elife. 2013;2:e00354.
61. Wu L, Zhou H, Zhang Q, Zhang J, Ni F, Liu C, et al. DNA methylation mediated by a microRNA pathway. Mol Cell. 2010;38:465–75.
62. Price AL, Jones NC, Pevzner PA. De novo identification of repeat families in large genomes. Bioinformatics. 2005;21 Suppl 1:i351–8.
63. Kent WJ. BLAT–the BLAST-like alignment tool. Genome Res. 2002;12:656–64. 64. Storey JD, Taylor JE, Siegmund D. Strong control, conservative point
estimation and simultaneous conservative consistency of false discovery rates: a unified approach. J R Stat Soc B Stat Method. 2004;66:187–205. 65. Storey JD. A direct approach to false discovery rates. J R Stat Soc B Stat
Methodol. 2002;64:479–98.
66. Harushima Y, Yano M, Shomura A, Sato M, Shimano T, Kuboki Y, et al. A high-density rice genetic linkage map with 2275 markers using a single F2 population. Genetics. 1998;148:479–94.
67. Rezvoy C, Charif D, Gueguen L, Marais GAB. MareyMap: an R-based tool with graphical interface for estimating recombination rates. Bioinformatics. 2007;23:2188–9.
68. Becker C, Hagmann J, Muller J, Koenig D, Stegle O, Borgwardt K, Weigel D. Spontaneous epigenetic variation in the Arabidopsis thaliana methylome. Nature. 2011;480:245–9.
69. Katoh K, Standley DM. MAFFT multiple sequence alignment software version 7: improvements in performance and usability. Mol Biol Evol. 2013;30:772–80.
• We accept pre-submission inquiries
• Our selector tool helps you to find the most relevant journal • We provide round the clock customer support
• Convenient online submission • Thorough peer review
• Inclusion in PubMed and all major indexing services • Maximum visibility for your research
Submit your manuscript at www.biomedcentral.com/submit