© 2015, IRJET.NET- All Rights Reserved Page 1148
WIRELESS SENSOR BASED SMART GRID MANAGEMENT USING PHOTOVOLTAIC
SYSTEM
Suman Patel U P, DEC M.tech, MSRIT,
Dr.K.Nataragan, Head of the Department, Telecommunication, MSRIT
---***---Abstract -
Wireless Sensor Networks (WSN) are getting more integrated to our daily lives and smart surroundings as they are being used for health, comfort and safety applications. Smart grid integrates the latest advances in information and communication technologies to contribute to a more reliable and efficient electricity system. Distributed renewable power generators, such as solar cells and wind turbines are difficult to predict, making the demand-supply problem more complex than in the traditional energy production scenario. They also introduce bidirectional energy flows in the low-voltage power grid, possibly causing voltage violations and grid instabilities. In order to enable the demand responsive program which is in the extension of the smart grid, a smart and wireless energy management application plays a key important role. Therefore, in this paper, first the smart demand responsive energy management system under new comprehensive field tests for wireless communication using mesh network based on AODV is proposed. A case study of smart grid-connected buildings that has solar photo-voltaic (PV) panels for distributed electricity generation and batteries for local energy storage is considered. The hardware design and implementation of a multiple nodes mesh network based wireless sensor network is designed which wirelessly connects appliances to the user through the wireless sensor networks. Current sensors used to sense produced current by PV and to sense current consumed by all appliances at every moment and forward this data to control unit instantaneously. In the control unit, a program is developed to receive the data and store in to a database for further processing of energy management by the control unit. Priority is assigned based on battery charge and loads consuming power. The scheme can response to the resident’s command with the economically suggestion and help them shift their non-urgent appliances to the off-peak hours. Therefore, the high peak load is all aviated, the green-house gas emission is reduced, furthermore, through the two-way communication, the utility is able to decide the optimal generation plan to satisfy resident demands, and the total utility cost can be reduced.Key Words: IoT, wireless sensor network, smart grid. etc…
1. INTRODUCTION
Current energy distribution grid has been in use for almost a century. The aging of equipment’s and increasing
consumer demands necessitate a revolution in the grid. By 2020,
it is foreseen that the energy demand will almost be double the
present demand. Increases in recent times in electricity costs and in associated emissions of greenhouse gases are having an
impact on societies to adopt business and lifestyle strategies
based on sustainability practices. The existing electricity grid has
remained unchanged for about 100 years. It lacks the capability of providing information and communication. To realize these
capabilities, a new concept has emerged the smart grid.
Wireless Sensor Networks (WSNs) are becoming a
fundamental tool of the smart grid. Advanced information and communication technologies, monitoring and control and
innovative metering technologies via intelligent devices, will
become increasingly important. The benefits of the smart grid
are not limited to the power distributors but reach both industrial and residential customers as well. By deploying the
proper control mechanisms, the power distributor can save
money by avoided investments for additional capacity. The
industrial and residential customers benefit from green, locally produced power and lower energy bills by automated shifting of
flexible loads towards cheaper time windows. To enjoy these
benefits, an integrated network for controlling (distributed)
energy sources is required.
The initial concept of SG started with the idea of advanced
metering infrastructure (AMI) with the aim of improving
demand-side management and energy efficiency, and
constructing self-healing reliable grid protection against malicious sabotage and natural disasters [204]. However, new
requirements and demands drove the electricity industries,
© 2015, IRJET.NET- All Rights Reserved Page 1149 electricity generation, advanced delivery, advanced information
metering, advanced monitoring, advanced management and advanced communication technologies. The smart management
system is the subsystem in SG that provides advanced
management and control services. The smart protection system
is the subsystem in SG that provides advanced grid reliability
analysis, failure protection, and security and privacy protection services.. Hence, in this paper, first the smart demand responsive
energy management system under new comprehensive field
tests with mesh network design based on AODV for wireless communication is proposed. We present a real-time distributed
multi-agent algorithm for coordinating supply and demand in the
residential power network in an optimal way. An important goal
of the algorithm is to improve the local consumption of the
energy produced by solar panels.
2. PROBLEM DEFINITION
Renewable energy source costs more but it is one time investment. Solar energy is one of the abundant renewable
energy sources. Deploying a solar grid for energy generation and
the energy generated from grid is used to charge a battery. From battery we can use the energy during night time where there is
no power generation in the grid. For proper management of
energy wireless sensor network is designed which can monitor
and measure power consumed by all the loads connected. The
measured data is transmitted wirelessly to base station from router. The battery charge is also monitored, measured and
transmitted wirelessly for proper utilization of it during night
time. As if the data are received wirelessly there is no need of metering, user can come to know how much power each
component is consuming and try to reduce the utilization of
loads consuming more power. Based on the received data the
remote switching of the loads can be done. Priorities are given based on the battery charge and electricity generation. For
example during night light is necessary compare to motor and
other loads hence priority is given to light at night. During day
time motor is necessary compare to light hence priority is given to motor. By assigning priority we can utilize energy more
efficiently based on necessity. Here we are using a mesh network
technology designed based on AODV.
3. LITERATURE REVIEW
Indian power sector has a total capacity of
approximately 1,46,753 MW power generation. In which 54% is
coal based, 25% hydro based, 8% is renewable energy based and
remaining is gas and nuclear based. Power shortages are estimated at about 11% of total energy and 15% of peak capacity
requirements which is likely to increase in the coming years. The
cost is Rs 15 to Rs 20 per unit for the solar energy, which is very
high when compared to Rs 2 to Rs 5 per unit for other conventional sources in India. Solar energy technology consists
of solar thermal technologies, which utilizes suns energy and
photovoltaic technology, which converts sun energy directly in to
electricity. According to the 11th five year plan, the government
of India projects a massive expansion in solar capacity, and aims
to reduce price of electricity generated from solar energy, to
match the fossil fuels like coal and diesel by 2030.
The smart grid (SG) is now becoming reality and the installation of smart meters, currently in progress in many
countries, is the first step. By using smart meters, the
consumption and generation profiles will be available for both consumers and grid operators. The emergence of the smart grid
facilitates both suppliers and consumers of electricity in reducing
carbon footprint and improving the reliability and efficiency of
electricity generation, distribution and utilization.
The efficiency of a photovoltaic (PV) panel is seriously
affected by sunlight irradiance blocking obstacles, dirt
accumulated in the solar panel protection glass as well as
field-aged degradation. Aging effects of PV cells affects the I-V characteristics, so an in-situ measurement system of PV
performance characteristic parameters can provide valuable
information for optimized power generation. What is known
from field studies is that the most degraded modules have no
correlation between visual defects and performance.
The PV panels are normally tested in the production
factory once and in standard conditions, with the cost of
dismounting from an installation fixture and testing them to be always prohibitive. Consequently, each solar panel is usually left
unattended during its production life, thus resulting to
sub-optimal electric power generation with considerable cost. On the
© 2015, IRJET.NET- All Rights Reserved Page 1150 with ongoing advances in microcontrollers and CMOS
RF-transceivers are the enabling technologies for the use of low cost wireless sensor networks for monitoring and characterization of
the PV panels in the field. The need for a continuous preventive
maintenance procedure for PV generators based on a distributed
monitoring and testing device is obvious
We investigate optimal energy management for the SG,
taking into consideration unpredictable load demands and
distributed energy resources [1]. Both delay intolerant (DI) and
delay tolerant (DT) load demands are studied. They aim to
optimally schedule the usage of all the energy resources in the system and minimize the long-term time averaged expected total
cost of supporting all users’ load demands. They first formulate
an optimization problem, which turns out to be a time-coupling problem and prohibitively expensive to solve. Then, we
reformulate the problem using Lyapunov optimization theory
and develop a dynamic energy management scheme that can
dynamically solve the problem in each time slot based on the
current system state only.
A new quality optimized sky camera multimedia
information gathering scheme, in energy harvesting wireless
sensor network based internet of things system is proposed[2].The transmitted power control and relay node
selection strategies were jointly optimized based on multimedia
packet distortion reduction and energy harvesting profile of each
node is done. A predictive control system based on a DP approach, that optimizes the power flow management into a grid
connected PV system with storage, has been presented [3].
A dynamic power management system is proposed
with minimum cost and is compared with the rural based management. In simulation over 24 hours, predictive
optimization provides around 13% of gain on the electricity bill
for the economical context from rural management. Depending
on the reactive management in real conditions, the power fluctuation of the PV production is balanced to the power
exchanged with the grid or with the batteries.
The Ad hoc On Demand Distance Vector (AODV) routing
algorithm is a routing protocol designed for ad hoc mobile networks. AODV is capable of both unicasts and multicast
routing. It is an on demand algorithm, meaning that it builds
routes between nodes only as desired by source nodes. It
maintains these routes as long as they are needed by the sources. Additionally, AODV forms trees which connect multicast group
members. The trees are composed of the group members and the
nodes needed to connect the members. AODV uses sequence
numbers to ensure the freshness of routes. It is loop-free,
self-starting, and scales to large numbers of mobile nodes.
In 30% of the villages in India still there are power cuts
and no proper electricity facility. With the efficient utilization of
the energy advanced delivery, advanced information metering,
advanced monitoring, advanced management, advanced communication technologies and use of renewable resources for
power generation we can reduce the power requirements.
Storing energy for future needs and proper utilization of it is necessary because with storage devices we can store a little
amount of energy but the requirement will be more and it has to
come for long time. For efficient utilization we require a
advanced stabilized system which is smart, low cost, energy
efficient, accurate and user friendly.
For optimum utilization of power some data need to be
analyzed. Collecting data for analysis from different points and
delivering is one of the biggest challenges. The wireless communication technology is key for all the remote monitoring
applications. The development of wireless sensor network for
integrated communication, sensing and measurement; smart
metering and advanced control are some features which are generally developed on smart grid. For proper utilization of
power many wireless communication technologies are used for
remote monitoring and advanced metering. Renewable energy
sources with multiple storage capability are developed. The developed technologies are compared with the present electrical
grid technology and percentage of optimizing power utilization is
analyzed.
4. PROPOSED WORK
Renewable energy source costs more but it is one time
investment. Solar energy is one of the abundant renewable energy sources. Deploying a solar grid for energy generation and
the energy generated from grid is used to charge a battery. From
battery we can use the energy during night time where there is
© 2015, IRJET.NET- All Rights Reserved Page 1151 energy wireless sensor network is designed which can monitor
and measure power consumed by all the loads connected. The measured data is transmitted wirelessly to base station from
router. The battery charge is also monitored, measured and
transmitted wirelessly for proper utilization of it during night
time. As if the data are received wirelessly there is no need of
metering, user can come to know how much power each component is consuming and try to reduce the utilization of
loads consuming more power. Based on the received data the
remote switching of the loads can be done. Priorities are given based on the battery charge and electricity generation. For
example during night light is necessary compare to motor and
other loads hence priority is given to light at night. During day
time motor is necessary compare to light hence priority is given to motor. By assigning priority we can utilize energy more
efficiently based on necessity. Here we are using a mesh network
technology designed based on AODV.
The architecture then to be implemented in the sensor nodes will construct a wireless networking data collection at
crop field likely to replace the conventional manually data
collection system. A general “LITE” mote shown in fig 3 with
microcontroller for local processing and mote has a radio module that provides wireless connectivity also has external
terminals to connect various sensors like soil moisture,
thermistor and pressure sensors all to be integrated in all nodes.
All the deployed nodes will collect the parameters and report to the central coordinator /sink shown in fig 2. The coordinator will
coordinate the data collection. The individual nodes based on the
soil moisture sensor content attached to it will excite the water sprinklers in that particular region. There by we can conserve
[image:4.595.318.550.76.450.2]water using this project.
Figure 1: WSN architecture of LITE nodes
Fig 2: Gateway node
Fig 3: LITE node
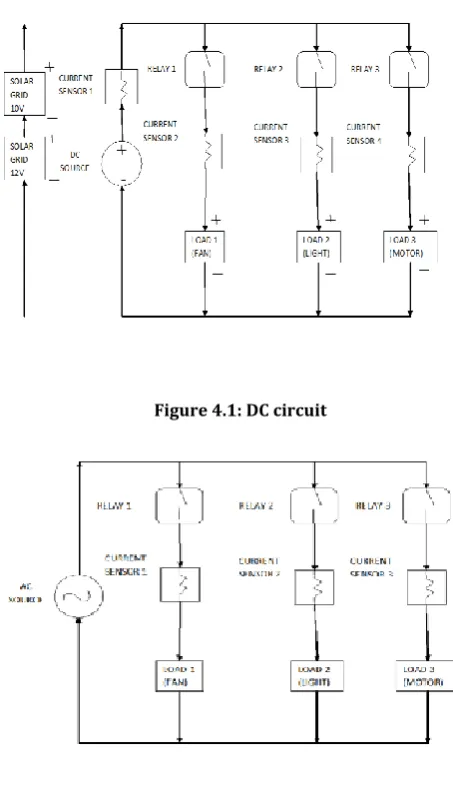
4.1.DC Circuit design and working:
The solar grid of 10v and 12v are used in the circuit and
are placed in series. A DC battery is used to store power which is
directly charged by solar grid. In DC circuit connect the
components to the supply and measure how much power each component is consuming. Place the relay in between for remote
switching of the components. Fig shows the entire setup of the dc
[image:4.595.58.298.611.727.2]© 2015, IRJET.NET- All Rights Reserved Page 1152 Figure 4.1: DC circuit
Figure 4.2: AC circuit
In dc circuit we are placing one Lite mote to control relays and interface sensors. All the current sensors are
interfaced to mote through I2C serial bus for serial
communication to read sensor data. Using current sensor,
current consumed by each components in the circuit can be obtained and also it is used to read voltage across circuit. The
relay1, realy2 and relay3 are connected to p1-4, p1-5 and p1-6
pins of the mote respectively. The pins are configured to switch
relays remotely and to optimize power utilization.
Current sensor 1 is used to measure the battery power
in the circuit and the other are used to measure the current
consuming by components connected to grid. LDR sensor is used
to detect the solar radiation i.e. day or night so based on LDR
output priority is assigned. During day time power generation
will be more so components which consume more power can be used. During night time only components (light) which are
necessary and required can be used.
In the above circuit current sensor 1 will measure
battery charge and based on the LDR output weather it is night or day switching is done. For example if it is day time and battery
charge is more components which consumes more power like
motor and fan can be used. The light which is not necessary
during day time will be switched off. So router (lite mote) is
programmed such that relay1 and relay3 are short circuited and relay2 is open circuited.
When it is night time the components which are
necessary and required like light is switched on. Components which consume more power are switched off. And based on
battery storage and necessity fan can be switch on or off
remotely. So router is programmed such that relay2 is short
circuited and relay3 is open circuited. Based on requirement
relay1 can be short circuited or open circuited remotely.
4.2.
AC Circuit design and working:
Ac circuit consists of three relays and three sensors to
switch and read the current consumption by components connected to ac supply. One more lite mote is placed here to
control relays and to read data from current sensor. The mote
after breading sensor data it will transmit data wirelessly to base
station. Hence there is no need of the metering, customer can see and analyze how much power each component in home is
consuming. Customer can reduce making use of components
which consumes more power.
The relay1, relay2 and relay3 in the circuit are connected to p1-4, p1-6 and p1-7 of the mote respectively. The mote is
programmed for remote switching of the three relays. Current
sensor1, Current sensor2 and Current sensor3 are connected
p2-4, p2-6 and p2-7 pins of the mote respectively. Mote is programmed to read the output voltage across the output of
current sensor, which can be calibrated if required.
© 2015, IRJET.NET- All Rights Reserved Page 1153 turned on only while transmitting sensor data and all other time
it will be in sleep mode. Mote 1 will transmit data to mote2 which will transmit it to base station. Whereas mote1 will be awake
more of the time as if it has to receive and transmit data from
mote2 and it has to transmit data from sensors connected to it.
Hence the multihoping is done. With multihoping we can collect
data wirelessly at any distance from the base station.
5.
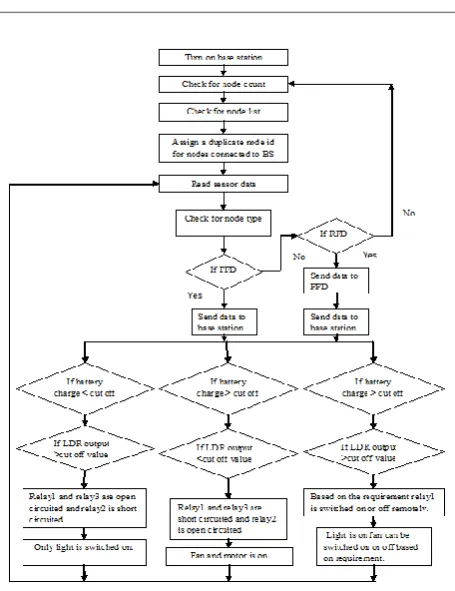
Flow chart
Turn on base station by and connect base station to pc through
USB cable. After turning on burn the code to mote then check for the node count. After checking node count will come to know
how many nodes are in the range of network. Check for the node
list it will display the entire node which is in the range of
network with their unique IP addresses. A link will be established between base station and the nodes. Based on the
link the base station will assign duplicate short IP address to all
nodes in the network.
The sensor output data is collected by all the nodes to which they are connected. After reading data necessary conversion is
carried out at the node which is required for data transmission.
The nodes are designed for two types one is reduced function
(RFD) devices and full function devices (FFD). The node which is designed as reduced function device will awake only for small
period i.e. during data transmission at all other time node will be
in sleep mode. The RFD will transmit data to FFD and from FFD it is transmitted to base station. Hence the FFD will be awake most
of the time to sense the network for collecting data from its
neighbor RFD’s. FFD also needs to transmit data received and
data from sensors connected to FFD wirelessly to base station
this is called multi-hoping.
Based on the data received at base station and based on some
conditions priorities are assigned to the components connected
to smart grit. The base station will check for received ldr output,
battery charge and power consumption by all components based on these a algorithm is created for optimum utilization power.
High power consuming components are detected and
[image:6.595.322.550.77.373.2]requirements are analyzed.
Figure 6: Flow Chart
Based on this the switching of components is done automatically
as well as remotely. One cut off battery charge is calculated based
on received data and ldr output is analyzed for one cut off. When
battery charge is less than cut off there may be deficiency of power in future. When charge is more then cut off then we can
manage power in feature. When ldr value is less than cut off i.e.
around 1v den it is day time if it is greater than cut off it is night
time. This is the analysis result.
When battery power is less than cut off and ldr output is
greater than cut off only light will be on. When battery power
greater than cut off and ldr is greater than cut off light will be on and fan can be switched remotely based on requirement. When
battery power is greater than cut off and ldr output is less than
cut off motor and fan will be on. By assigning this priority based
switching power can be utilized efficiently.
Loading sensor data to Xively:
The sensor is placed at each components connected to solar
grid. WSN motes are placed to read the data from sensors which
read the battery voltage, current consumption and voltage across each load connected to grid. The node will read data from
© 2015, IRJET.NET- All Rights Reserved Page 1154 transmit it to nearest node (FFD) if the node IS RFD or else
transmits directly to base station. The base station is connected to Linux laptop through a USB to serial converter. The sensor
data is being sent to the base station which forwards it over the
serial port connected to the Linux laptop. A simple Linux app is
reading the data from the serial port and posting to Xively using
a “C” library API provided by Xively.
6. RESULTS
The sensor readings are continually uploaded to Xively cloud
service and made available for access from any web browser
using internet. Xively’s API service is used to feed sensor data to
channels created on their cloud service. It is possible to view current sensor reading value both visually and numerically as
shown in fig 8,9 and 10. The web application provides a graphical
presentation of sensor readings over some period of time which
can range from current time up to three months of reading history.
Total project setup which consists of DC circuit and AC circuit are
shown below. In figure 7.1 no loads are turned on. In figure 7.2 all the loads are turned on and switching operation is done using
lite mote 1 and 2.
[image:7.595.308.558.100.237.2]Figure 7.1: Project setup
Figure 7.2: Project setup
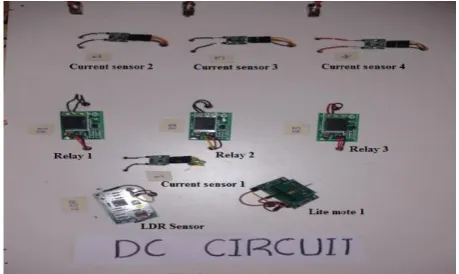
Figure 7.3 shows the DC circuit developed. The DC circuit
developed which consists of 4 current sensors, three relay, one
ldr and one lite mote. Current sensors to read current and
voltage across load relay for switching and mote for wireless transmission of data. Three loads are connected to current
sensor2, current sensor 3 and current sensor 4 which can be
switched remotely. Based on ldr and current sensor output light
[image:7.595.319.549.417.554.2]and motor are switched automatically using lite mote 1.
Figure 7.3: DC Circuit
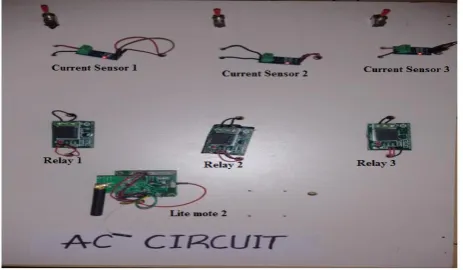
Figure 7.4 shows the AC circuit developed. The AC circuit
developed which consists of 3 current sensors, three relay
named, one ldr and one lite mote. Current sensors to read current and voltage across load relay for switching and mote for
wireless transmission of data. Three loads are connected to
current sensor1, current sensor2 and current sensor3 which can
[image:7.595.37.287.470.596.2]© 2015, IRJET.NET- All Rights Reserved Page 1155 Figure 7.4: AC Circuit
This figure is a terminal in Linux showing output after programming and connecting motes but without connecting any
load in the circuit. Node voltage, current consumption by all
loads, battery voltage, total current consuming in the circuit is all
[image:8.595.44.276.100.235.2]shown in figure 7.5.
Figure 7.5: Output in Terminal with no components connected
This figure is a terminal in Linux showing output after
programming and connecting motes with all loads connected in the circuit. Node voltage, current consumption by all loads,
battery voltage, total current consuming in the circuit is all
shown in figure 7.6.
Figure 7.6: Output in Terminal with all components
connected
[image:8.595.35.300.369.568.2]The Data need to be loaded to xively after reading data from all the sensors and transmitting it to base station. In below
figure 7.7 it is loading data to xively.
The Total current data loaded to xively is represented
graphically as shown below in figure7.8. It is showing total current when no load is connected. It is the graphical
representation of total current monitored for 30 minutes.
[image:8.595.307.590.456.625.2]© 2015, IRJET.NET- All Rights Reserved Page 1156 Figure 7.8: Graphical representation of total current
consumption in xively
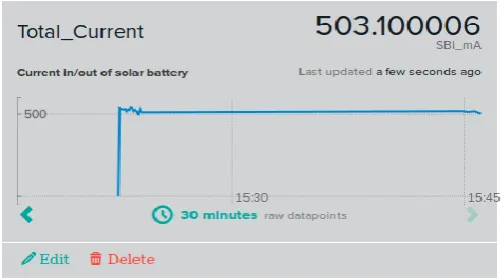
The Total current data loaded to xively is represented
graphically as shown below in figure 7.9. It is showing total
current when all the loads are connected. It is the graphical
representation of total current monitored for 30 minutes.
Figure 7.9: Graphical representation of total current
consumption in xively
The Battery voltage data loaded to xively is represented graphically as shown below in figure 7.10. It is the graphical
[image:9.595.311.560.139.274.2]representation of battery voltage monitored for 30 minutes.
Figure 7.10: Graphical representation of battery voltage in
[image:9.595.35.286.361.501.2]xively
Figure 7.11: Graphical representation of pump current
consumption in xively
The Pump current data loaded to xively is represented graphically as shown below in figure 7.11. It is the graphical
representation of pump current monitored for 30 minutes.
Figure 7.12: Graphical representation of fan current consumption in xively
The Fan current data loaded to xively is represented
graphically as shown below in figure 7.12. It is the graphical
representation of fan current monitored for 30 minutes.
The Light current data loaded to xively is represented
graphically as shown below in figure 7.13. It is the graphical
[image:9.595.308.557.399.526.2] [image:9.595.35.287.625.752.2]© 2015, IRJET.NET- All Rights Reserved Page 1157 Figure 7.13: Graphical representation of light current
consumption in xively
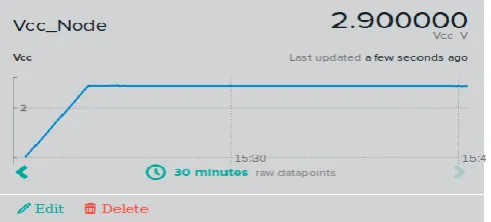
The Node voltage data loaded to xively is represented
graphically as shown below in figure 7.14. It is the graphical
representation of node voltage monitored for 30 minutes.
Figure 7.14: Graphical representation of node voltage in xively
7. CONCLUSION
The initial concept of smart grid (SG) started with the idea of
advanced metering infrastructure (AMI) with the aim of
improving demand-side management and energy efficiency, and
constructing self-healing reliable grid protection against malicious sabotage and natural disasters. There is a need of
advanced electricity generation, delivery, information metering,
monitoring, management and communication technologies.
These have been realized in this thesis.
A wireless sensor network has been designed successfully for
accessing sensor data at different ends. The current sensors are
connected to wireless motes through I2C serial interface. The
current sensor which is interfaced to WSN motes are able to read current consumption by all the components connected to smart
grid efficiently. For accessing data from longer distance multiple
nodes are used and this requires the process of multihoping. A
program is developed for network design, multihoping, collecting
current sensor data and transmitting it wirelessly to user end. From the above results of smart metering we can infer that, the
user can know how much power is consumed by all equipment’s.
Based on the data received and requirements an algorithm is
developed for optimum utilization of power. Relays are placed at
every end of loads for remote switching. The data received are loaded to data base at user end for analysis. Same database can
be accessed in internet through xively and are represented
graphically.
REFERENCES
[1] Salinas, Sergio, et al. "Dynamic energy management for the smart grid with distributed energy resources." Smart Grid, IEEE Transactions on 4.4 (2013): 2139-2151.
[2] Yao, Runan, et al. "Quality-driven energy-neutralized power and relay selection for smart grid wireless multimedia sensor based IoTs." Sensors Journal, IEEE13.10 (2013): 3637-3644.
[3] Riffonneau, Yann, et al. "Optimal power flow management
for grid connected PV systems with batteries."Sustainable
Energy, IEEE Transactions on2.3 (2011): 309-320.
[4] Erol-Kantarci, Melike, and Hussein T. Mouftah. "Wireless
sensor networks for cost-efficient residential energy
management in the smart grid."Smart Grid, IEEE
Transactions on2.2 (2011): 314-325.
[5] Khodayar, Mohammad E., MasoudBarati, and Mohammad Shahidehpour."Integration of high reliability distribution system in microgrid operation." Smart Grid, IEEE Transactions on 3.4 (2012): 1997-2006.
[6] Turck, De. "Distributed multi-agent algorithm for
residential energy management in smart grids."2012 IEEE
Network Operations and Management Symposium. 2012. [7] Mets, Kevin, et al. "Distributed multi-agent algorithm for
residential energy management in smart grids." Network Operations and Management Symposium (NOMS), 2012 IEEE.IEEE, 2012.
BIOGRAPHIES
Suman Patel U P,
DEC M.tech Student
MSRIT,
Email id: [email protected].
Dr.K.Nataragan,
Head of the Department,
[image:10.595.41.287.340.451.2]