cancer signature predicting therapy failure in
patients with multiple types of cancer
Gennadi V. Glinsky, … , Olga Berezovska, Anna B. Glinskii
J Clin Invest.
2005;115(6):1503-1521. https://doi.org/10.1172/JCI23412.
Activation in transformed cells of normal stem cells’ self-renewal pathways might contribute
to the survival life cycle of cancer stem cells and promote tumor progression. The
BMI-1
oncogene–driven gene expression pathway is essential for the self-renewal of
hematopoietic and neural stem cells. We applied a mouse/human comparative translational
genomics approach to identify an 11-gene signature that consistently displays a stem cell–
resembling expression profile in distant metastatic lesions as revealed by the analysis of
metastases and primary tumors from a transgenic mouse model of prostate cancer and
cancer patients. To further validate these results, we examined the prognostic power of the
11-gene signature in several independent therapy-outcome sets of clinical samples
obtained from 1,153 cancer patients diagnosed with 11 different types of cancer, including 5
epithelial malignancies (prostate, breast, lung, ovarian, and bladder cancers) and 5
nonepithelial malignancies (lymphoma, mesothelioma, medulloblastoma, glioma, and acute
myeloid leukemia). Kaplan-Meier analysis demonstrated that a stem cell–like expression
profile of the 11-gene signature in primary tumors is a consistent powerful predictor of a
short interval to disease recurrence, distant metastasis, and death after therapy in cancer
patients diagnosed with 11 distinct types of cancer. These data suggest the presence of a
conserved BMI-1–driven pathway, which is similarly engaged in both normal stem cells and
a highly malignant subset of human cancers diagnosed in a wide […]
Research Article
Oncology
Find the latest version:
Microarray analysis identifies a
death-from-cancer signature predicting therapy failure
in patients with multiple types of cancer
Gennadi V. Glinsky, Olga Berezovska, and Anna B. Glinskii
Sidney Kimmel Cancer Center, San Diego, California, USA.
Activation in transformed cells of normal stem cells’ self-renewal pathways might contribute to the survival
life cycle of cancer stem cells and promote tumor progression. The
BMI-1
oncogene–driven gene expression
pathway is essential for the self-renewal of hematopoietic and neural stem cells. We applied a mouse/human
comparative translational genomics approach to identify an 11-gene signature that consistently displays a stem
cell–resembling expression profile in distant metastatic lesions as revealed by the analysis of metastases and
primary tumors from a transgenic mouse model of prostate cancer and cancer patients. To further validate these
results, we examined the prognostic power of the 11-gene signature in several independent therapy-outcome
sets of clinical samples obtained from 1,153 cancer patients diagnosed with 11 different types of cancer,
includ-ing 5 epithelial malignancies (prostate, breast, lung, ovarian, and bladder cancers) and 5 nonepithelial
malig-nancies (lymphoma, mesothelioma, medulloblastoma, glioma, and acute myeloid leukemia). Kaplan-Meier
analysis demonstrated that a stem cell–like expression profile of the 11-gene signature in primary tumors is
a consistent powerful predictor of a short interval to disease recurrence, distant metastasis, and death after
therapy in cancer patients diagnosed with 11 distinct types of cancer. These data suggest the presence of a
con-served BMI-1–driven pathway, which is similarly engaged in both normal stem cells and a highly malignant
subset of human cancers diagnosed in a wide range of organs and uniformly exhibiting a marked propensity
toward metastatic dissemination as well as a high probability of unfavorable therapy outcome.
Introduction
Recent studies indicate that the Polycomb group (PcG) gene Bmi-1
determines the proliferative potential of normal and leukemic stem cells (1) and is required for the self-renewal of hematopoietic and neural stem cells (1–3). Self-renewal ability is an essential defining property of a pluripotent stem cell–like phenotype distinguishing stem cells from other cell types (4). An emerging concept of “tumor stem cells” argues that the presence of a rare stem cell–resembling population of cancer cells among the heterogeneous mix of cells constituting a tumor is essential for tumor progression and metas-tasis of epithelial malignancies (5–7). The concept of tumor stem cells implies that common genetic pathways might define critical stem cell–like functions in both normal and neoplastic stem cells (1, 5). Bmi-1 oncogene is expressed in all primary myeloid leukemia and leukemic cell lines analyzed so far (1, 8), and overexpression of Bmi-1 causes neoplastic transformation of lymphocytes (9, 10). Recently, BMI-1 expression was reported in human non-small-cell lung cancer (11) and breast cancer cell lines (12); this suggests an oncogenic role for BMI-1 activation in epithelial malignancies.
Expression profiling of prostate tumor samples using oligo-nucleotide or cDNA microarray technology rapidly emerged
as a powerful tool to reveal multiple gene expression signa-tures associated with human prostate cancer (13–27), includ-ing potential prostate cancer prognosis markers (14, 15, 18, 24–26). However, one of the major limitations of these studies was that the same clinical data set was used for both signature discovery and validation. Furthermore, microarray analysis typi-cally identifies vast data sets of candidate markers, and usually only a single hit or a few hits were validated using independent methods and independent clinical data sets; this diminished the potential advantage of the use of a panel of markers over a single marker in diagnostic and/or prognostic applications. Recently we attempted to address some of these limitations by using microarray-based gene expression profiling to identify molecu-lar signatures that comprise small clusters of coregulated tran-scripts and distinguish subgroups of prostate cancer patients with differing outcomes after therapy (15). In these experiments for signature discovery and validation, we used 2 independent cohorts of prostate cancer patients (15). The proposed prostate cancer prognosis predictor algorithm uses a panel of 3 molecu-lar signatures and appears to demonstrate high discrimination accuracy between subgroups of patients with distinct clinical outcome after therapy, providing additional predictive value over conventional markers of outcome (15).
Most recently, the global gene expression profiling approach was successfully used to identify molecular signatures associ-ated with activation of oncogenic pathways (28), targeted genet-ic manipulations (29), and cellular responses to physiologgenet-ical stimuli (30) and to build robust transcriptional identifiers that reliably recognize the engagement of corresponding pathways within the highly complex patterns of gene expression in experi-mental and clinical samples.
Nonstandard abbreviations used: MSKCC, Memorial Sloan-Kettering Cancer Center; MTTS, metastatic TRAMP tumor sample; PAI, phenotype association index; PNS, peripheral nervous system; PSA, prostate-specific antigen; Q-RT-PCR, quantita-tive RT-PCR; RP, radical prostatectomy; siRNA, small interfering RNA; SPAI, stem cell–like PAI; SVM, support vector machine; TRN, terrain.
Conflict of interest: Gennadi V. Glinsky is a named inventor on a related patent application and serves as a consultant to Stratagene Inc. (La Jolla, California, USA) in the field of cancer biomarker development.
We hypothesized that molecular signatures associated with acti-vation of a normal stem cell’s self-renewal program in metastatic cancer cells might be detectable by searching for genes exhibit-ing concordant patterns of regulation in metastatic lesions and normal stem cells in Bmi-1+/+ versus Bmi-1–/– genetic backgrounds.
Here we report that the expression of Bmi-1 is elevated and a stem cell–like BMI-1–associated gene expression pathway is activated in metastatic prostate tumors. We provide evidence that the stem cell–resembling expression profile of the 11-gene signature in
[image:3.585.53.529.82.513.2]pri-mary prostate tumors predicts therapy failure in prostate cancer patients. We show that expression of the 11-gene signature is a powerful predictor of a short interval to distant metastasis and poor survival after therapy in breast and lung cancer patients diag-nosed with an early-stage disease. Finally, we extend our therapy-outcome analysis to include 1,153 cancer patients diagnosed with 11 different cancer types and demonstrate that prognostic power of the 11-gene signature is informative in all 11 different types of human cancer diagnosed in multiple organs.
Figure 1
Results
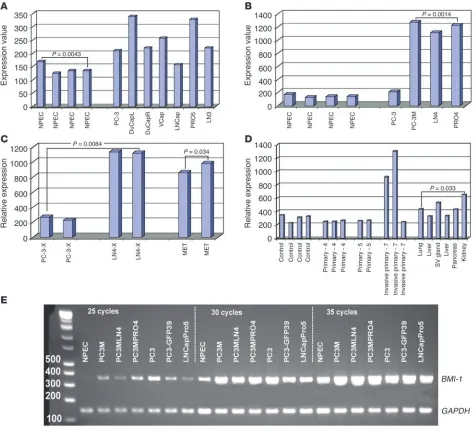
BMI-1 oncogene expression is elevated in prostate cancer. Recent experi-mental observations documented an increased Bmi-1 expression in human non-small-cell lung cancer (11), human breast carcinomas (31), and established breast cancer cell lines (12), suggesting that an oncogenic role of Bmi-1 activation may be extended beyond leu-kemia and, perhaps, may affect progression of the epithelial malig-nancies as well. Microarray gene expression analysis of established cancer cell lines representing multiple experimental models of human prostate cancer (16) revealed that BMI-1 expression seems to be consistently elevated in human prostate cancer cell lines compared with the primary cultures of normal human prostate epithelial cells (Figure 1, A and B). To validate the results of the microarray experiments, we confirmed these observations using quantitative RT-PCR (Q-RT-PCR) analysis of BMI-1 mRNA expres-sion (Table 1; and see Supplemental Figure 1; supplemental mate-rial available online with this article; doi:10.1172/JCI23412DS1). Thus, results of expression profiling experiments appear to sup-port the notion that transcriptional activation of the BMI-1 gene is frequently associated with human prostate cancer.
Interestingly, microarray analysis shows markedly higher BMI-1 expression levels in lymph node metastases and highly meta-static orthotopic xenografts of human prostate carcinoma in nude mice compared with the less metastatic counterparts (Fig-ure 1C), implying that BMI-1 activation might be associated with aggressive malignant behavior of prostate carcinoma cells. To test this hypothesis, we carried out expression profiling analysis of approximately 12,000 transcripts in a transgenic mouse model of metastatic prostate cancer (32). Microarray experiments detected increased levels of Bmi-1 mRNA expression in late-stage invasive primary tumors and multiple distant metastatic lesions in the TRAMP transgenic mouse model of prostate cancer (Figure 1D), thus lending more credence to the idea that activation of a BMI-1– associated pathway is linked with prostate cancer metastasis. It should be pointed out that despite the apparently consistent pat-tern of increased Bmi-1 expression in prostate cancer, there is con-siderable variability in the degree of elevation of Bmi-1 expression at the distinct sites of malignant growth in vivo (Figure 1D). We carried out the Q-RT-PCR analysis of Bmi-1 mRNA expression in 4 additional late-stage invasive primary prostate tumors of the 6- to 7-month old TRAMP mice and confirmed the 2- to 8-fold increase in Bmi-1 expression in all 4 tumors (data not shown).
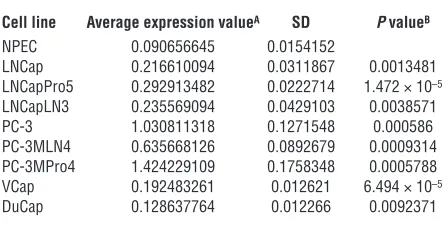
Identification of a BMI-1–pathway signature with concordant expression profiles in normal stem cells and distant metastatic lesions in a transgenic mouse model of prostate cancer. Recent experiments established that the Bmi-1 gene is required for self-renewal of hematopoietic and neural stem cells (1–3) and identified BMI-1–regulated genes in neural stem cells that are presumably engaged in an execution of self-renewal programs in a state of both central nervous system (CNS) and peripheral nervous system (PNS) neurospheres (3). We hypothesized that molecular signatures associated with activation of a normal-stem cell’s self-renewal program in metastatic cancer cells might be detectable by looking for genes manifesting concor-dant patterns of regulation in metastasis and normal stem cells in
Bmi-1+/+ versus Bmi-1–/– genetic backgrounds. Therefore, we set out
to determine whether expression profiles of transcripts activated and suppressed in prostate cancer metastases would recapitulate the expression profile of the BMI-1–regulated genes in normal stem cells, by comparing the sets of differentially regulated genes in search of intersection of lists for both up- and downregulat-ed transcripts (see Figures 2 and 3, Methods, and supplemental material for description of a signature discovery protocol). This analysis identified genes exhibiting highly concordant profiles of transcript-abundance behavior in prostate cancer metastases and
Bmi-1+/+ versus Bmi-1–/– PNS neurospheres, suggesting the presence
of a conserved BMI-1–regulated pathway(s) similarly engaged in both normal stem cells and distant metastatic lesions of prostate carcinoma (Figures 2 and 3).
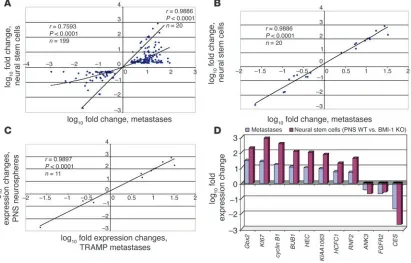
The metastatic TRAMP tumor sample (MTTS) signature is likely to be enriched for genes discriminative for the metastatic phenotype. It is reasonable to assume that many gene expres-sion patterns wired into the MTTS signature would manifest the power to discriminate the metastatic phenotype and would have no relation to the transcriptional program of normal stem cells. We sought to use these features of the MTTS signature for identification of the gene expression components of a stem cell transcriptome that are coordinately expressed in metastatic cancer cells and might manifest discriminative diagnostic power for the malignant phenotype. Sets of differentially regulated transcripts were independently identified for distant metastatic lesions and primary prostate tumors versus age-matched control samples in a transgenic TRAMP mouse model of metastatic prostate cancer (MTTS signature) as well as PNS (PNS signature) and CNS (CNS signature) neurospheres in Bmi-1+/+ versus Bmi-1–/– backgrounds.
This analytical step defined 3 large parent signatures (Figure 3): MTTS signature comprising 868 upregulated and 477 downregu-lated transcripts; PNS signature comprising 885 upregudownregu-lated and 1,088 downregulated transcripts; and CNS signature comprising 769 upregulated and 778 downregulated transcripts.
Next we intersected the MTSS signature with the stem cell signatures in the state of PNS and CNS neurospheres to iden-tify concordant sets of genes and define the stem cell signatures embedded into MTSS signature (Figures 2 and 3). Subsets of transcripts exhibiting concordant expression changes in MTTS (MTTS signature) as well as PNS (PNS signature) and CNS (CNS signature) neurospheres in Bmi-1+/+ versus Bmi-1–/– backgrounds
[image:4.585.53.275.123.236.2]were identified. Thus, 2 concordant subsets of transcripts were identified corresponding to each binary comparison of metastatic TRAMP tumors and neural stem cell samples in a state of PNS and CNS neurospheres (141 upregulated and 58 downregulated tran-scripts for PNS neurospheres [r = 0.7593; P < 0.0001; Figure 2A] and 40 upregulated and 24 downregulated transcripts for CNS Table 1
Q-RT-PCR analysis of BMI-1 mRNA expression in human pros-tate carcinoma cell lines
Cell line Average expression valueA SD P valueB
NPEC 0.090656645 0.0154152
LNCap 0.216610094 0.0311867 0.0013481
LNCapPro5 0.292913482 0.0222714 1.472 × 10⁻⁵
LNCapLN3 0.235569094 0.0429103 0.0038571
PC-3 1.030811318 0.1271548 0.000586
PC-3MLN4 0.635668126 0.0892679 0.0009314 PC-3MPro4 1.424229109 0.1758348 0.0005788 VCap 0.192483261 0.012621 6.494 × 10⁻⁵
DuCap 0.128637764 0.012266 0.0092371
neurospheres [r = 0.7679; P < 0.0001]). A third concordant sub-set of 27 genes comprising 15 upregulated and 12 downregulated transcripts was selected for intersection common to all 3 signa-tures (r = 0.8002; P < 0.0001).
This analysis also identified a stem cell–like expression profile for transcripts coordinately expressed in metastatic cancer cells and normal stem cells, which can be used as a consistent reference standard to interrogate independent data sets for possible pres-ence of a stem cell–like expression signature (Figure 2). Practical considerations essential for future development of genetic diag-nostic tests using an analytical platform most compatible with the state-of-the-art clinical laboratory practice prompted us to select from concordant gene sets small gene expression signatures com-prising transcripts with a high level of expression correlation in metastatic cancer cells and stem cells (the selection threshold for small signatures was arbitrarily set at Pearson correlation coeffi-cients greater than 0.95). The reduction in the signature transcript number was terminated when further elimination of a transcript did not increase the value of the Pearson correlation coefficient. Using this approach, a single candidate prognostic gene expres-sion signature was selected for each binary intersection of the MTTS signature and parent stem cell signatures (Figure 3). Then
small signatures (1 11-gene signature for the PNS set, 1 11-gene signature for the CNS set, and one 14-gene signature for the com-mon PNS/CNS set) were tested for the power to discriminate the metastatic phenotype (using 1 mouse prostate cancer data set and 1 human prostate cancer data set comprising primary and meta-static tumors) and therapy-outcome classification performance (using human prostate cancer therapy outcome set 1). Based on diagnostic and prognostic classification performance, a single best-performing 11-gene MTTS/PNS signature was selected for further validation analysis (Figures 3 and 4).
[image:5.585.92.503.85.348.2]During the malignant-phenotype classification performance tests (Figure 4), we asked whether individual metastatic lesions and primary prostate tumors would exhibit a stem cell–like expres-sion profile of the candidate prognostic signatures. We selected for this analysis 3 small signatures demonstrating the most sig-nificant correlation (Figures 2 and 3) of expression profiles in stem cells and prostate cancer metastasis. To assess a degree of similarity of the signature expression profiles in individual tumor samples and normal stem cells, we calculated a Pearson correla-tion coefficient for each sample by comparing signature expres-sion profile in an individual sample to the stem cell–associated expression profile of the corresponding small signatures. Based on Figure 2
Distant metastatic lesions in the TRAMP transgenic mouse model of prostate cancer exhibit stem cell–like expression signatures of the BMI-1 pathway. Transcripts differentially regulated in distant metastatic lesions of 6-month-old TRAMP mice (MTTS signature) were compared with the BMI-1–regulated genes in neural stem cells (3) in search of intersection of lists. (A) Expression profiles and the corresponding Pearson cor-relation coefficient for 199 genes (141 upregulated and 58 downregulated) comprising concordant differentially regulated sets of transcripts in metastatic TRAMP samples and PNS neurospheres are shown. Small gene expression signatures comprising transcripts with a high level of expression correlation in metastatic cancer cells and stem cells (the selection threshold for small signatures was arbitrarily set at Pearson cor-relation coefficients greater than 0.95) were selected from large concordant sets. The reduction in the signature transcript number was terminated when further elimination of a transcript did not increase the value of the Pearson correlation coefficient. Using this approach, a single candidate prognostic gene expression signature was selected for each binary intersection of the MTTS signature and parent stem cell signatures (Figure 3). Consecutive steps of selection from the 199-gene concordant set of a subset of 20 genes (A and B) and a small MTTS/PNS 11-gene signature (C
expected similarity of the prognostic signatures in stem cells and prostate cancer metastasis, we named the corresponding Pearson correlation coefficients measured for individual samples the stem cell–like phenotype association indices (SPAIs; see Methods for a description of definition and measurement of SPAIs). As shown in Figure 4, A, D, and G, 2 of 3 late-stage invasive primary tumors and all distant metastatic lesions in the TRAMP transgenic mouse model of prostate cancer have positive SPAIs, thus manifesting a stem cell–like expression profile of the small signatures.
Distant metastatic lesions and primary prostate tumors from cancer patients with differing therapy outcome display distinct expression profiles of the 11-gene MTTS/PNS signature. To perform similar analysis for human tumors, we translated the murine small signatures into a list of human homologs using the NCBI UniGene database (http://www.ncbi.nlm.nih.gov/entrez/query.fcgi?db=unigene) and retrieved the expression data for corresponding Affymetrix probe sets (Tables 2 and 3 and Supplemental Table 2). We calculated the SPAIs for each of the 9 metastatic tumors and 23 primary pros-tate carcinomas and determined that 7 of 9 samples of distant metastatic lesions from prostate cancer patients exhibited a stem cell–like expression profile of the 11-gene MTTS/PNS signature (Figure 4B). In contrast, a majority of primary prostate tumors seemed to display a distinct expression profile of the 11-gene MTTS/PNS signature as manifested in negative SPAI values (Figure 4B). Interestingly, a subset of samples of primary prostate
carcinomas manifested expres-sion profiles of the 11-gene MTTS/PNS signature similar to those of the metastatic tumors, as reflected in positive correla-tion coefficients (positive SPAI values in Figure 4B), suggesting that primary prostate tumors with distinct expression profiles of the PNS neurosphere–derived 11-gene signature (e.g., positive and negative SPAI values) may have different biological features and distinct clinical courses of disease progression. Validation analysis using the CNS neu-rosphere–derived MTTS/CNS 11-gene signature and MTTS/ PNS/CNS 14-gene signature indicates that application of these signatures is less informa-tive in distinguishing metastatic and primary human prostate tumors (Figure 4, E and H).
To evaluate the potential biological significance and clinical utility of the 11-gene MTTS/PNS signature expres-sion in human prostate cancer, we set out to examine whether the detection of a stem cell–like expression profile in primary prostate tumors of individual cancer patients would help in patients’ stratification at the time of diagnosis into subgroups with distinct courses of dis-ease progression based on differing therapy outcome after radi-cal prostatectomy (RP). We assessed the prognostic power of the 11-gene signature based on ability to segregate the patients with recurrent and nonrecurrent course of disease progression after RP into distinct subgroups. We calculated a Pearson correlation coefficient for each of 21 tumor samples of outcome set 1 by com-paring the 11-gene signature expression profiles of individual samples with the stem cell–like expression profile of the 11-gene BMI-1–pathway signature in PNS neurospheres (Figure 2). To determine the prognostic power of the 11-gene signature, we performed the Kaplan-Meier survival analysis using, as a clini-cal endpoint, the disease-free interval after therapy in prostate cancer patients with positive and negative SPAIs.
[image:6.585.48.410.81.404.2]The Kaplan-Meier survival curves showed a highly significant difference in the probability that prostate cancer patients would remain disease-free after therapy between the groups with positive and negative SPAIs defined by the 11-gene MTTS/PNS signature (Figure 4C), suggesting that patients with positive SPAIs exhibit a poor outcome signature whereas patients with negative SPAIs manifest a good outcome signature. The estimated hazard ratio for disease recurrence after therapy in the group of patients with posi-tive SPAIs as compared with the group of patients with negaposi-tive SPAIs defined by the 11-gene MTTS/PNS signature (Figure 4C) was 9.259 (95% confidence interval of ratio, 1.545–26.07; P = 0.0104). Figure 3
Fifty-eight percent of patients with positive SPAIs had a disease recurrence within 3 years after therapy, whereas 90% of patients with negative SPAIs remained relapse-free (Figure 4C). Five years after therapy, 69% of patients with positive SPAIs had a disease recurrence, whereas 90% of patients with negative SPAIs remained relapse-free (Figure 4C). In contrast to the PNS neurosphere– derived signature, the CNS neurosphere–derived signature failed
[image:7.585.45.544.80.542.2]to stratify the prostate cancer patients into prognostic subgroups with distinct probability of disease relapse after therapy (P = 0.6501; Figure 4F). Similarly, the 14-gene MTTS/PNS/CNS signature failed in both classification-performance tests using human cancer specimens (P = 0.4916; Figure 4, H and I). Based on this analysis, we identified the 11-gene MTTS/PNS signature as a best-perform-ing malignant-phenotype classifier and proposed to identify the Figure 4
group of prostate cancer patients with positive values of the PNS neurosphere–derived 11-gene signature as a poor-prognosis group and the group of prostate cancer patients with negative values of the 11-gene signature as a good-prognosis group.
The identified signature genes were defined based on a strong correlative behavior in multiple independent sets of experimental and clinical samples obtained from 2 species (mice and humans). To test by independent methods the suspected association of the expression of BMI-1–pathway target genes with the expression of the BMI-1 gene product in the context of human cancer cells, we subjected human prostate carcinoma cells to small interfering RNA–mediated (siRNA-mediated) silencing of expression of the endogenous BMI-1 gene. The PC-3-32 human prostate carcinoma cells were transfected with BMI-1 or control siRNAs and continu-ously monitored for mRNA expression levels of BMI-1 and a select-ed set of genes using RT-PCR and Q-RT-PCR methods (data not shown). Q-RT-PCR and RT-PCR analyses showed that the siRNA-mediated BMI-1–silencing protocol allowed for approximately 90% inhibition of the endogenous BMI-1 mRNA expression. We vali-dated the effect of siRNA-mediated BMI-1 silencing at the BMI-1 protein expression level using immunofluorescent
analysis. The BMI-1 silencing was specific, since the expression levels of 9 unrelated transcripts (such as GAPDH, EZH2, and several other genes) were not altered (data not shown). Consistent with the hypothesis that expression of genes comprising the BMI-1–pathway signature is associated with the expression of the BMI-1 gene product, mRNA abundance levels of 8 of 11 interrogated BMI-1– pathway target genes were altered in the human prostate carcinoma cells with approximately 90% silenced BMI-1 gene.
Reduction of the BMI-1 mRNA and protein expression in human prostate carcinoma metas-tasis precursor cells did not alter significantly the viability of adherent cultures grown at the optimal growth condition and in serum-starva-tion experiments (data not shown) and had only modest inhibitory effect on proliferation (an approximately 25–30% reduction in the number
of cells during the 3-day silencing protocol). However, the ability of human prostate carcinoma cells to survive in a nonadherent state was severely affected after siRNA-mediated reduction of the
BMI-1 expression. Fluorescence-activated cell sorting (FACS) anal-ysis revealed an approximately 3-fold increase of apoptosis in the
BMI-1 siRNA–treated human prostate carcinoma cells cultured in nonadherent conditions. These data suggest that human prostate carcinoma cells expressing a high level of the BMI-1 protein are more resistant to apoptosis induced in cells of epithelial origin in response to attachment deprivation (anoikis) and, perhaps, would survive better in blood during metastatic dissemination, thus forming a pool of metastasis precursor cells that can sur-vive circulatory stress. Thorough follow-up experiments would be required to establish to a full extent the biological and functional role of BMI-1 overexpression and BMI-1–pathway activation in the various epithelial cancers.
[image:8.585.53.275.123.266.2]Expression of the 11-gene MTTS/PNS signature in primary prostate tumors is a predictor of a therapy failure in prostate cancer patients. To validate a survival prediction model based on the 11-gene MTTS/ PNS signature, we tested the prognostic performance of the model in multiple independent therapy-outcome data sets represent-ing 5 epithelial and 5 nonepithelial cancers (Table 3). We divided patients within individual cohorts into a training set, which was used to select the cutoff threshold and to test the model, and a test set, which was used to evaluate the reproducibility of the classifica-tion performance. Using the training set of samples, we selected the prognosis-discrimination cutoff value for a signature based on the highest level of statistical significance in patients’ strati-fication into poor- and good-prognosis groups as determined by the log-rank test (lowest P value and highest hazard ratio in the training set). Clinical samples having the Pearson correlation coef-ficient at or higher than the cutoff value were identified as having the poor-prognosis signature. Clinical samples with the Pearson correlation coefficient lower than the cutoff value were identified as having the good-prognosis signature. The same discrimination cutoff value was then applied to evaluate the reproducibility of the prognostic performance in the test set of patients. Lastly, we applied the model to the entire outcome set using the same cutoff threshold to confirm the classification performance. The training and test sets were balanced with respect to the total number of Table 2
Cancer types and number of cancer patients in the therapy-out-come sets analyzed in this study
Cancer type No. of patients Reference
Prostate cancer 100 14, 15
Breast cancer 97 33
Lung cancer 211 34, 56
Ovarian cancer 81 57, 58
Bladder cancer 31 59
Lymphoma 298 60, 61
MCL 92 62
Mesothelioma 17 63
Medulloblastoma 60 64
Glioma 50 65
AML 116 66
Total 1,153
MCL, mantle cell lymphoma; AML, acute myeloid leukemia.
Table 3
The 11-gene signature associated with poor prognosis of cancer patients diag-nosed with multiple types of cancer
Gene UniGeneA Affymetrix MG-U74A GenBank UniGeneA
(Homo sapiens) probe set accession no. (Mus musculus)
Gbx2 Hs.184945 94200_at Z48800 Mm.204730
KI67 Hs.80976 99457_at X82786 Mm.4078
CCNB1 Hs.23960 160159_at X64713 Mm.318364
BUB1 Hs.469649 104097_at AF002823 Mm.2185
KNTC2 Hs.414407 93441_at AI595322 Mm.225956
USP22 Hs.462492 97960_at AW125800 Mm.30602
HCFC1 Hs.83634 100901_at U80821 Mm.248353
RNF2 Hs.124186 93164_at Y12783 Mm.31512
ANK3 Hs.499725 98477_s_at L40632 Mm.235960
FGFR2 Hs.533683 93090_at M23362 Mm.16340
CES1 Hs.499222 101538_i_at AW226939 Mm.292803
[image:8.585.255.530.579.721.2]patients, negative and positive therapy outcomes, and the length of survival. At this stage of the analysis, we did not carry out addi-tional model training, development, or optimization steps, except for selection of a prognostic cutoff threshold in the training set. Throughout the study, we consistently used the same MTTS/PNS expression profile as a reference standard to quantify the Pearson correlation coefficients of the individual samples.
In addition to this analysis, we confirmed the model perfor-mance using various sample-stratification approaches, such as terrain (TRN) clustering (Figure 5), support vector machine (SVM) classification (Supplemental Table 4), and weighted survival score algorithm (Figure 6E and Figure 7D). Finally, we evaluated the therapy outcome–predictive power of the 11-gene model in a prostate cancer setting using a prognostic test based on an independent method of gene expression analysis, namely the Q-RT-PCR method (Figure 6F).
To further validate the potential clinical utility of the 11-gene MTTS/PNS signature, we evaluated the prognostic power of the 11-gene signature applied to an independent set of 79 clinical samples (prostate cancer outcome set 2) obtained from 37 prostate cancer patients who developed recurrence after the therapy and 42 patients who remained disease-free. In this cohort of patients, the Kaplan-Meier survival analysis demonstrated a highly significant difference in the probability that prostate cancer patients would remain disease-free after therapy between the groups with positive and negative SPAIs defined by the 11-gene BMI-1–pathway signa-ture (Figure 6, A–C). The estimated hazard ratio for disease recur-rence after therapy in the group of patients with positive SPAIs as compared with the group of patients with negative SPAIs defined by the 11-gene MTTS/PNS signature (Figure 6C) was 3.74 (95% confi-dence interval of ratio, 3.010–25.83; P < 0.0001). Sixty-seven percent of patients with positive SPAIs had a disease recurrence within 3 years after therapy, whereas 70% of patients with negative SPAIs remained relapse-free (Figure 6C). Five years after therapy, 83% of patients with positive SPAIs had a disease recurrence, whereas 64% of patients with negative SPAIs remained relapse-free (Figure 6C).
[image:9.585.46.426.82.327.2]The standard Kaplan-Meier log-rank statistic assesses the differ-ence in the survival curves. However, it does not test for multiple hypotheses or account for random co-occurrence; this represents an inherent problem of the gene expression profiling experiments. We attempted to partly mitigate this problem by using an alterna-tive biological endpoint to the patients’ survival during the signa-ture selection process and by applying the survival analysis to a single signature, thus eliminating the multiple comparisons from the survival model building protocol. The MTTS signature is likely to carry many gene expression patterns displaying the power to discriminate the metastatic phenotype that have no relation to the transcriptional program of normal stem cells. One of our main goals was to identify the stem cell signature that is associated with the pluripotency self-renewal phenotype and is embedded into MTTS signature. This approach implies that a candidate marker signature would have a defined stem cell–like expression profile that can be used in the subsequent follow-up validation analyses as a reference standard to look for expression of a stem cell–like sig-nature in clinical samples. To further assess the statistical validity of the 11-gene stem cell–like profile, we performed 1,000 random permutations of the 11-gene stem cell profiles randomly selected from the 1,973-gene PNS signature. For each random 11-gene stem cell profile, we assessed its metastatic phenotype–discrimi-native performance in the TRAMP transgenic mouse model at the discriminative confidence levels of the 11-gene BMI-1-pathway MTTS/PNS signature. Only 1 random 11-gene stem cell profile of the 1,000 permutations demonstrated classification power match-ing the metastatic phenotype–discriminative performance of the 11-gene MTTS/PNS signature. We performed 10,000 permuta-tions to test the likelihood that small 11-gene signatures derived from the large MTTS signature would display high discrimination power to assess the significance at the 0.1% level. We carried out 10,000 permutations of small 11-gene signatures derived from the large 1,345-gene MTTS signature and compared their sample-stratification power with that of the 11-gene MTTS/PNS signature. The classification-performance cutoff P values were established by
Figure 5
TRN analysis within the mRNA abundance space of genes con-stituting the 11-gene MTTS/PNS signature reveals clustering pat-terns, among prostate cancer (A and B) and breast cancer (C and D) patients, that are asso-ciated with distinct frequencies of therapy failure (A and B) and dif-fering probability of disease-free survival after therapy (C and D). A TRN clustering algorithm was applied to the 79 samples (A) con-stituting prostate cancer therapy outcome set 2 and the 97 sam-ples (C) constituting the breast cancer therapy outcome set. Kaplan-Meier analysis (B and D) was applied to subgroups of patients defined by the TRN clustering algorithm as shown in
application of a 2-tailed Student’s t test to the 11-gene MTTS/PNS signature (P = 0.0005 for metastasis versus primary prostate cancer data set and P = 0.026 for recurrent versus nonrecurrent prostate cancer data set). We found that 10,000 permutations generated 7 random 11-gene signatures performing at the sample-classifica-tion level of the 11-gene MTTS/PNS signature.
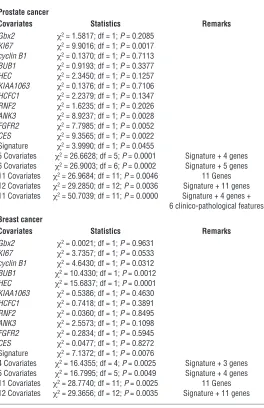
Cox proportional hazard survival regression analysis. To ascertain the incremental statistical power of the individual covariates as predic-tors of therapy outcome and unfavorable prognosis, we performed both univariate and multivariate Cox proportional hazard survival analyses (Table 4). Several individual gene members of the 11-gene signature, such as KI67 and Cyclin B1, have been described previ-ously as significant predictors of prognosis and may reflect corre-lation between proliferative fraction and poor therapy outcome as has been shown recently for the lymphoma survival predictor sig-nature. However, our analysis appears to indicate that the 11-gene signature is a more uniform therapy-outcome predictor across the multiple data sets compared with the individual genes (see below) and, perhaps, is a better “integrator” and “sensor” of the biologi-cal diversity across the spectrum of human cancers. We performed both univariate and multivariate Cox proportional hazard surviv-al ansurviv-alyses to compare the prognostic performance of the entire
11-gene signature and individual genes (Table 4 and Supplemen-tal Table 3). In the univariate analysis, prognostic performance of
KI67 expression as a predictor of therapy outcome varied in dif-ferent outcome data sets. It was highly significant in the prostate cancer therapy outcome set 2 (Memorial Sloan-Kettering Cancer Center [MSKCC] data set); however, it showed only a trend toward statistical significance in the prostate cancer outcome set 1 (P = 0.1; Harvard data set) and the breast cancer outcome data set (P = 0.0533). In prostate cancer, the significant prognosis predictors in univari-ate Cox regression analysis were KI67, ANK3, FGFR2, CES, and the 11-gene MTTS/PNS signature. In breast cancer, the significant prognosis predictors in univariate analysis were Cyclin B1, BUB1,
HEC, and the 11-gene signature. Thus, our analysis seems to indi-cate that individual genes demonstrate a variable performance across multiple outcome data sets, and we were unable to identify a single gene uniformly predictive of the poor therapy outcome.
In the multivariate analysis (Table 5), the most significant pros-tate cancer recurrence predictor was the model that included 11 covariates (11-gene signature; 4 individual genes [KI67, ANK3,
FGFR2, and CES1]; and 6 clinico-pathological features [pre-RP PSA, RP Gleason sum, surgical margins, seminal vesicle invasion, age, and extracapsular extension]). Interestingly, several covari-Figure 6
[image:10.585.69.515.80.384.2]Figure 7 Classification of p a t i e n t s d i a g -nosed with 4 dif-ferent types of epi-thelial cancer into subgroups with distinct therapy outcome based on expression pro-file of the 11-gene MTTS/PNS signa-ture. Kaplan-Meier analysis of the probability that patients would remain metastasis-free (for the breast cancer group) or survive after ther-apy (for the other groups) among 97 early-stage breast cancer patients (A–D), 125 lung adenocarcinoma patients of all stag-es (E–G), 35 lung adenocarcinoma p a t i e n t s d i a g -nosed with stage 1A disease (H), 37 ovarian can-cer patients of all stages (I–K), and 31 bladder cancer patients (L–N), according to whe-ther they had a good-prognosis or a poor-prog-nosis signature as defined by the expression pro-files of the 11-gene MTTS/PNS sig-nature. For each type of cancer, the patient’s stratifica-tion cutoff value was defined in the training set, vali-dated in a test set, and confirmed in an entire cohort.
ates, such as the 11-gene signature, KI67, CES1, pre-RP prostate-specific antigen (PSA) level, surgical margins, and extracapsular extension, remained statistically significant prognostic markers in the multivariate analysis (Table 5). Thus, while prognostic perfor-mance of individual gene members of the 11-gene signature var-ied greatly in different outcome data sets, the identifvar-ied 11-gene signature seems to perform as the most consistent predictor of poor therapy outcome across multiple independent outcome data sets comprising over 1,000 clinical samples and representing 11 distinct types of human cancer (see below). Yet the statistically best-performing multivariate cancer type–specific model seems to require a combination of calls based on expression levels of individual genes, a gene expression signature, and clinico-patho-logical covariates (Tables 4 and 5).
We sought to use an alternative statistical metric to further eval-uate the prognostic power of the genes constituting the 11-gene signature. We implemented the weighted survival score analy-sis to reflect the incremental statistical power of the individual
covariates as predictors of therapy outcome based on a multicomponent prognostic model (Figure 6E). Final survival predictor score comprises a sum of scores for individual genes and reflects the relative contribution of each of the 11 genes in the multi-variate analysis. The negative weighting values imply that higher expression correlates with longer survival and favorable prognosis, whereas the positive score values indicate that higher expression correlates with poor outcome and shorter survival. Applica-tion of the weighted survival predictor model based on a cumulative score of the weighted expression values of 11 genes confirmed the prognostic power of the identified 11-gene signature in stratification of prostate cancer patients into subgroups with sta-tistically distinct probability of relapse-free survival after RP (Figure 6E).
Expression of the 11-gene MTTS/PNS signature is a predictor of a short relapse-free survival after therapy in prostate cancer patients with an early-stage disease. Iden-tification of patients with high likelihood of poor outcome after therapy would be particularly desir-able in a cohort of patients diagnosed with a seem-ingly localized early-stage prostate cancer. Next we determined whether the 11-gene MTTS/PNS sig-nature would be useful in defining subgroups of patients diagnosed with an early-stage prostate can-cer and having a statistically significant difference in the likelihood of disease relapse after therapy. In the group of patients diagnosed with stage 1C or 2A prostate cancer (Figure 6D), the median relapse-free survival after therapy in the poor-prognosis subgroup defined by the 11-gene BMI-1–pathway signature was 27 months. In contrast, the median relapse-free survival after therapy in the good-prog-nosis group was 82.4 months. Eighty-eight percent of patients in the poor-prognosis subgroup had a disease recurrence within 5 years after therapy. Conversely, 64% of patients in the good-prognosis subgroup remained relapse-free (Figure 6D). The estimated hazard ratio for disease recurrence after therapy in the poor-prognosis subgroup as com-pared with the good-prognosis subgroup of patients defined by the 11-gene signature was 3.907 (95% confidence interval of ratio, 2.687–34.84; P = 0.0005).
[image:12.585.56.320.110.518.2]Validation of the prognostic performance of the 11-gene BMI-1–pathway signature using a Q-RT-PCR–based assay. Routine clinical use of prog-nostic tests based on microarray-derived gene expression signa-tures would require prospective validation study of the utility of identified markers in an experimental setting highly compatible with state-of-the-art clinical laboratory practice. Since microarray-based assay format is not readily available for application in the clinical laboratory, we considered the Q-RT-PCR–based test as an alternative clinically compatible analytical platform suitable for measurements of mRNA expression level of marker genes. Expres-sion of mRNA for 11 genes (Supplemental Table 1) and an endog-enous control gene (GAPDH) was measured by real-time PCR in 20 specimens of primary prostate cancer obtained from patients with documented PSA recurrence within 5 years after RP and patients who remained disease-free for at least 5 years after RP (10 patients Table 4
Cox proportional hazard survival regression analysis
Prostate cancer
Covariates Statistics Remarks
Gbx2 χ2 = 1.5817; df = 1; P = 0.2085
KI67 χ2 = 9.9016; df = 1; P = 0.0017
cyclin B1 χ2 = 0.1370; df = 1; P = 0.7113
BUB1 χ2 = 0.9193; df = 1; P = 0.3377
HEC χ2 = 2.3450; df = 1; P = 0.1257
KIAA1063 χ2 = 0.1376; df = 1; P = 0.7106
HCFC1 χ2 = 2.2379; df = 1; P = 0.1347
RNF2 χ2 = 1.6235; df = 1; P = 0.2026
ANK3 χ2 = 8.9237; df = 1; P = 0.0028
FGFR2 χ2 = 7.7985; df = 1; P = 0.0052
CES χ2 = 9.3565; df = 1; P = 0.0022
Signature χ2 = 3.9990; df = 1; P = 0.0455
5 Covariates χ2 = 26.6628; df = 5; P = 0.0001 Signature + 4 genes
6 Covariates χ2 = 26.9003; df = 6; P = 0.0002 Signature + 5 genes
11 Covariates χ2 = 26.9684; df = 11; P = 0.0046 11 Genes
12 Covariates χ2 = 29.2850; df = 12; P = 0.0036 Signature + 11 genes
11 Covariates χ2 = 50.7039; df = 11; P = 0.0000 Signature + 4 genes +
6 clinico-pathological features
Breast cancer
Covariates Statistics Remarks
Gbx2 χ2 = 0.0021; df = 1; P = 0.9631
KI67 χ2 = 3.7357; df = 1; P = 0.0533
cyclin B1 χ2 = 4.6430; df = 1; P = 0.0312
BUB1 χ2 = 10.4330; df = 1; P = 0.0012
HEC χ2 = 15.6837; df = 1; P = 0.0001
KIAA1063 χ2 = 0.5386; df = 1; P = 0.4630
HCFC1 χ2 = 0.7418; df = 1; P = 0.3891
RNF2 χ2 = 0.0360; df = 1; P = 0.8495
ANK3 χ2 = 2.5573; df = 1; P = 0.1098
FGFR2 χ2 = 0.2834; df = 1; P = 0.5945
CES χ2 = 0.0477; df = 1; P = 0.8272
Signature χ2 = 7.1372; df = 1; P = 0.0076
4 Covariates χ2 = 16.4355; df = 4; P = 0.0025 Signature + 3 genes
5 Covariates χ2 = 16.7995; df = 5; P = 0.0049 Signature + 4 genes
11 Covariates χ2 = 28.7740; df = 11; P = 0.0025 11 Genes
12 Covariates χ2 = 29.3656; df = 12; P = 0.0035 Signature + 11 genes
in each group). As shown in Figure 6F, a prostate cancer therapy outcome test based on measurements of mRNA expression lev-els of 11 genes using Q-RT-PCR discriminates prostate cancer patients into subgroups with statistically distinct probability of relapse-free survival after RP.
The Kaplan-Meier survival analysis demonstrated that appli-cation of the 11-gene Q-RT-PCR–based prostate cancer therapy outcome test segregates prostate cancer patients into subgroups with statistically significant difference in the probability of remaining relapse-free after the therapy (Figure 6F). The estimat-ed hazard ratio for disease recurrence after therapy in the poor-prognosis group of patients as compared with the good-progno-sis group defined by the test was 21.3 (95% confidence interval of ratio, 5.741–98.39; P < 0.0001). One hundred percent of patients in the poor-prognosis group had a disease recurrence within 4 years after RP, whereas 91% of patients in the good-prognosis group remained relapse-free (Figure 6F).
Expression of the 11-gene MTTS/PNS signature predicts metastatic recurrence and poor survival after therapy in breast cancer and lung adenocarcinoma patients diagnosed with an early-stage disease. BMI-1 expression was previously implicated in human breast and lung cancers (11, 12, 31), which suggests that activation of BMI-1– associated pathway(s) might be relevant to these types of carcino-mas as well. We therefore sought to investigate whether measure-ments of expression of the 11-gene MTTS/PNS signature would be informative in the prediction of the patients’ prognosis in a group of 97 young women diagnosed with sporadic lymph node– negative early-stage breast cancer who were analyzed in a recent expression profiling study of early-stage breast cancer (33). (This group comprises 46 patients who developed distant metastases within 5 years and 51 patients who continued to be disease-free at least 5 years after therapy; they constitute clinically defined poor-prognosis and good-prognosis groups, correspondingly.) Kaplan-Meier analysis indicates that breast cancer patients with tumors displaying a stem cell–like expression profile of the 11-gene signature have a significantly higher probability of develop-ing distant metastases within 5 years after therapy and therefore can be identified as a poor-prognosis subgroup (Figure 7, A–D). Median metastasis-free survival after therapy in the poor-prog-nosis subgroup of breast cancer patients defined by the 11-gene
signature was 26 months. Eighty-four percent of patients in the poor-prognosis subgroup were diagnosed with distant metastasis within 5 years after therapy (Figure 7C). In contrast, 62% of patients in the good-prognosis sub-group remained metastasis-free (Figure 7C). The estimated hazard ratio for metastasis-free survival after therapy in the poor-prognosis subgroup as compared with the good-prog-nosis subgroup of patients defined by the 11-gene signature was 3.762 (95% confidence interval of ratio, 3.421–20.27; P < 0.0001). Thus, the expression pattern of the 11-gene MTTS/PNS signature is strongly predictive of a short postdiagnosis and post-treatment interval to distant metastases in early-stage breast cancer patients.
Next we asked whether expression analy-sis of the 11-gene signature would be infor-mative in patients’ stratification into sub-groups with distinct survival probability after therapy in a group of 125 patients diagnosed with lung adenocarcinoma (34). Similarly to the prostate and breast cancer patients, the Kaplan-Meier analysis shows that patients with tumors dis-playing a stem cell–like expression profile of the 11-gene signature have significantly higher risk of death after therapy and therefore can be defined as a poor-prognosis subgroup (Figure 7, E–H). Median survival after therapy in the poor-prog-nosis subgroup of lung adenocarcinoma patients defined by the 11-gene BMI-1–pathway signature was 15.2 months (Figure 7G). In contrast, the median survival after therapy in the good-prognosis subgroup was 48.8 months. One hundred percent of patients in the poor-prognosis subgroup died within 3 years after therapy. Conversely, 58% of patients in the good-progno-sis subgroup remained alive (Figure 7G). The estimated hazard ratio for death after therapy in the poor-prognosis subgroup as compared with the good-prognosis subgroup of patients defined by the 11-gene signature was 3.589 (95% confidence interval of ratio, 2.910–46.67; P = 0.0005).
Next we examined whether the 11-gene MTTS/PNS signature would be useful in defining subgroups of patients diagnosed with an early-stage lung adenocarcinoma and having a statistically significant difference in survival probability after therapy. In the group of patients diagnosed with stage 1A lung adenocarcinoma (Figure 7H), the median survival after therapy in the poor-progno-sis subgroup defined by the 11-gene signature was 49.6 months. Fifty-three percent of patients in the poor-prognosis subgroup died within 5 years after therapy. In contrast, 92% of patients remained alive in the good-prognosis subgroup (Figure 7H). The estimated hazard ratio for death after therapy in the poor-progno-sis subgroup as compared with the good-prognopoor-progno-sis subgroup of patients defined by the 11-gene signature was 8.909 (95% confi-dence interval of ratio, 1.418–13.12; P = 0.01).
[image:13.585.52.346.113.253.2]Based on this analysis, we concluded that detection of a stem cell–like expression profile of the 11-gene MTTS/PNS signature in primary tumors from patients diagnosed with early-stage prostate, breast, and lung carcinomas is associated with a high propensity toward metastatic dissemination and significantly higher risk of poor therapy outcome. Interestingly, therapy out-come in cancer patients diagnosed with other types of epithelial Table 5
11-Covariate prostate cancer recurrence predictor model
Covariate Coefficient SE Significance, Confidence Confidence P interval, low 95% interval, high 95%
Signature –2.3537 0.9858 0.0170 –4.2858 –0.4215
KI67 2.2832 0.7823 0.0035 0.7499 3.8166
ANK3 –0.1563 0.7197 0.8280 –1.5670 1.2543
FGFR2 –0.8295 0.4955 0.0941 –1.8007 0.1418
CES –1.6403 0.8113 0.0432 –3.2303 –0.0502
Pre-RP PSA 0.0493 0.0251 0.0495 0.0001 0.0985 RP GLSN SUM 0.2850 0.2385 0.2322 –0.1825 0.7525
SM 1.0609 0.4648 0.0225 0.1499 1.9720
Sem Ves Inv 0.6016 0.5064 0.2348 –0.3909 1.5941
Age 0.0311 0.0351 0.3755 –0.0377 0.0999
ECE 0.9296 0.4360 0.0330 0.0751 1.7842
cancers, such as ovarian and bladder cancers, seems to manifest similar association with distinct patterns of expression of the 11-gene signature (Figure 7, I–N).
Expression of the 11-gene signature predicts therapy outcome in patients diagnosed with nonepithelial malignancies. Altered BMI-1 expression was implicated recently in several nonepithelial malignancies, such as B cell non-Hodgkin lymphoma (35) and pediatric brain tumors (36). We therefore sought to analyze whether the 11-gene MTTS/PNS signature would be useful in defining subgroups of patients diagnosed with nonepithelial cancers and having a statistically significant difference in survival probability after therapy. Using Kaplan-Meier method, we analyzed the prognostic power of the 11-gene signature in patients diagnosed with diffuse large B cell lymphoma, mantle cell lymphoma, acute myeloid leukemia, meso-thelioma, medulloblastoma, and glioma (Table 2). Kaplan-Meier analysis demonstrates that a stem cell–like expression profile of the 11-gene signature in primary tumors is a consistent powerful predictor of a therapy failure and short survival in cancer patients diagnosed with 5 distinct types of nonepithelial cancers (Figure 8, A–F). Consistent with our findings, an increased BMI-1 expression in human medulloblastomas was demonstrated in a recent study (37). Taken together, these data seem to imply the presence of a conserved BMI-1–associated pathway(s) similarly engaged in both
neural stem cells and a highly malignant subset of human cancers diagnosed in a wide range of organs and uniformly exhibiting a marked propensity toward metastatic dissemination as well as a high probability of unfavorable therapy outcome.
Discussion
[image:14.585.68.522.83.406.2]A growing number of expression profiling studies provide experi-mental evidence indicating the presence of a transcriptionally distinct subtype of human solid tumors manifesting a marked propensity toward metastatic dissemination, highly malignant clinical behavior, and a high probability of poor therapy out-come in cancer patients diagnosed with early-stage carcinomas of various origins (refs. 15, 38–40; this study). These results are consistent with the idea that, at least in a subset of human solid tumors, the acquisition of full metastatic potential, including an emergence and seeding of potent metastasis precursor cells, is a relatively early event in tumor progression. Collectively, these data suggest an early involvement, in development of this transcrip-tionally defined subtype of human carcinomas, of a highly malig-nant combination of mutant alleles conferring the proclivity to metastasize (40) and/or an engagement of unique unconventional cellular targets such as stem cells and/or early progenitor cells in transformation and tumor progression.
Figure 8
One of the hallmark biological features of normal stem cells is the ability to fuse spontaneously in vitro and in vivo with other cell types, leading to formation of reprogrammed viable somatic cell hybrids (41–44). Accumulation of normal stem cells in experimen-tal tumors in vivo has been demonstrated in several studies (45, 46). Furthermore, most recent studies demonstrated that committed myelomonocytic cells such as macrophages can produce func-tional epithelial cells by in vivo fusion (47), thus extending the number of cell types that might serve as hypothetically “eligible” fusion partners for tumor cells. It would be of interest to study how cancer cells co-opt stem cell–like transcriptome into progres-sion pathways and whether some human carcinomas could attract stem cells by mimicking a stem cell “niche” microenvironment, thus directly engaging normal stem cells into malignant process via cell fusion. One interesting endpoint of our analysis is that a relatively small set of coregulated transcripts appears to predict clinical outcome in a large number of human tumors represent-ing 10 distinct types of cancer. Perhaps inclusion of a relevant bio-logical model in the signature discovery protocol was an essential component of the successful hit selection, since recent metaanaly-sis of cancer microarray data that was based solely on statistical approaches did not identify an outcome signature common to multiple cancer types (48).
It has been suggested that sets of coordinately expressed genes defined as cancer-associated gene expression signatures might reflect the cell of origin of cancer (49). Unlike stem cells in the state of CNS neurospheres that are recovered from the CNS, stem cells in the state of PNS neurospheres might be present in many (if not all) peripheral tissues and therefore are more likely and readily accessible cellular targets for direct involvement into malignant process. It remains to be elucidated whether the pre-cision of analytical protocols used in this study was sufficient to identify the broadly applicable gene expression markers of the
BMI-1-pathway activation and normal stem cell engagement in malignant progression of human cancers. Protein products of 2 genes upregulated in the MTTS/PNS signature profile (BUB1 and HEC1) are known to play an important role in the spindle assembly mitotic checkpoint. A recent study suggested a novel mechanism leading to development of frequent aneuploidy in human cancer due to aberrant expression of Mad2 protein, inap-propriate activation of the spindle checkpoint, and, eventually, aneuploidy (50). Both BUB1 and HEC1 proteins play a key role in the assembly of checkpoint proteins, being required for Mad2 recruitment to the kinetochores (51, 52); this suggests that aber-rant BUB1 and HEC1 expression might contribute to and/or reflect the altered function of the mitotic checkpoint in meta-static cancer cells.
In conclusion, using a mouse/human comparative transla-tional genomics approach, we identified an 11-gene signature that consistently displays a stem cell–like expression pattern in metastatic lesions of prostate carcinomas recovered from multiple distant target organs. Our results indicate that a stem cell–resembling expression profile of the 11-gene signature is associated with a highly malignant clinical course of disease pro-gression and predicts high likelihood of therapy failure in mul-tiple types of human cancer. Statistically significant negative prognostic value of a stem cell–like expression of the 11-gene signature in early-stage primary solid tumors of diverse origin suggests the presence of a genetically distinct subtype of human carcinomas with high propensity toward metastatic
dissemina-tion even at the early stage of disease progression. Further elu-cidation of possible causal relationships between activation of a stem cell–resembling gene expression program and malignant behavior of human carcinoma cells should have considerable theoretical and practical implications.
Methods
Clinical samples. Expression profiling data of primary tumor samples obtained from 1,122 cancer patients representing therapy-outcome cohorts for 10 types of human cancer (Table 2) were analyzed in this study. Microarray analysis and associated clinical information for 32 clinical samples (23 primary prostate tumors and 9 distant metastatic lesions) used to delineate the expression profiles of human prostate cancer metastases were reported previously (13). Two clinical outcome sets comprising 21 (outcome set 1) and 79 (outcome set 2) samples were used for analysis of the association of the therapy outcome with distinct expression profiles of the 11-gene signature. Original gene expression profiles of the 21 clinical samples analyzed in this study were report-ed elsewhere (14). Primary gene expression data files of clinical sam-ples as well as associated clinical information can be found at http:// www-genome.wi.mit.edu/cancer/.
The prostate tumor tissues constituting the second clinical outcome set were obtained from 79 prostate cancer patients undergoing therapeutic or diagnostic procedures performed as part of routine clinical management at the MSKCC (New York, New York, USA). Clinical and pathological fea-tures of 79 prostate cancer cases constituting the validation outcome set are presented elsewhere (15). Median follow-up after therapy in this cohort of patients was 70 months. Samples were snap-frozen in liquid nitrogen and stored at –80°C. Each sample was examined histologically using H&E-stained cryostat sections. Care was taken to remove nonneoplastic tissues from tumor samples. Cells of interest were manually dissected from the frozen block and other tissues trimmed away. All of the studies were approved by the MSKCC Institutional Review Board.
Expression analysis data for tumor samples obtained from 125 lung adenocarcinoma patients as well as associated clinical information were reported elsewhere (34). Original work describing gene expression profiles of the set of 97 clinical samples of early-stage breast cancer was reported elsewhere (33). Primary gene expression data files of clinical samples as well as associated clinical information have been previously described (33). To date, our analysis includes 1,153 therapy-outcome samples from patients diagnosed with 11 distinct types of cancer (Table 2): prostate can-cer (100 patients); breast cancan-cer (97 patients); lung adenocarcinoma (211 patients); ovarian cancer (50 patients); bladder cancer (31 patients); dif-fuse large B cell lymphoma (298 patients); mantle cell lymphoma (MCL, 92 patients); mesothelioma (17 patients); medulloblastoma (60 patients); glioma (50 patients); and acute myeloid leukemia (116 patients).
Cell culture. Cell lines used in this study were previously described (16). The LNCap- and PC-3–derived cell lines were developed by consecutive serial orthotopic implantation, either from metastases to the lymph node (for the LN series) or reimplanted from the prostate (Pro series). This procedure generated cell variants with differing tumorigenicity, fre-quency, and latency of regional lymph node metastasis (16). Except where noted, cell lines were grown in RPMI1640 supplemented with 10% FBS and gentamycin (GIBCO; Invitrogen Corp.) to 70–80% confluence and subjected to serum starvation as described previously (16), or maintained in fresh complete media, supplemented with 10% FBS.
Anoikis assay. Cells were harvested by 5-minute digestion with 0.25% trypsin/0.02% EDTA (Irvine Scientific), washed, and resuspended in
serum-free medium. Cells at a concentration of 1.7 × 10⁵ cells per well