2018 International Conference on Computer, Communications and Mechatronics Engineering (CCME 2018) ISBN: 978-1-60595-611-4
Evolutionary Algorithm for Solving the Problem of Grazing Yak
Population in Three Rivers Source Region
Mei-yun DU
1, Xiao-feng QIN
1, Chen ZHANG
1, Yu-an ZHANG
1,*,
Ren-de SONG
2and Zi-jie SUN
11Department of Computer Technology and Applications, Qinghai University, 810016, Xining, China 2Yushu Prefecture Animal Husbandry and Veterinary Station, 815000, Yushu, Qinghai, China
*Corresponding author
Keywords:Evolutionary algorithm, Three rivers source, Yak, Optimization.
Abstract. The three rivers source region is a complex ecosystem with alpine grassland characteristics. The animal husbandry is mainly based on Breeding yak. Breeding yak is the mainstay of the herdsmen's production and life. The model of this paper mainly through the yak population structure of the relevant factors, using the evolutionary algorithm, taking the maximum net monetary income as the objective function, the optimal yaks’ sales scheme is given without destroying the ecological environment. The experimental results show the validity and practicability of the model and evolutionary algorithm. This study can provide guidance for the structure adjustment and decision-making in three rivers source area.
Introduction
China's grassland area ranks second in the world, and the total area of natural grassland is about 400 million hectares, accounting for about two-fifths of the total territory of the country. The vastness of grassland area not only lays a foundation for the development of grassland animal husbandry, but also provides guarantee for the development of animal husbandry [1]. As a unique livestock species in the three rivers source region, yaks are the only dominant cattle species that can make full use of plateau grassland resources and unique genetic resources. The yak provides the Tibetan people with a source of material necessary for production and living, and has a very close relationship with the production, living, culture and religion of the Tibetan people [2-5].
However, due to the excessive grazing of herders, the grassland is seriously degraded and the quality of pasture is declining year by year. As a result, the yak farming is irregular, which seriously hinders the rapid development of animal husbandry in the region. Therefore, considering the coordinated development of ecology, economy and environment, it is necessary to establish a scientific grazing optimization model by using evolutionary algorithms and give herders an optimal sales plan.
Mathematical Modeling
Yak Population Growth Model
We take the cold season grazing as the initial grazing time. The yak breeds in the summer. When yaks transfer from the cold season pasture to the warm season pasture, yaks in each age group increase by one year and enter the next age group. Therefore, the change of yak population structure can be express as formula (1).
, 1, 1 1, 1
, 1, 1 1, 1
*
*
S W W
i j i j i j
S W W
i j i j i j
F SRF F
M SRM M
When the warm season pasture is converted to the cold season pasture, the female yaks are breeding and breeding in the summer and autumn to produce yak. At this time, the population size of the yak in each age group has changed. This model stipulates that the yak will breed between 3 and 11 years old. its population structure changes as formula (2).
11
0, , , , 0,
3 11
0, , , , 0,
3
, , , ,
, , , ,
0.5* ( * * )
0.5* ( * * )
*
*
W S S
j i j i j i j j
i
W S S
j i j i j i j j
i
W S
i j i j i j i j
W S
i j i j i j i j
F BRF F SRF KF
M BRF F SRM KM
F SRF F KF
M SRM M KM
(2) In formula (2), BRF indicates the reproductive rate of female yaks, and KF and KM respectively represent the sales number of female yaks and male yaks at the end of a grazing year.Environmental Model
For the simulation of the alpine meadow pasture environment, we refer to the impact of climate warming on the climate production potential of alpine meadows which published by Li Yingnian [6], the total change of pasture in this model can be expressed as formula (3).
1
* *
j j j
SumG Envir S GA R
(3) In formula (3), SumGj represents the total amount of pasture for the j-th year, Envir is the productivity of the pasture environment, S is the grassland area of the grazing year, GA indicates the current amount of pasture at the beginning of the grazing season, and R indicates the nutrient content of the pasture grazing after one year. The attenuation coefficient is 0.68 in the model.
Yak Individual Weight Gain Model
The weight gain of yaks mainly includes the comprehensive weight gain of forage grass and the weight gain of supplementary feed. Formula (4) is the relationship between the individual weight gain of yaks and the pasture in the whole grazing year. Formula (5) is the relationship between the weight gain of the yaks and the supplementary feeding, and the formula (6) is the total weight of the yaks.
, 0.4*( , * ) 0.6*( , * )
i j j i j j j i j j
YW SN D AX EN D AX
(4)
, , * , i j i j i j
SC SA SX
(5)
, , , ,
i j i j i j i j
W CZ YW SC
(6) Among them, YWi j, indicates the comprehensive weight gain of forage, SCi j, indicates the weight gain of supplementary feed, CZi j, indicates the initial weight of yak, Wi j, indicates the total weight of yak individual, D indicates spatial stability and grassland recovery ability, AX indicates average grazing intensity, SN indicates the level of forage grass nutrition at the beginning of grazing, EN indicates the level of forage at the end of grazing, SC indicates the weight gain of supplementary feed, SA indicates feed conversion rate, and SX indicates the total amount of supplementary feed.
Objective Function
(9). Expenditure includes the formula for supplementary feeding expenditure (10) and the formula for additional expenditure (11).
12
1 3( , * , * )
*
k
k j i i j i j i
S k
EM EMF F BRF
EM EM EMP
(7)
12
1 0((1 , )* , * , (1 , )* , * , ) k
k j i i j i j i j i j i j i j
EL
SRF F ELF SRM M ELM(8)
12
1 0( , * , * , * ) k
k j i i j i j i j j
EO
KF FW MF P(9)
12
1 0(( , , )* , * , ) k
k j i i j i j i j i j
CB
F M BX CB(10)
12
, , , ,
1 1
( * * )
k
k i j i j i j i j j i
CA F CAF M CAM
(11)
k k k k k k
NE EM EL EO CB CA
. (12) Among them, EMk, ELk, EOk, CBk, CAk, and NEk respectively represent milk production income, leather earnings, profit from selling yaks, supplementary feeding expenses, additional expenses, net currency income, EMFi j, , Fi j, , BRFi, EMP, SRFi j, , SRMi j, indicates the milk yield per female calf, the number of female calves, the reproductive rate, the milk unit price, the survival rate of female calves, the survival rate of male calves, KFi j, and KMi j, respectively indicate the number of female calves and the number of male calves, Pj indicates the beef. Price
(yuan/kg), FWi j, and MWi j, mean the weight per cow (kg). BX indicates the amount of supplementary feed (kg), and CBi j, indicates the unit price of feed (yuan/kg).
Evolutionary Algorithm
With the rapid development of evolutionary algorithms, how to use evolutionary algorithms to solve yak population optimization problems more efficiently is of great significance. The evolutionary algorithm used in this paper is based on the standard genetic algorithm. The Y conditional cloud generator of the cloud model is used to replace the crossover operation of the genetic algorithm. The mutation operation performs the 1st, 2nd, and 3rd inversion mutations according to the probability. Crossover rate and mutation rate are adaptively generated according to changes in population structure and iterative algebra. The selection operator is improved on the basis of the optimal preservation strategy.
The evolutionary algorithm is as follows:
Algorithm 1: The evolutionary algorithm INPUT: Model related parameters
OUTPUT: KFi j, , KMi j,
1. Initialization: randomly generate KFi j, , KMi j, as the initial slaughter population 2. Assess individual fitness values
3. Selection strategy
4. Cross: The selected parents exchange information with each other to generate the next generation of individuals.
In Algorithm 1, Export the amount sold per grazing year. Therefore, this model considers the set of sales for all age groups in the grazing year as an individual, and i and j represent the age group and the grazing year, respectively.
Cross Rate
Crossover can make the population update continuously. The size of the crossover rate determines the update speed of the individual population. If the value is too large, it will destroy the excellent genetic model. If the value is too small, the search speed of the algorithm will be slow, and the population will not be able to evolve. Therefore, the crossover rate in this algorithm is adaptively generated according to changes of population structure and iterative algebra, which is beneficial to the algorithm to find the optimal solution.
The crossover rate calculation algorithm is as follows:
Algorithm 2: Cross rate calculation algorithm
g ← 0 m ← 0
while g< G do
for(m=0;m<POPSIZE ;m++){ if(g<=G/4)
pc_max=0.9;
else if((G/4<g)&&(g<=3G/4)) pc_max=0.8;
else
pc_max=0.7;
if(A[m].NE<FitnessSUM()/POPSIZE) pc=pc_max;
else
pc=pc_max-(pc_max-0.6)*(g/200000+0.5*(A[m].NE-FitnessSUM()/POPSIZE)/(FitnessMAX()-Fit nessSUM()/POPSIZE));}
end while
In Algorithm 2, G represents the maximum iteration algebra 100000, g represents iteration algebra, m represents the individual number, and POPSIZE represents the population size.
Mutation Rate
Appropriate variation can maintain the diversity of the population and prevent the selection of local optimum. However, if the mutation rate is too large, the algorithm approximates the random search and loses the genetic evolution characteristics. Therefore, the mutation rate in this algorithm is adaptively generated according to changes of population structure and iterative algebra, which is beneficial to the algorithm to find the optimal solution.
The mutation rate calculation algorithm is as follows:
Algorithm 3: Mutation rate calculation algorithm g ← 0
m ← 0
while g< G do
for(m=0;m< POPSIZE ;m++){ if(g<=G/4)
pm_min=0.001;
else if((G/4<g)&&(g<=3G/4)) pm_min=0.002;
else
pm_min=0.003;
if(A[n].NE<FitnessSUM()/POPSIZE) pc=pm_min;
else
pm=pm_min+(0.005-pm_min)*(g/200000+0.5*(A[n].NE-FitnessSUM()/POPSIZE )/(FitnessMAX()-FitnessSUM()/POPSIZE));}
Selection Operator
The algorithm based on the optimal preservation strategy improves the selection operator. On the basis of the optimal preservation strategy, each generation of populations is sorted according to the fitness value from small to large, and is equally divided into the front, middle and back three segments, which are selected according to the ratio of 0.6, 0.8, 1 and individuals that is lost as a result of a selection operation are randomly selected from the latter segment to complement the population. It not only utilizes the global convergence of the optimal preservation strategy, but also maintains the diversity of the population.
Result and Discussion
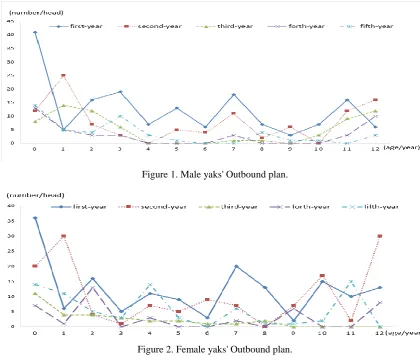
[image:5.595.82.503.293.650.2]The evolutionary algorithm is used to solve the problem of grazing yak population optimization in three rivers source area. The maximum iteration algebra is 100,000 generations, and the algorithm converges at 3800 generations. Figure 1 and Figure 2 show respectively the male yak sales plan and the female yak sales plan. The abscissa indicates yaks of different ages. The yak of the paragraph, the ordinate indicates the number of sales.
Figure 1. Male yaks' Outbound plan.
Figure 2. Female yaks' Outbound plan.
As can be seen from Figure 1, when the income is the largest, male yak from 0 to 3 years old and male yak larger than or equal to 9 years old should be sold. It can be seen from Fig.2 that the yak of the female yak that has been degraded from 0 to 3 years old and greater than or equal to 8 years old should be sold.
Conclusion
according to changes of the population structure by iterative algebra, which accelerates the optimization speed of the algorithm. As can be seen from the yak slaughter strategy, this model and evolutionary algorithm are scientific and effective.
Acknowledgment
This work is supported by Science and Technology Project in Qinghai Province (No. 2017-ZJ-717); Yushu Yak High-efficiency Breeding Technology Integration and Demonstration Project (Beijing counterpart assistance).
References
[1]. Ge Y, Chunxia L, Gaodi X. Research progress on grassland ecosystem service function. Resource science, 2005, 27(6): 172-179.
[2]. Niu C, Du M, Ge Y, et al. Realization of visualization software for yak body weight calculation (VBWC) in three-river headwaters region based on body size[C]// International Congress on Image and Signal Processing, Biomedical Engineering and Informatics. IEEE, 2018.
[3]. Bingfeng L I, Niu C, Yong G E, et al. Genetic algorithm for solving problem of yak population structure optimization in alpine meadow[J]. Journal of Qinghai University, 2017.
[4]. Li Y. The Influence of Climatic Warming on the Climatic Potential Productivity of Alpine Meadow[J]. Acta Agrestia Sinica, 2000, 89(3Pt2):1088-92.
[5]. Li Y, Wang Z, Pi N, et al. Linear programming model and optimal exploitation strategies for livestock populations in alpine meadow ecosystem[J]. Chinese Journal of Applied Ecology, 1992.