1. Introduction
In the study of solar-terrestrial physics there is frequently a requirement to combine and compare data from different instruments, of either the same type or of different types (e.g., riometers and magnetometers). Studies may take one of several forms. Global studies examine data from one or more instrument types and from many stations. Case studies require data from many different instrument types, while the main aspect of a statistical study is the analysis of large volumes of data. To enable efficient analysis of the many dif-ferent datasets it is highly desirable that a software tool exists to allow the datasets to be processed and presented in a common way.
The recently proposed Global Riometer Array (GloRiA) aims to link riometer data from around the world. The hundred-plus instruments are united in measuring trans-iono-spheric absorption of cosmic radio waves. However, variations in their construction (e.g., the number and type of antennas, data recording format, and for imaging riometers, the design of the beam-forming network) result in over 20 different variations. Amalgamating data from such a varied collection of instruments illustrates the need for a flexible software tool which can accommodate their differences, but highlight their similarities.
There are a number of software tools for the processing and visualisation of specific
Research note
A Multi-Instrument Data Analysis toolbox
Steve R. Marple and Farideh Honary
Department of Communication Systems, Lancaster University, Lancaster, LA1 4YR, U.K.
(Received December 20, 2003; Accepted March 24, 2004)
Abstract: In the study of solar-terrestrial physics there is frequently a requirement to combine and compare data from different instruments, of either the same type or of differ-ent types. This paper presdiffer-ents a Multi-Instrumdiffer-ent Analysis (MIA) toolbox for Matlab. By using object-oriented programming techniques it is shown that the same tools can be applied to data from different instruments, or even instruments of different types. A coher-ent structure enables MIA to display image plots, keograms and movies for all imaging instruments, regardless of type. Data files are joined automatically so that file boundaries do not interrupt data processing. Although a graphical user interface is available all opera-tions can be performed by scripts, thereby permitting automated data processing. By sim-plifying data processing MIA aids the creation of new data products such as energy maps and event databases. MIA currently supports riometers and imaging riometers, magne-tometers and all-sky cameras.
key words: data processing, data visualisation, software
data types. For EISCAT data the most notable is GUISDAP (Lehtinen and Huuskonen, 1996). In the SuperDARN community Go (S. Milan, Private communication) is widely used. Although Go can visualise data from other instruments such as magnetometers and all-sky cameras neither of these software tools address the issue of coherent, generalised data processing from different instrument types. Progress in this area has been made with the “Solar-Terrestrial Data Analysis and Reference System” (STARS) (Murata, 2002). STARS was not available at the time and no existing software was found to be suitable for our purposes. This paper describes an implementation created by the authors, the Multi-Instrument Analysis toolbox (MIA).
We begin by describing the design goals for the project. The implementation section describes the structure of MIA and how it is used to ensure generalised data processing and visualisation procedures. In the results section we describe the common operations which can be performed by MIA, and also some operations for specific data types. Some examples of studies carried out using MIA are also given.
2. Design goals
At the beginning of the project a number of design goals were set in order that the completed software would fulfill our requirements. Some of our users prefer the Microsoft Windows environment, while for automated data analysis others prefer Unix or Linux, so a multi-platform solution was preferred. A modular approach was needed so that additional instrument types could be included when required. An extensiblesystem was necessary so that additional functionality could be added without requiring the modification of existing program code. It was specified that important metadata (start and end times, temporal reso-lution of the data, creator, creation time) should be kept with the data. Plotting and other visualisation procedures must fully document the data, which requires knowledge of basic information such as the start and end times of the data. For data quality purposes it is essen-tial to know when the data was created so that if programming bugs are discovered it is pos-sible to identify which data may have been affected. A log of any significant or non-stan-dard processing procedures should also be kept so that it is possible to perform the same processing steps on other datasets. We also wished to log data usage to an external data-base, which is a requirement for the funding of some instruments.
To maximise the usefulness of the software it is important that as many instruments as possible (for a given type) be supported, which necessitated investigation of the ways in which the instruments varied. For example, in the case of riometers this meant that a fixed number of beams could not be assumed, the number can vary from one wide beam to over 800 imaging beams (Little and Leinbach, 1958; Nielsen and Hagfors, 1997). Further infor-mation about the features specific to each instrument type is given in the results section.
tools. The use of common tools is important not only to minimise the effort of writing and maintaining software but also to ensure that exactly the same procedures are applied.
The ability to perform statistical analysis was particularly important. A graphical user interface (GUI) was planned from the beginning of the project. However, enforced use of a GUI is not conducive to studies where large volumes of data must be analysed. For such studies a programmatic method is necessary, which can be accomplished by ensuring that the GUI functions act as wrappers–processing user-input and calling other functions to do actual data processing.
Previous experience had indicated the need for users to be able to customise the pro-gram behaviour without requiring their own installations of the software or by modifying the standard installation. It was also recognised that site-level customisation would be required when MIA is used at other institutions.
3. Implementation
Matlab was chosen for the programming language for a number of reasons. It is multi-platform. It has good support for data visualisation (e.g., line plots, surfaces, images, and contour plots, in both two and three-dimensional forms). It also includes functions to create complex graphical user interfaces. Toolboxes exist which provide signal-processing func-tionality, wavelet analysis and geographical mapping. These toolboxes have been used extensively as they are well-tested, fully documented and reduced the time and effort in writing and maintaining MIA.
User-defined functions can be created either by writing Matlab code (“.mfiles”) or by linking to external functions written in C, C++ or Fortran (“MEX files”). The majority of MIA code is written as “.mfiles”, which are interpreted by Matlab. Thus MIA requires the Matlab runtime environment.
With version 5, Matlab introduced object-oriented programming (OOP) features: classes, inheritance, function overloading, and operator overloading. When discussing the OOP features we will follow the vocabulary used for C++ (Stroustrup, 1997). The OOP tures of Matlab were used as they provide the ideal means to emphasise the common fea-tures between different datasets whilst preserving the important differences. There are two main types of classes within MIA, data classes, which store instrument data, and instrument classes, which hold the details about an instrument. Inheritance is used to ensure each type provides the appropriate behaviour.
3.1. Instrument classes
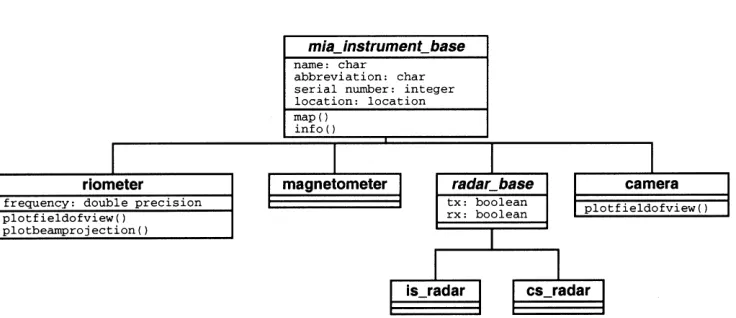
Unlike C++ Matlab does not have a formal mechanism to declare abstract classes*so we have used the convention of appending “_base” to all class names which should be considered to be an abstract base class. From this base class are derived classes for riome-ters, magnetomeriome-ters, cameras and radars. The class hierarchy for instrument classes in shown in Fig. 1. The boxes represent classes. The first panel of each box contains the class name, the second panel lists important member variables and their types while a third panel lists any important member functions. Lines between boxes indicate inheritance. It is important to note that derived classes contain the data from their inherited classes. There-fore member functions are also available to any derived classes.
It was decided that to include all individual metadata associated with an instrument was not convenient or extensible. For example, in the case of riometers that approach would have required the antenna radiation pattern to be calculated and stored, consuming both CPU time and memory storage. Instead a set of infofunctions were provided so that such information could be requested at a later time, if and when required.
Within MIA there are instrument classes for which no data classes yet exist, notable examples are the is_radarand cs_radarclasses. Corresponding data classes may be added at a later date. The inclusion of those instrument classes allows MIA to be aware of radars such as EISCAT and CUTLASS, which is useful when constructing geographic maps of instrument locations.
3.2. Data classes
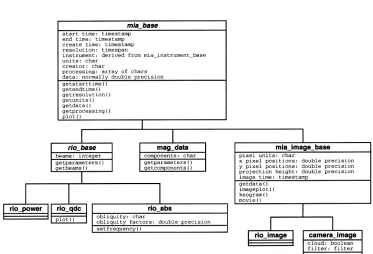
[image:4.515.77.445.86.245.2]All of the data classes are derived from a common abstract base class (mia_base) which stores crucial metadata including start time, end time, temporal resolution, instru-ment, and data units, in addition to storing the data matrix itself. The base class therefore satisfies the requirement of emphasising the similar aspects of the data, regardless of its source. The additional metadata and functional requirements of the various instrument types are provided by derived classes. For instance, a dedicated class is derived to store riometer
Fig. 1. Simplified instrument class hierarchy.
beam numbers, while another dedicated class is derived to store the magnetometer compo-nent names. A simplified version of the data class hierarchy is shown in Fig. 2. The data classes represent the internal data structure used within MIA and do not require a new file format. Loading of stored data is most easily accomplished if data is stored as data class objects in Matlab data files though this is not a requirement.
Data sets which can be considered as images in some coordinate system have addition-al metadata requirements: the coordinate system type (e.g., geographic or geomagnetic), location of the pixel centres along the X and Yaxes, and possibly an assumed projection height. The image metadata is stored within another abstract class.
[image:5.515.70.443.84.338.2]From Fig. 2 it can be seen that separate classes have been used for riometer received power (rio_power), quiet day curves (rio_qdc), and absorption data (rio_abs). This is necessary to implement specific behaviour (member functions) for these three distinct types of riometer data. All of these riometer classes are derived from rio_baseand are termed “beam data” since they contain independent sets of scalar values, one set per beam. Thus data from both traditional widebeam riometers and imaging riometers can be processed in a common way. To exploit the full potential of imaging riometers the data can be remapped onto a rectilinear grid (in geographic or geomagnetic coordinates) and be included as rio_imagedata. The first method (“beam data”) is more appropriate for cases where spatial interpolation is not wanted, or when widebeam riometer data is needed. The second method (“image data”) is required whenever data mapped on a rectilinear grid is needed, such as for keograms, images and movies. The two different approaches enable a combined analysis method for both widebeam and imaging riometers without sacrificing
the imaging capability of imaging riometers.
MIA has been carefully designed so that data can be included from a large variety of instruments. In most cases all that is required to support an instrument is knowledge of the basic instrument parameters. Non-Matlab data files may be accessed transparently by pro-viding an import function to read the data file(s). The load functions are also responsible for logging data usage. MIA will automatically join data from different files so that file bound-aries are not an obstacle to long-duration studies. In many cases the duration of data files has been kept short deliberately (often one hour for imaging riometers) so that joining data across file boundaries was a common and well-tested event, not a special case.
3.3. Relationship between MIA, Matlab and external functions
Although Matlab provides many general purpose functions a major goal of MIA was to provide an interface where different types of data could be treated in the same way, for instance, so that the command plot(data)would work and produce meaningful results regardless whether the data was from a magnetometer or a riometer. It was therefore neces-sary for MIA to provide high-level functions to distinguish the necesneces-sary differences on the user’s behalf.
MIA simplifies the visualisation of data objects by building on the Matlab plotting functions to provide high-level visualisation routines which automatically generate a descriptive plot header, label axes and indicate data units appropriate to the data being dis-played. For some data classes the units may be fixed (e.g., nT for magnetometer data) or vary according to magnitude (e.g., Rayleighs or kilo-Rayleighs for all-sky camera data). Universal times are always indicated with hours, minutes and seconds as appropriate, with the markers placed at sensible values (for instance, on the hour), even if the plot did not begin at the start of a day, hour or minute. These high-level plotting routines require the structured class layout in order to interrogate the data class about its own display prefer-ences, e.g., the units to use and what multiplier to use for them.
For the geographic mapping the free m_mapmapping toolbox is used, allowing high-resolution maps to be produced from published coastline datasets. On top of this toolbox MIA provides convenient methods to plot instrument locations and instrument fields of view. For riometers the beam projection can also be plotted. Data can also be plotted onto geographic maps. If necessary MIA will automatically convert between different coordinate systems (e.g., geographic and geomagnetic) using the GEOCGM Fortran library, linked as a MEX file.
3.4. Filters
fil-tering, and ndifferent filter algorithms. If a new filter algorithm is implemented then all m
functions require editing in order to be able to make use of the new algorithm. If many pro-grammers create new functions which use filtering and new filter algorithms the software quickly becomes impossible to maintain. Fortunately an object-oriented programming tech-nique called functors(or function objects) (Stroustrup, 1997, pp. 514–515) overcomes this problem. For each filter algorithm a separate filter class is created with its ownconfigure
and filterfunctions. Filters are then simply objects of the appropriate class, with every filter object containing its own filter parameters. For automated programming the filter objects are created with the correct parameters; when using the GUI the user can interac-tively configure each filter by using the class-specific configurefunction. Filtering is now easily accomplished: the only parameters required are the filter object and the data object. All the filter parameters are stored inside the filter object, and as the different filters types are objects of different classes they each call their own filterfunction. Thus any function inside MIA can implement filtering without requiring anyknowledge of the possi-ble filter operations or the parameters it requires.
3.5. Customisation
Matlab uses a search path to determine which instance of a function to execute. By including user and installation-specific directories at the start of the search path it is possi-ble to customise all MIA functions. Careful design of the instrument info functions enables users to add their own instrument definitions, and if necessary provide additional or alternative information about each instrument. Thus, by design, there is not a central reposi-tory responsible for assigning instrument definitions, a decision taken to ease adoption of MIA by other institutions.
3.6. Other classes
One of the problems regularly encountered was the computation of quantities involv-ing dates and times. Two classes were created to encapsulate the complexities of the vary-ing number of days in a month, leap years etc. A timestampclass is used to store date and time information, while a timespanclass is used to store durations. Operator over-loading is used so that time calculations can be written in an intuitive way using the stan-dard symbols +, −, * and /. Not all operations are sensible, the subtraction of a time-stampfrom a second timestampresults in a timespan(duration), but the addition of two timestamps is not meaningful and results in an error. Multiplication and division of a
timespanwith a real number are also sensible operations and so have been implemented.
4. Results
the Australian Antarctic Division. The success of the Global Riometer Array will depend on the practicality of combining data from the many varied riometers around the world, a task MIA is able to accomplish.
For all riometer data types (received power, quiet day curve (QDC) and absorption) visualisation methods include line plots, keograms, images and movies. Absorption data can either be calculated on-the-fly from received power and a quiet day curve, or by loading absorption values directly. The exact behaviour is dependent on the riometer configuration data. On-the-fly calculation is slower but the opportunity to substitute alternative quiet day curves provides greater flexibility, for instance, to obtain absorption data from a period for which a quiet day curve has not been generated. MIA contains methods for the creation and validation of riometer QDCs. Also included are functions for the calculation of antenna radiation patterns for both imaging and widebeam riometers. Knowledge of the radiation pattern enables MIA to implement effective obliquity factors (Hargreaves and Detrick, 2002) to include the effect of off-axis signal contributions.
MIA can include data from 40 different magnetometers, orientated with both (H, D, Z) and (X, Y, Z) coordinate systems. Visualisation functions include single and stacked magne-tograms. Data processing procedures include generalised spike removal (using functors) and the creation of quiet day curves. All image data formats can be presented as keograms, images and movies. MIA is able to produce new data products by combining existing MIA-compatible datasets. For example, by combining all-sky camera data from the Digital All-Sky Imager (DASI) with riometer data from IRIS, MIA is able to calculate maps of the characteristic energy of the precipitating particles (Kosch et al., 2001). Some examples of studies facilitated by MIA are given.
One of the design goals of MIA was to enable automated analysis of large volumes of data. MIA has successfully been used to perform automatic detection of riometer absorption events, from the entire dataset of the Kilpisjärvi Imaging Riometer, IRIS (Browne et al., 1995). Also using MIA, data from the Skibotn CCD All-Sky Imager (SCASI) was used to create a database of cloud-free periods at Skibotn (Seviour et al., 2003). The events data-base search engine (http://www.dcs.lancs.ac.uk/iono/event/) can perform correlated searches of these derived datasets.
5. Conclusions
MIA provides a coherent, generalised programming framework which facilitates the analysis of data from a diverse range of scientific instruments. For ground-based STP instruments it has been demonstrated that the implementation of a common data processing and visualisation tool is entirely feasible. Indeed, MIA is actively used at Lancaster Univer-sity, to support scientific studies, in the automatic preparation of summary plots, and to pre-pare user-defined data/plots requested from a web form. It is also in use at institutions in Japan and America. No attempt has been made to incorporate satellite data but no assump-tions have been made which prevent inclusion at a later date.
In order to provide a coherent framework data and instrument classes had to contain a number of “helper” functions, for instance to indicate the datalabel used on plots and whether or not the data units should autoscale or be used with a fixed multiplier (e.g., nano). The common functions for plotting and mapping had to use these functions as they are unable to make any assumptions about the data on which they operate. For a small number of data classes the coherent approach probably results in an increase in the total program-ming code required. As more data classes are added the benefit of common plot routines becomes more apparent. Had specialised routines for each data type been used the advan-tage of a common look to the data visualisation and a common programming interface for data processing would have been lost. The coherent framework possibly results in a small decrease in processing speed, though this has to be balanced against time and effort to implement and maintain the software. Improvements in computer hardware mean that it is preferable to sacrifice processing efficiency somewhat in order to gain reductions in man-power requirements.
OOP techniques have been used to provide relationships between different data types, with the aim to always emphasise their similarities, yet never conceal important differences. By using functors all MIA functions are able to filter data without prior knowledge of the filter type or its parameters. If MIA had been implemented using the traditional function-oriented approach then the modular and extensible filter behaviour would not have been possible. Encapsulation was used to hide the complexities of date and time. MIA provides a common method by which data can be loaded from disk, without concerning the user about file formats or file boundaries.
In the future, new data and instrument types will be added as and when required. We plan to optimise the loading of some non-Matlab data files by using C MEX functions. We will also investigate the use of non-proprietary data formats to identify a possible alterna-tive to Matlab’s own .mat files. The use of non-proprietary data formats (e.g., CDF, NetCDF or HDF) will allow easier exchange of data with non-MIA users.
Acknowledgments
T. J. Rosenberg and D. L. Detrick (University of Maryland) for the Iqaluit and Sondre Stromfjord imaging riometer data, and J. Manninen (Sodankylä Geophysical Observatory) for the Finnish riometer data. Matlab is a trademark of The Mathworks Inc.
The editor thanks Drs. M. Nishino and P. Stauning for their help in evaluating this paper.
References
Bailey, D.K. (1964): Polar-cap absorption. Planet. Space Sci., 12, 495–541.
Browne, S., Hargreaves, J.K. and Honary, B. (1995): An imaging riometer for ionospheric studies. Electron. Com-mun. Eng. J., 7(5), 209–217.
Hargreaves, J.K. (1995): The Solar-Terrestrial Environment. Cambridge, Cambridge University Press, 420 p. (ISBN 0-521-42737-1).
Hargreaves, J.K. and Detrick, D.L. (2002): Application of polar cap absorption events to the calibration of riometer systems. Radio Sci., 37 (3), 7/1–7/11.
Kosch, M.J., Honary, F., del Pozo, C.F., Marple, S.R. and Hagfors, T. (2001): High-resolution maps of the charac-teristic energy of precipitating auroral particles. J. Geophys. Res., 106(A12), 28925–28937.
Lehtinen, M.S. and Huuskonen, A. (1996): General incoherent scatter analysis and GUISDAP. J. Atmos. Terr. Phys., 58(1/4), 435–452.
Little, C.G. and Leinbach, H. (1958): Some measurements of high-latitude ionospheric absorption using extrater-restrial radio waves. Proc. IRE, 46, 334–348.
Murata, K.T. (2002): A software system designed for solar-terrestrial data analysis and reference via OMT methodology. Today and Tomorrow of the Science and Technology Exchange between Ehime Universi-ty-Japan and École Centrale de Nantes, France, 16–22.
Nielsen, E. and Hagfors, T. (1997): Plans for a new rio-imager experiment in Northern Scandinavia. J. Atmos. Sol.-Terr. Phys., 59, 939–949.
Seviour, R., Kosch, M. and Honary, F. (2003): Identification of clouds and aurorae in optical data images. N. J. Phys., 5, 6.1–6.7.